适用于MetaTrader 4的付费EA交易和指标 - 16

Introducing Volume Orderflow Profile , a versatile tool designed to help traders visualize and understand the dynamics of buying and selling pressure within a specified lookback period. Perfect for those looking to gain deeper insights into volume-based market behavior! MT5 Version - https://www.mql5.com/en/market/product/122657 The indicator gathers data on high and low prices, along with buy and sell volumes, over a user-defined period. It calculates the maximum and minimum prices during this

货币强度计,为您提供当前哪些货币强,哪些货币弱的快速视觉指南。 该仪表测量所有外汇交叉货币对的强度,并对它们进行计算以确定每种货币的整体强度。 我们根据 28 对的趋势计算货币的强度。
.货币强度计是指标的通用名称,用于显示您是在处理强货币还是弱货币。这种基于算法的指标依赖于各种货币对的汇率来提供每种货币的强弱程度。
通过访问我们的 MQL5 博客,您可以下载该指标的免费版本。 购买前试用,不受 Metatrader Tester 限制: 单击此处
1. 文档 所有趋势货币强度文档(说明)和策略详细信息均可在我们 MQL5 博客的这篇文章中找到: 单击此处。
2. 联系方式 如果您有任何问题或需要帮助,请通过私信联系我。
3. 作者 SAYADI ACHREF,金融科技软件工程师,Finansya 创始人。

Multi instrument and multi time frame EA, with the best indicators. The MSD EA can be used for automated and manual trading. Click on the '?' button on the dashboard to obtain information about the various elements of the MSD EA. Uses ATR Take Profits, ATR Stop Losses and ATR Trailing Stops. Comes with an FX Currency Strength meter and a Market Sessions indicator. Has the option to place Trade Lines (Buy, Sell, Close, Alarm). When the price reaches the trendline, the EA will perform the approp

GOLD SCALPING EA - 是 XAUUSD(黄金)对的全自动交易系统 - 非常安全且增长稳定。
这是目前市场上最稳定的黄金 EA 之一 - 每月在 XAUUSD 对上进行大约 20-40 次交易。
GOLD SCALPING EA 也适用于 Prop_firm 交易和 FTMO 挑战。
使用“评论”部分的 Set_file 来使用/测试 EA。
EA 功能: - 系统安全,不使用任何危险方法,如网格或马丁格尔。每个订单都有自己的 Fixed_SL 来保护账户。 - 这款 EA 非常用户友好,可供交易专业人士和新手使用。 - 机器人自动完成所有操作 - 您只需将其安装到 MT4,应用相应的 Set_file 并让 PC 运行(或仅使用 VPS)。 - EA 具有精确的操作时间过滤器,精度为 1 分钟。 - 不包括掉期。 - 无需周末交易。 - 剥头皮技术。 - 实施复利头寸规模管理方法。 - 运行机器人所需的最低账户余额仅为 50 美元。 - 时间范围:仅 M5 。 - 交易对:仅 XAUUSD(黄金)。 - 操作时间:EA 在亚洲时段开始时寻找入场信号。

Synaptica 被设计为提供一致的可靠性,同时通过先进的人工智能驱动的策略保护您的利益。其自主的风险管理系统动态调整以应对变化的条件,确保随时为您的资本提供最佳保护。通过实时适应性监控,Synaptica 预测并响应潜在威胁,在不可预测的波动中保持稳定。其智能反馈循环不断调整其风险模型,随着资本的演变强化您的资金安全。 重要!购买后请联系我以获取说明和奖金!
动态预测建模 : 持续分析复杂的数据流,以预测趋势和结果,具有先进的前瞻性。
认知数据融合 : 将不同的数据源合并为统一的见解,通过多维分析增强决策过程。 量子启发式优化 : 利用下一代优化算法,解锁前所未有的计算速度和精度。 多维模式识别 : 识别并处理跨大量数据集的复杂模式,提供传统模型无法达到的见解。
推荐 图表: XAUUSD
时间框架: H1
输入 仓位大小计算方法 - 选择自动仓位或固定仓位
固定仓位大小 - 固定仓位大小 自动仓位 - 每单位账户货币0.01仓位 最大点差 - 设置允许开盘位置的最大点差 自动GMT检测 - 自动计算您经纪商的GMT偏移量 魔术编号 - 每个订单的魔术编号 评论 - 订单评论

特别优惠!60美元代替90美元 获取MT5版本 点击这里 ! 让你的移动均线策略实现自动化! "MA crossing bot"是依赖移动均线交叉这一强大且经过时间验证策略的交易者的终极助手。这个多功能交易机器人可以在两条移动均线交叉时提醒你或自动开仓,帮助你精准把握关键市场趋势。不论你是经验丰富的交易者还是自动化系统的新手,MA crossing bot都能无缝地实现策略自动化,让你专注于其他任务或交易机会。 但这个EA远不止一个简单的交叉提醒系统。它包含多个高级过滤器,如添加第三条移动均线、使用RSI (Relative Strength Index)过滤低质量交易,甚至结合枢轴点以提升准确性。这确保了你不是交易所有交叉信号,而是只交易最有胜算的设置。 真正让MA crossing bot脱颖而出的是其全面的订单管理系统。你可以完全自定义交易日,选择固定手数或按账户百分比管理风险,甚至可以设置在达到一定利润或亏损时停止交易。这种灵活性使你可以根据自己的风险承受能力和交易目标调整EA,提供高度个性化的交易体验。 EA还包括Break Even、Trailing Stop以及在盈利时

发现未来的交易方式 - Easy Entry Points! 由著名的Felipe FX开发,Easy Entry Points是下一代交易指标,旨在提供直观且高效的交易体验。具有先进功能和用户友好界面,这个指标是所有级别的交易者的完美工具。 主要功能: 简单的入口信号: 通过快速和慢速EMA的交叉来识别理想的入口点,确保交易决策的准确性和及时性。 声音警报: 设置声音警报以实时通知EMA的交叉,让您能够迅速反应市场变化。 完全定制: 调整快速和慢速EMA的设置,以符合您的交易风格和特定策略。 清晰的视觉: 使用不同的颜色(SeaGreen和Red)来轻松识别EMA的交叉,便于快速且有信息的决策。 优化性能: Easy Entry Points经过开发,以确保在任何交易平台上都能快速且高效地运行。 为什么选择Easy Entry Points? 由专家开发: 由Felipe FX开发,这是最受尊敬的交易指标开发者之一。 易于使用: 适合初学者和经验丰富的交易者,配置简单且易于理解。 支持和更新: 跟踪持续开发并定期更新,确保您始终处于市场趋势的前沿。 不要错过改变您交易策略的机会! 立
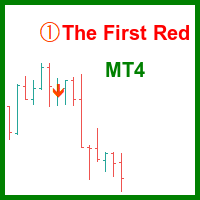
基于达里乌什·达戈(Dariusz Dargo)创建的策略,“The First Red”指标旨在识别并标记图表上符合“The First Red”策略及其扩展条件的蜡烛图,例如“Second Red”、“First Green”和“Second Green”。该策略主要分析局部极值和MACD振荡器的信号。 第一根红色蜡烛(First Red Candle): 当蜡烛形成局部最高点且MACD直方图转向看跌时,将其标记为“First Red”。 图表符号:红色向下箭头位于蜡烛上方。 第二根红色蜡烛(Second Red Candle): 紧随“First Red”之后的第二根看跌蜡烛,确认趋势方向的改变。 图表符号:红色数字“2”位于蜡烛上方。 第一根绿色蜡烛(First Green Candle): 当蜡烛形成局部最低点且MACD直方图转向看涨时,将其标记为“First Green”。 图表符号:绿色向上箭头位于蜡烛下方。 第二根绿色蜡烛(Second Green Candle): 紧随“First Green”之后的第二根看涨蜡烛,确认趋势方向的改变。 图表符号:绿色

Equity Protection EA
一般特徵: 完全控制交易時段的結果。 控制所有外匯交易品種,指數,金屬,股票等的整體結果。對全球股票進行控制。 達到盈虧率時,關閉所有交易品種上的所有交易。- 數量和百分比均可更改的配置。 通過全局跟踪止損來保護結果- 本屆會議取得的成果記錄(更高的權益和更低的權益)。 登錄時,所有計算始終在資產負債表上執行,因此不會影響交易的平倉或平倉。 在Metatrader 4中,您可以用一定比例的賬戶損益來平倉單個交易。 觸發獲利或止損時自動關閉平台的選項。- 通知功能:觸發TP / SL級別時,將報告發送到電話(按通知)或電子郵件的選項。- 觸發TP / SL時可以選擇刪除掛單- 觸發TP / SL時可以選擇截屏並保存在文件中。- 更改字體大小的選項。- 選擇在“獲利百分比”和“止損百分比”中默認設置值 停用自动交易:达到全球止损或止盈水平时,股票保护将停用自动交易,以防止其他EA开立新交易。重要提示:对于Metaquotes市场的规则,“关闭自动交易”功能不可用,如果您需要使用该功能,请通过电子邮件与我联系:tradingxbots@gmail.

这是一个可视化的交易面板,可帮助您轻松进行交易管理,避免人为错误并增强交易活动。它结合了易于使用的视觉界面以及完善的风险和位置管理方法。 [ 安装指南 | 更新指南 | 故障排除 | 常见问题 | 所有产品 ] 易于使用 从图表轻松交易 精确的风险管理交易,无忧 保本是重中之重 让利润不受您的关注 尽快享受无风险交易 所有已开通交易的自动追踪止损 交易开始后立即设置初始止损 进行交易后,EA将执行以下任务: 初始止损/获利被自动放置 它会尽快锁定自由行(可选) 它将止损首次移动到盈亏平衡点(可选) 它使用您所需的方法跟踪止损,直到止损为止 其他很酷的功能是: 出色的终端活动报告 单一但功能强大的尾随止损方法 干净的图表界面 没有输入参数
我进行交易后会怎样? 这是您进行交易后EA的操作: 它放置初始止损并获利订单。 尽快搭便车并确保保本。默认情况下,这是通过在达到盈亏平衡点时关闭50%的交易来完成的,默认情况下为5点。这意味着,如果您日后被淘汰,您将一无所获(可选)。 盈亏平衡后,跟踪止损开始运行。 它跟踪止损,直到止损为止,让利润运行。
尾随止损如何运作? 追踪止损表示为所管

MT4 版本: https://www.mql5.com/en/market/product/133051 MT5 版本: https://www.mql5.com/en/market/product/133052
SNIPER EA – 精准的一次性趋势交易专家顾问
由 ADX、移动平均线和包络线提供支持
SNIPER EA 是一款基于趋势的自动化专家顾问,旨在使用 ADX、移动平均线和包络线指标的组合进行精准的单向输入。采用“一击即中”的方法,此 EA 只为每个信号开仓一个仓位,并配有明确的止盈和止损。
它不使用马丁格尔、网格或平均等风险策略。SNIPER EA 针对 EUR/USD 和其他主要货币对进行了优化,适合初学者和经验丰富的交易者。
主要特点: 一次性策略 每个信号单次输入,内置 SL 和 TP。
ADX 过滤器 确保进入前的趋势强度。
MA + 包络线回撤系统 在持续趋势的回撤时进入。
全自动 24/5 运行,无需人工干预。
无马丁格尔/网格/平均 专注于风险控制和稳定性。
时间过滤器和自动关闭 可以设置为仅在特定时间交易并自动关闭所有头寸。
低

Arrow Micro Scalper 是一款专为剥头皮和短期交易而设计的指标,可集成到任何图表和金融工具(货币、加密货币、股票、金属)中。
在她的工作中,她使用波浪分析和趋势方向过滤器。建议在从 M1 到 H4 的时间范围内使用。
如何使用指标。
该指标包含 2 个用于更改设置的外部参数,其余参数已默认配置。 大箭头表示趋势方向的变化,蓝色箭头表示下降趋势的开始,粉红色箭头表示上升趋势的开始。 “ Only trending direction ”参数启用和禁用使用内部趋势的模式,提供使用您自己的趋势或不使用趋势的机会,并且还启用/禁用仅根据趋势显示趋势箭头和信号箭头。 小信号箭头,该指标最重要的对象,粉色代表“买入”交易,蓝色代表“卖出”交易。 “ Smoothing ”参数决定信号箭头出现的时间,操作范围为 7 到 25,为时间范围 M1-M5 选择大值,为 M15-H1 选择中值,为 H4 - D1 选择小值。 趋势箭头和开始信号箭头有警报。 指标不会重新绘制。
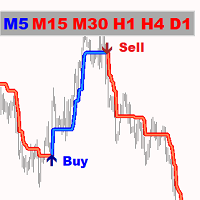
Gold Pointer 是最好的趋势指标。该指标的独特算法分析资产价格走势,考虑技术和数学分析因素,确定最有利可图的入市点,并发出买入或卖出指令信号。
最佳指标信号:
- 卖出 = 红色趋势线 + 红色 TF 指标 + 同方向黄色信号箭头。 - 买入 = 蓝色趋势线 + 蓝色 TF 指标 + 同方向水蓝色信号箭头。
该指标的优点
1. 该指标发出的信号准确度高。 2. 该指标的确认信号不会消失,也不会重新绘制--在确认信号(箭头)后会发出声音警报(警报与信息)。 3. 您可以在任何经纪商的 MetaTrader 4 交易平台上进行交易。 4. 您可以交易任何资产(货币、金属、加密货币、股票、指数等)。 5. 您可以在任何时间框架内进行交易(M5-M15 缩放交易/M30-N1 中期交易/H4-D1 长期交易)。 6. 可在指标设置中更改个别参数(颜色、大小等),以便每位交易者都能轻松调整指标,满足自己的需求。 7. 该指标既可作为交易系统的基本补充,也可作为独立的交易系统使用。 8. 在图表上,无论指标设置在哪个时间框架上,它都会显示六个时间框架(M5 M15 M30

Discount on all my products until 01.05. Gold Veritas 是一款适用于安静时间的全自动外汇专家顾问。 监控顾问的工作: https :// www.mql5.com/en/users/bayburinmarat/seller 正确的 GMT 设置: https :// www.mql5.com/ru/blogs/post/743531 最容易理解和最简单优化所需的所有参数仅在 6 种设置中可用。您可以根据自己的喜好调整顾问:调整风险水平或为特定经纪人自行定制。 EA 代码中已经内置了 4 个货币对的参数:XAUUSD、XAUJPY、XAUAUD、XAUEUR。请注意,并非所有经纪人都提供此类交易对。您可以使用默认设置或根据需要更改设置。
优点:
可以使用挂单 - 这大大减少了滑点 EA不使用平均订单、马丁格尔和其他危险的交易方法 所有交易将在 3-5 小时内关闭 每笔交易均附有止损和止盈,以及交易期限 内置波动率过滤器,针对每个货币对进行优化 EA 不使用新闻过滤器 所有交易均符合先进先出规则 建议: 100 美元交

使用我们的市场强度和情绪指标优化您的交易决策,不再逆势交易!
我们的指标专为重视准确及时信息的严肃交易者精心设计,以非常简单的方式提供 28 种主要货币对的鸟瞰图。该工具可根据货币对的受欢迎程度、看涨或看跌趋势的强度以及买方和卖方的百分比 (MT5 版本) 对货币对进行排名。
功能特点 实时趋势强度: 准确评估每种货币对的趋势强度,为识别交易机会提供可靠指导。 买卖双方分析: 通过我们对每种货币对的买卖双方实力排名,即时洞察市场动态,让您预测重要走势。 交易者兴趣: 获取每种货币对的交易者兴趣和活动数据,帮助您更好地了解新兴趋势和潜在转折点。 直观且可定制的仪表盘: 我们的仪表板易于使用,您可以根据自己的喜好自定义显示,让您对相关信息一目了然。 实时更新: 实时更新让您随时了解市场变化,确保您不会错过任何有利可图的机会。
指标栏 Symbol: 点击此栏,符号将按字母顺序排序。 Popularity: 点击此栏,将按照交易者对该交易货币对的兴趣顺序进行排序。 Strength: 点击此栏,货币对将按照趋势排序(正数表示上升趋势,负数表示下降趋势)。 Buyer/Se

Trade Copier Pro 是一个强大的工具,多账户之间进行远程复制的贸易超过互联网不同的位置。这是一个信号提供商的理想解决方案,谁想要与全球范围内对自己规则的人分享他的贸易。一个供应商的交易可以复制到多接收器和一个接收器可以得到贸易额从多供应商也是如此。 供应商和接收器可与供电内置的数据库管理系统来管理他的合作伙伴名单。 这个工具允许全局配置模式(copy过来互联网)和本地模式(在同一台PC/服务器内复制)之间进行选择。
要求: MetaTrader4的4.00版构建670或以上。
参考: 如果你只需要在本地复制与更低的价格,你可以检查Auto Trade Copier在: https://www.mql5.com/en/market/product/4676
以下是亮点功能:
在一个工具提供商或接收器之间转换角色。 一个供应商的交易可以复制到多接收器和一个接收器可以从多个供应商收到交易。 供应/接收器可通过供电数据库管理系统,而无需额外的工具管理自己的接收器/供应商名单(添加,删除,编辑,启用/禁用)。 全球模式(copy过来互联网)和本

该指标通过忽略突然的波动和市场噪音,以无与伦比的可靠性跟踪市场趋势。它被设计用于趋势交易日内图表和较小的时间范围。其获胜率约为85%。 [ 安装指南 | 更新指南 | 故障排除 | 常见问题 | 所有产品 ] 极易交易 查找超卖/超买情况 随时享受无噪音交易 避免在盘中图表中被鞭打 该指标分析其自身的质量和性能 它实现了一个多时间仪表板 该指标适用于低时限交易,因为它通过降低平均价格周围的市场噪音而忽略了突然的价格飙升或修正。 该指标根本不需要优化 它实现了一个多时间仪表板 它实现了电子邮件/声音/推送警报 指示器为不可重涂和不可重涂 该指标实现了适合于较小时间范围的趋势跟踪方向,该趋势可以渗透到较高时间范围内的非常长的趋势中,从而扩大了您的收益。
指标剖析 指标显示一条彩色的线,周围环绕着一个价格带。彩色线是有价证券的平均价格,而价格带表示超买/超卖水平。如果平均价格为蓝色,则您应该在市场没有超买的情况下寻找多头交易;如果平均价格为红色,则应该在市场没有超卖的情况下寻找空头交易。 指标的趋势变化并不表示立即进行交易或完成相反交易的信号!这些频段用于计时。
技术信息
指标的评估

Description: First of all Its worth emphasizing here that the Trend Breakout Catcher is Non-Repainting, Non-Redrawing and Non-Lagging Indicator, Which makes it ideal from both manual and robot trading. The Trend Breakout Catcher Indicator employs a sophisticated algorithm designed to predict trends early and generate timely Buy and Sell signals at the onset of a breakout. Utilizing a smart calculation based on numerous elements, the indicator forms a robust and redundant system to detec

Dark Sprint is an Indicator for intraday trading. This Indicator is based on Trend Following strategy, also adopting the use of the atr to determine the right volatility. We can enter in good price with this Indicator, in order to follow the strong impulse on the current instrument.
Key benefits
Easily visible sprint lines Intuitive directional arrows Automated adjustment for each timeframe and instrument Easy to use even for beginners Never repaints, never backpaints, Not Lag 100% compatibl

财富是一种复杂的算法,可以分析并严格跟踪外汇对的趋势。
顾问能够同时读取所有时间范围内的价格行为信息。
这使得机器人能够对当前的价格变动做出精明的决定并采取相应的行动,从而通过频繁的倒卖订单产生强烈的趋势跟踪。
信号: --- 群聊: https://www.mql5.com/en/users/conorstephenson 请在购买后与我联系以获取设置建议和免费的专家顾问! 主要特征
易于使用 - 即插即用。 频繁倒卖后的强劲趋势。 管理和关闭交易的多种方式。 可选鞅模式。 可选对冲功能。 广泛的传播和防滑保护。 净值限制 - EA 能够以所需的投入净值/保证金回撤百分比削减交易,并具有暂停交易的功能。 符合先进先出规则。 可选的新闻过滤器。 可选的日期/时间限制。 可选的动态 pipstep 方法。 可选的减少回撤功能。 建议
货币对 - 欧元、英镑、澳元、新西兰元和美元货币对效果最佳,但请联系我以获取最新建议。
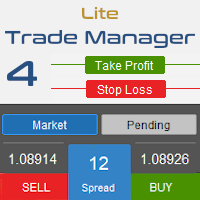
Trade Manager 4 Lite is trading panel developed with a goal to make manual trading in some (routine) task easier.
Trade Manager 4 Lite also works in Strategy Tester. Version for Meta Trader 5 is here: Trade Manager 5 Lite
Main features of Trade Manager 4 Lite Trading for Forex and CFDs Support for 4 and 5 digit brokers 65 combinations to set order Set Take Profit, Stop Loss and entry level for Pending Order with lines positioned on the chart Break Even Trailing Stop Loss Multiple Orders at one

Dark Breakout is an Indicator for intraday trading. This Indicator is based on Trend Following strategy, providing an entry signal on the breakout. The signal is provided by the arrow, which confirms the breaking of the level. We can enter in good price with this Indicator, in order to follow the main trend on the current instrument. It is advised to use low spread ECN brokers. This Indicator does Not repaint and N ot lag . Recommended timeframes are M5, M15 and H1. Recommended working pairs

顾问交易指标信号 AW Breakout Catcher,致力于突破动态支撑位和阻力位的策略。订单有固定的止损和止盈。可以选择使用平均。它能够处理选定的时间段和三种类型的通知。 优点: 适用于所有类型的交易工具和任何时间范围 具有准时工作、限制滑点和最大点差的功能 易于设置和直观的面板界面 适合追踪手动开仓 各种自定义选项止损和获利 可以选择使用平均 说明和说明 -> 这里 / MT5 版本 -> 这里 输入设置: 主要设置 成功率 - 开立订单的成功率。如果指标小于您指定的,那么顾问将不会开立订单 订单手数 - 开仓订单量 启用自动手数计算 - 使用自动手数计算。此功能允许您在更改存款时保存风险设置 Autolot每0.01手存款 - 使用autolot时每0.01手的存款金额 止损止盈设置 止盈模式 - 选择止盈策略: TP1平仓 TP2平仓 在点中使用 TP 点数止盈(如果使用) - 每个单独订单的固定止损 止损模式 - 止损策略的选择: 在相反的信号退出 使用固定止损 使用指标中的 SL 没有止损 止损点数(如果使用) - 每个订单的固定止损 网格设置 使用网格 -

具有主动策略和先进平均系统的全自动趋势 EA。订单根据使用振荡器的趋势过滤器打开,以提高信号安全性。有一个简单而清晰的设置。 EA 适用于任何工具和时间框架 优点: 能够添加手动订单的自动化系统 可调重叠恢复算法 能够在一个或两个方向进行交易 在相反方向移动时使用平均 可插拔自动体积计算 调整趋势指标的时间范围 内置发送所有类型通知的能力 MT4 版本 -> 这里 / 问题解决 -> 这里 输入变量: MAIN SETTING Size of the first order - Volume of orders to open Enable Autolot calculation - Use automatic lot calculation. Autolot allows you to save risk settings when changing the deposit Autolot deposit per 0.01 lots - The amount of the deposit, which will account for one "Size of the or

This EA is fully automated , it is built based on the method of catching the pop-up Alert event and forwarding them to Telegram Channel/Group.
Parameters of the EA: -------- <EA Settings> -------- Magic Number: The identifying (magic) number of the currently selected order. Bot name: Name of the Expert Advisor. Allow forward Alert: Enable/ Disable Forward Alert. Do not send messages after the current time (seconds) .
Number of rows to read from list (>= 4...| affect processing speed).
--

This EA is fully automated , it is built based on the method of catching the pop-up Alert event and Open Market Orders (BUY/SELL) . Download trial version here: https://www.mql5.com/en/blogs/post/751340
***NOTE: It is recommended to remove the available filter settings, only install the filter for your indicator. Parameters of the EA: -------- <EA Settings> -------- Magic Number: The identifying (magic) number of the currently selected order. Allow Open trade: Enable/ Disable Open Trade

The "Nostradamix" indicator is designed to analyze short-term market movements on lower timeframes (e.g., M1), while simultaneously considering trend direction on higher timeframes (e.g., M30). This tool identifies key trend reversal points, displays volatility levels, and generates buy/sell signals based on market dynamics. The indicator automatically plots: Current trend lines. Volatility bands to assess movement strength. Visual markers (arrows) for entry signals. Forecast Accuracy and Mathem

该指标旨在与艾略特波浪理论相结合,提供了两种不同的工作方式: 自动工作: 在此模式下,指标会自动检测图表上的所有五个动机波浪,并为您提供预测和潜在的逆转区域。它还可以提供警报和推送消息。这种自动功能简化了识别和分析艾略特波浪模式的过程。 手动工作: 此选项适用于喜欢手动方法的交易员,用于手动绘制九个不同等级的波浪。每个等级都可以在它们出现后通过调整图表上的绘制线条来单独定义。此功能简化了手动绘制波浪的过程,使其更加高效。需要注意的是,所有绘图数据将保存在平台的数据文件夹中,以备将来参考。 参数: Name: 指标名称。 Use_System_Visuals: 启用或禁用指标主题,以匹配交易平台的整体外观。 Explain_Comment: 允许启用或禁用波浪编号的解释性注释,有助于理解已识别的波浪。 Show_Last_Candle_Counter: 启用或禁用蜡烛计时器,提供有关当前蜡烛收盘的剩余时间的信息。 Candle_Counter_Color: 蜡烛计时器文本的颜色。 Basic_Wave_Color: 用于表示波浪的主要颜色。 Bullish_Wave_Color: 当检测

NEW PROMO: Only a few copies copies available at 349$ Next price: 449$ Make sure to check out our " Ultimate EA combo package " in our promo blog ! Gecko runs a simple, yet very effective, proven strategy. It looks for important recent high and lows and will trade the breakouts. The actual execution of this strategy however, is what makes this EA truly shine. Entry calculations and exit algorithms are not only unique but also very advanced.
LIVE RESULTS: https://www.mql5.com/en/signals/75

What is the Volume Weighted Average Price (VWAP)? The volume weighted average price (VWAP) is a trading benchmark used by traders that gives the average price an instrument has traded at throughout the day, based on both volume and price. It is important because it provides traders with insight into both the trend and value of the instrument.
What is the Difference between VWAP and AVWAP? While VWAP is having as starting point the beggining of the day,week,month etc. in the AVWAP you can plac

波动率分析仪是一种动量指标,它利用价格在狭窄交易区间盘整后强劲突破的趋势。该指标还使用动量振荡器来显示挤压触发时的预期移动方向。该直方图在零线附近震荡,零线上方的动量增加表明有机会买入多头,而动量低于零线则表明有做空机会。
限时优惠:该指标仅适用于 50 美元和终身。 (原价 125 美元) 主要特征 横向趋势检测器。 低挥发性检测器。 看涨高位和看跌高波动率检测器。 使用所有时间框架和所有货币对。 提供弹出警报和推送通知警报。
接触 如果您有任何问题或需要帮助,请通过私信与我联系。
警告 我们所有的指标和工具都只能通过官方 Metatrader 商店 (MQL5 市场) 获得。
溢价指标 通过访问我们的 MQL5 配置文件,您可以找到我们所有的免费和高级指标。要访问我们的个人资料, 请单击此处。
作者 SAYADI ACHREF,金融科技软件工程师,Finansya Lab 创始人。

*** 64% DISCOUNT, LAST CHANCE TO BUY THE EA AT $250, ONLY 3 COPIES LEFT AT THIS PRICE ***
Gold High is a complete automated trading robot that has been designed and created based on our best strategies in forex trading. All trades are protected by stop loss. Users can use a fixed lot or auto lot money management. Our team will regularly check the data and will publish updates If needed. Why this EA : T he EA has successfully passed live testing for over 116 weeks Smart entries calculated by

How to use Pair Trading Station Pair Trading Station is recommended for H1 time frame and you can use it for any currency pairs. To generate buy and sell signal, follow few steps below to apply Pair Trading Station to your MetaTrader terminal. When you load Pair Trading Station on your chart, Pair Trading station will assess available historical data in your MetaTrader platforms for each currency pair. On your chart, the amount of historical data available will be displayed for each currency pai


** All Symbols x All Timeframes scan just by pressing scanner button ** *** Contact me to send you instruction and add you in "RSI scanner group" for sharing or seeing experiences with other users.
Introduction RSI divergence is a main technique used to determine trend reversing when it’s time to sell or buy because prices are likely to drop or pick in the charts. The RSI Divergence indicator can help you locate the top and bottom of the market. This indicator finds Regular divergence for pul

Konoka系统是以日本时间上午00:00至下午13:00为目标时段的日内交易系统。
货币对是USDJPY,以M5的收盘价进行交易
没有使用网格或马廷格尔逻辑
TP和SL都是在100Pips处略大(为了避免猎取止损)
还有其他的结算方式,采用时间和技术指标的结算方式
正向试验: https://www.mql5.com/ja/signals/573517
<参数说明>
・MagicNumber = 1007; MagicNumber(运行多个EA时需要)
・MaxSpread = 20; 最大点差(日本时间凌晨点差扩大)
・ Slippage = 30; 滑移率
・MaxOrders = 3; 最大位置数
・ Space = 40; 如果最大订单数大于或等于1,则下一个条目的宽度
・Target = True; 技术指标的退出方法(False=在设定的时间退出) ・ Friday = True; 周五有交易(跨周末=真) ・Exit_Bar = True; Exit at Ber (Exit at Tick = False) ・Money_M =

The Ultimate Dashboard Indicators are useful for traders, but when you put them into a dashboard that can scan 28 symbols at once they become even better, and when you can also combine different indicators and timeframes to give you synchronized alerts, then they become awesome. This easy to use dashboard provides you with 23 leading indicators, use them individually or together, to create powerful combination alerts. So when you want to know that RSI is above 25 and the price is above the movin

1-2-3 模式是市场中最基本、最重要的形态。几乎每一次重大的市场走势都是从这种形态开始的。1-2-3 模式用于发现趋势反转,并可以检测下一个大趋势。该模式还表明趋势即将结束,新趋势正在形成。该模式由三个价格点组成:底部、峰值或谷值,以及 38.2% 至 71.8% 之间的斐波那契回撤。当价格突破最后一个峰值或谷值时,该模式被视为有效,此时指标绘制箭头,EA 将进行交易。 推荐货币对:所有主要货币对,如 eurusd;audusd;gbpusd;nzdusd,以及 m15 时间范围内的次要货币对,如 audcad;nzdcad;eurnzd 和 eurcad。 开始小时 – EA 的开始小时 开始分钟 – EA 的开始分钟 结束小时 – EA 的结束小时 结束分钟 – EA 的结束分钟 手数 – 开始交易的初始手数 使用可变手数 – 真/假 – 使用资金管理真/假 每 0.01 手的可用保证金 – 每 0.01 手的可用保证金 乘数 – 乘数因子,如 1.5 最大手数 – 允许的最大手数 获利 – 以点数获利 止损点数(0:不使用) – 以点数止损,如果为 0,则禁用它 百分比网格止

该指标背后的想法是在所有时间范围内找到穆雷水平并将它们组合成组合水平,其中包括基于强穆雷水平 (+2, +1, 8, 4, 0, -1, -2). 时间范围越短,您立即看到组合级别的机会就越大。 它将以颜色突出显示。 当您将光标悬停在任何数字上时,将显示该级别所属的时间范围的提示。 但您将始终将当前时间范围视为最左边的时间范围。 智能警报可帮助您传达与信号组合级别相关的价格。
视频中的仪表板不是声明的功能,也不包含在此处! 仍在开发中。
交易建议。 不建议在没有额外技术分析的情况下交易组合水平的反弹。 从蓝色和红色水平反弹的概率较高。 价格被磁力吸引至组合水平,但价格尚未对其进行测试(128 根蜡烛前)。在这种情况下,建议使用趋势策略,并采取水平取向(高/低一个水平)。 当价格向红色或蓝色水平移动时,不要在沿途反弹时交易黄色(这会破坏势头)。 强烈建议初学者在组合水平反弹时进行交易,除非有相反的组合水平。 最好在趋势方向反弹时进行交易。
在博客链接阅读更多内容 - Murrey Math Trading with UPD1 .
设置说明。
主要设置。 Period
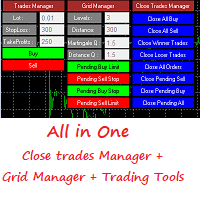
Grid Panel Allows you to : Set the number of levels (trades). Lot size and you can do Martingale to raise the lot size for each level. Set distance between levels, and you can manage the distance for each level using Distance Q. Static TP and SL for each level. You can open : BUY STOP / BUY LIMIT / SELL STOP / SELL LIMIT (levels in one click). Close all buy orders. Close all sell orders. Close all winning orders. Close all losing orders. Close all orders. Close all Pending BUY orders. Clos
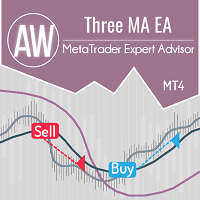
在两条移动平均线的交叉点交易的 Expert Advisor 使用第三条移动平均线来过滤当前趋势方向。它具有灵活但同时简单的输入设置。 问题解决 -> 这里 /MT5版本 -> 这里 /使用说明 -> 这里 好处: 直观简单的设置 适用于任何类型的工具和任何时间范围 具有三种类型的通知 将第一个订单与最后一个订单重叠的可插拔系统 能够自动计算交易量 专家顾问策略。 EA 使用三个移动平均线来开仓。主要的是两个移动的,快的和慢的。第三个是过滤掉市场噪音的幻灯片。 如果快速移动的信号从下向上穿过慢速移动的信号,那么这是一个买入信号。 如果快速移动的信号从上到下穿过慢速移动的信号,那么这是一个卖出信号。 使用第三次滑动时: 当快速和慢速移动平均线低于过滤移动平均线(下降趋势)时,只有卖出信号有效。 当过滤移动平均线低于(上升趋势)快速和慢速移动平均线时,只有买入信号起作用。 最快的周期最小,最慢的周期更长,滤波器滑动周期最大。 如果禁用过滤,则: 在快速和慢速移动平均线的每个交叉点,EA 将打开交易 Input variables: Main settings Si

With the new update Do this Auto_Lots=false An idea of testing hedge EA in the strategy tester will be given in this article. As you know, the strategy tester has its own limit unabling to open any order for another symbol. Every user that would like to test his/her own hedge Expert Advisors needs to test it/them live only. But does this limit our capabilities? I am sure that every hedge trader needs to test his own EA before trading live. So, I am giving the idea of generating a virtual strateg

KT QQE Robot 采用了一种高效的交易策略,将 QQE 交叉和 TEMA 交叉技术结合在一起,并在明显的高点和低点设置挂单。 为了提高盈利能力,它还引入了动态的移动止损机制。这个功能使得机器人在交易过程中能够根据市场走势动态调整止损位,跟随趋势锁定利润。 这种方式旨在在保障资金安全的同时,尽可能地扩大盈利空间。 买入条件: QQE 与 TEMA 上穿交叉。 卖出条件: QQE 与 TEMA 下穿交叉。 平仓方式: 使用追踪止损以捕捉大趋势行情。
功能特点 追踪止损: 内置动态止损功能,在行情发展中自动调整止损,帮助锁定利润并捕捉较大趋势。 不依赖经纪商: 无论账户类型或经纪商条件如何,EA 都可稳定运行。 风险管理: 每笔交易都有止损和止盈保护,避免出现严重亏损。 安全策略: 不使用网格、马丁等高风险策略,确保交易账户安全。 用户友好界面: 输入参数简单明了,即使是初学者也可轻松操作。 无需额外依赖: 所有必需组件都已嵌入 EA,无需额外下载。
KT QQE Robot 的高级交易策略 本 EA 结合两个强大指标(QQE 和 TEMA)的交叉信号来执行交易,寻找最佳的买

GridMasterFx is an innovative tool for automated forex trading, which is based on a combination of a grid strategy and a unique trend calculation algorithm using the Moving Average indicator. This strategy allows the Expert Advisor to open and close positions on time, use the analysis of the current trend and instantly respond to market changes.
GridMasterFx Expert Advisor is an excellent choice for successful automation of your forex trading process. It easily adapts to various market conditi
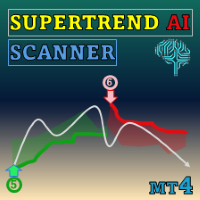
Special offer : ALL TOOLS , just $35 each! New tools will be $30 for the first week or the first 3 purchases ! Trading Tools Channel on MQL5 : Join my MQL5 channel to update the latest news from me 通过 SuperTrend AI Clustering with Scanner ,体验人工智能的强大力量。这款革命性的交易工具适用于 MetaTrader4 (MT4),结合了 K-means 聚类和广受欢迎的 SuperTrend 指标,帮助交易者在趋势和信号中掌握主动。 See more MT5 version at: SuperTrend AI Clustering MT5 with Scanner See more products at: https://www.mql5.com/en/users/ndhsfy/seller
为何此工具独树一帜 虽

Only 3 copies left for $75 Next price $125 EA Maestro is a fully automated expert advisor designed for active trading in two directions. The EA contains an advanced entry filter based on the analysis of the price chart model and technical indicators, includes a two-step trailing stop, an analyzer of round price levels and an time trading filter. The EA allows you to work with both a fixed trading lot and an automatic lot calculated by the built-in money management module. The EA is ready to use

The Expert Advisor is based on Martingale principle combined with a grid system. It uses different entry logics like Bollinger Bands, RSI, Heiken Ashi (and much more). After the inital order has been placed, the grid/martingale systems comes into play. The lot increase and grid distance can be calculated on different fundamentals. The take profit and a grid distance can be calculated dynamically (with ATR). The bot handles sells and buys independently. For low risk settings, a stop loss can be

Place price Alerts on extended Rectangles and Trendlines - Risk reward indicator mt4 Extend Rectangles & Trendlines to the right edge Mark your supply demand zones with extended rectangle and draw support resistance lines with extended trendline. Find detailed manuals here . Find contacts on my profile . MT4 Rectangle extender indicator will simplify and make it easier for you to analyze markets and stay notified about important events. When you extend rectangle or trendline the action bu

Expert adviser uses a breakout strategy when opening all orders without exception. Trading is conducted exclusively by pending orders. Entry points are located at local minimums and maximums, some levels are excluded with the internal filter of the EA. The maximum number of orders is set in the settings. The EA automatically determines the number of digits in quotes, so the user does not need to think about it and make the appropriate changes to the settings. You can use any type of account, suc

Rebate System performs a large number of trades with the minimum profit, which gives the opportunity to earn from receiving rebates (returning part of a spread). It is based on two grids (buy and sell), when one of them is in a drawdown, the other one can enter with an increased lot size, keeping the account away from the drawdown. Differences from the usual EA Rebate System in the mode of closing long-term losing trades in one of the grids due to the previously received profit. Input parameters
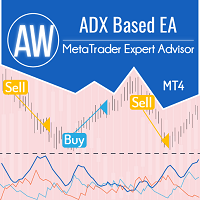
智能交易系统根据 ADX 指标的信号进行交易。当趋势活跃时,使用由指标主线确定的 PlusDi 和 MinusDi 相对值确定趋势的经典策略。交易是按照当前趋势的方向进行的。 Problem solving -> Here / MT5 version -> Here / Instruction -> HERE 优点: 可配置的指示器信号 适用于任何类型的工具和任何时间范围 必要时使用平均 将第一个订单与最后一个订单重叠的可插拔系统 虚拟止盈 具有三种类型的通知 能够自动计算交易量 战略: 智能交易系统根据指标信号 ADX 工作。 要开仓,使用三个指标线:主线、减号和加号。 主线显示趋势的强度,即价格移动的活动。 另外两条线表示当前的趋势是什么。 如果加线高于减线,则表示当前处于上升趋势。 如果负线较高,则表明下降趋势。 当两条线之间没有明显差异时,市场目前处于持平状态,即没有明显的趋势。 信号: 当主线的数值高于最小值,并且向上生长时,这意味着市场当前的趋势正在加强。 买入信号 - 当主线高于最小值,同时它在增长,并且正线高于负线。 卖出信号是当主线大于最小值

Chart Patterns Detect 15 patterns (Ascending Triangle, Descending Triangle, Rising Wedge, Falling Wedge, Bullish Flag, Bearish Flag, Bullish Rectangle, Bearish Rectangle Symmetrical triangle, Head and Shoulders, Inverted Head and Shoulders, Triple top, Triple Bottom, Double Top, Double Bottom) Use historical data to calculate the probability of each pattern to succeed (possibility to filter notification according to the chance of success) gives graphic indication about the invalidation level and

The Percent Pivot indicator is a simple indicator that calculates the main percentage values. The graphical layout makes it very similar to the traditional pivot but its internal computing system is unique and irreplaceable. Every day, the market creates new bullish or bearish rates. This indicator help you to identify possible supports or resistance levels. The main values such as 0.25% and 0.50% are good reference points to use as potential target or reversal levels. This indicator has been de

The next price of the adviser will be 159 $ EA Pivot SR is a fully automatic Expert Advisor for MT4. There are no sewn-in deals, as is the case with most fraudulent advisors. Transactions in the tester and in real trading will correspond exactly to 99.99%.
The strategy of the Expert Advisor is based on trading from levels, which is the most acceptable solution than focusing on indicators that are usually late and give signals several bars late.
Support and resistance levels are calculated us

功能強大的1分鐘剝頭皮系統 - Xauusd貨幣對貿易的自動機器人脫皮器(機器人以其他貨幣對交易,但在黃金中獲得了最佳效果)。 推薦時間段 M5 。 最低初始餘額為500美元。 該機器人會自動確定價格的點數,並在趨勢的未來方向上設置幾個延期訂單。 如果價格沒有朝著正確的方向展開,機器人將刪除延遲的訂單。 但是,如果價格朝著正確的方向展開,機器人開始伴隨(修改)打開訂單以獲得最大結果。
機器人可以以兩種模式工作: 當機器人設置中的“批次”參數為= 0時,機器人會自動計算每個事務的大小。 計算批次的大小以獲得最大結果,風險最小。 在這種模式下,批次的大小將與平衡的增長成比例增加。 當“批次”參數無關緊要時,機器人將打開固定地段尺寸= 0.01的訂單。 在此模式下,批次的大小將始終固定。
機器人的優勢: Martingale不使用。 不使用經典網格 不使用對沖 可以用固定的批量交易 可以自動計算最佳地塊大小 與幾乎所有著名經紀人交易
機器人設置: Lots 是批量的大小。 如果此參數為零,則機器人將自動計算批次的大小。 在這種模式下,批次的大小將與平衡的大小成比例增加。 機器人計算

通过简单的拖放EA将Metatrader 4与Python连接的文档。 完整的端到端解决方案,经过全面测试,快速,高效!
Pytrader生态系统由python脚本和MT5或MT4 EA组成。 对于许可,还使用指示器。 python脚本和EA之间的通信基于套接字。 EA是服务器,而python脚本是客户端。 它始终是查询(函数/ python脚本)和输出(数据/服务器)。 EA不需要与运行python脚本的计算机相同。 在我们的Github链接上,您会找到python脚本,EA,完整的文档以及一个显示如何调用函数的Pytrader示例脚本。 如有疑问,我们还有一个不和谐频道。 在演示中(没有许可指示符)还具有全部功能,但适用于数量有限的乐器 (EURUSD,AUDCHF,NZDCHF,GBPNZD和USDCAD)。
下载EA =>这里
演示支持:EURUSD,AUDCHF,NZDCHF,GBPNZD和USDCAD
Python MT5 EA插座连接器 比以往更轻松!通过简单的拖放式EA将Metatrader4与Python策略连接起来从未如此简单! 完整,快速的解决方案,经过

斐波那契折返和扩展画线工具 适用于MT4平台的斐波那契折返和扩展画线工具,适合于使用黄金分割交易的交易者 优点:没有多余的线,没有过长的线,易于观察发现交易的机会
试用版: https://www.mql5.com/zh/market/product/35884 主要功能:
1.可以直接画出多组斐波那契折返,可以看出重要折返点之间的关系;
2.可以画出斐波那契扩展,比率有三种0.618,1,1.618
3.画出的斐波那契折返和扩展均可左右移动,有数值显示,方便观察
4.可通过数字键切换周期
使用指南和功能键:
1.按 [ 或R画折返,按需要画折返,最多云持8组折返;
2.按 ] 或E画扩展;
3.按 \ 删除当前周期下的所有扩展和折返,其余周期的不受影响
4.如何左右移动折返和扩展
(1)点击第一组折返的F5字符,可以左右移动折返; (2)点击COP的字符 ,可以左右移动扩展; 5. (1)点击第一组折返的F5字符,按del 可以删除这组折返; (2)点击COP的字符, 按del 可以删除这组扩展;
6.修改折返和扩展(随着市场的运行,焦点或者反弹点需要修改)
Ultimate Volatility Insight is a highly professional tool for analyzing and fully understanding market activity based on an advanced ATR with improved algorithms and calculation formulas. The indicator helps traders accurately assess market dynamics, identify key support and resistance levels, and effectively manage risks. Ultimate Volatility Insight works only with real data using live statistics. The indicator has been developed for over two years, and its effectiveness has been proven through
如果产品有任何问题或者您需要在此产品上添加功能,请联系我 Contact/message me if you encounter any issue using the product or need extra feature to add on the base version.
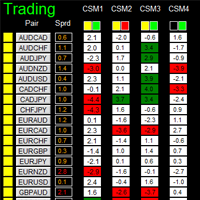
There is a Demo version of this panel Dashboard Currency Strength Meter AdvancedDemo in my product list, please try it out to get familiar with all functionalities free, LINK . The Dashboard Currency Strength Meter Advanced gives you a quick visual guide to which currencies are strong, and which ones are weak over the customized 4 time-frames and period.

70% OFF for 2 DAYS
Telegram Group: Find the link in my profile 4 days to pass MyForexFunds phase 1 evaluation.( see screenshot below )
HERE is a FREE file for use in a LIVE DEMO account.
Welcome. Virtual Trendline Scalper is a scalping machine (trades quite often) that uses virtual trades in virtual trendlines before it opens a real one in decent to perfect places.
IMPORTANT:Due to huge amount of variables that are used in the code of the EA and the many drawings in the chart,the E

50% off. Original price: $60 Support and Resistance zones indicator for MT4 is a multi-timeframe panel and alert that finds support and resistance zones and pivot points for all timeframes of MetaTrader 4 and gives alert when price has interaction with them. Download demo version (works on GBPUSD, EURJPY and NZDUSD symbols) Read the full description of scanner parameters in the blog page . Many unique features in one indicator:
Integrating support and resistance zones and pivot points in one i

Turtle Scalper Pro is a trading robot for the trading on forex. This is a mix of Trend Following and Counter Trend system. Backtest Now! This Expert advisor not use arbitrage, grid, martingale or other dangerous strategy , All Trades are covered by StopLoss and TakeProfit .
Important Information Revealed By purchasing this Expert Advisor you are entitled to receive a free copy of Spider Crazy Pro ! (All future updates included) -> To Receive it, Please Contact me by mql5 message
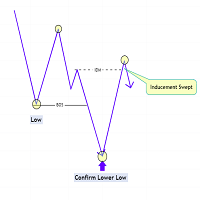
The Market Structure with Inducements & Sweeps indicator is a unique take on Smart Money Concepts related market structure labels that aims to give traders a more precise interpretation considering various factors.
Compared to traditional market structure scripts that include Change of Character (CHoCH) & Break of Structures (BOS) -- this script also includes the detection of Inducements (IDM) & Sweeps which are major components of determining other structures labeled on the chart.
SMC & pri

确定范围和下一步可能的走势 | 获得早期信号和趋势强度 | 在反转之前获得明确的退出 | 了解价格将测试哪些斐波水平 非重绘、非延迟指标 - 手动和自动交易的理想选择 - 适用于所有资产和所有时间单位 剩余 5 份,售价 $69 - 然后 $99 购买后,请联系我以获取您的 免费 TrendDECODER_Scanner MT5 版本: 点击此处 使用 BladeSCALPER 和 PowerZONES 获取我们的完整方法
它是什么?
TrendDECODER 集多种创新于一身,使趋势监测变得简单易行。
投射趋势线(Projective TrendLine)--快速参考即将到来的趋势 实时趋势线(RealTime TrendLine)与投射趋势线(Projective TrendLine)的对比 - 与之前的同方向走势相比,市场是加速还是放缓? 实时趋势线交叉 - 趋势正在偏离轨道 使用 GreyBox - 市场不再是趋势并进入新的过渡序列 使用 DecoderSignals 和 Blue/Orange Clouds - 利用作为动态支

DooZER is an elegant and clean Expert Advisor which follows an averaging strategy with initial entry based on price action. DooZER works with baskets which can be composed by both Buy or Sell trades depending on the market. Trades are not treated separately by DooZER but as a whole basket instead. When the basket reaches the desired profit, the entire basket is closed, and a new one is opened.
On the strategy DooZER can yield interesting results, but the strategy requires deep pockets. It can

Fully automatic professional MT4 trading system! The adviser includes 3 strategies that work simultaneously, trading is based on 4 author's indicators. The EA has been optimized and tested since 2012 on real ticks and with 99.9% probability. Long-term trading, which takes into account the spread and commissions paid. Almost all transactions are displayed in profit. The EA does not open a large number of trades, the first trade will open in about a week after installation. The Expert Advisor is

CS ATR FIBO CHANNELS MULTI TIMEFRAME
Additional tool to trade with Cycle Sniper Indicator.
Cycle Sniper : https://www.mql5.com/en/market/product/51950 Indicator Draws Channels based on: - Cycle Sniper Price and Moving Averages - ATR Deviations - Fibonacci Retracement and Extensions
Features: - Multi TimeFrame - Full alert and Notification options. - Simple Settings - Finds the trend change or extreme reversals.
Inputs: - Arrow Mode: ATR Levels or Median Line If Median Line is selected ind

介紹自動追蹤助理 - 您的終極外匯自動追蹤管理解決方案 自動追蹤助手是一款非常先進的程序,旨在徹底改變您透過追蹤停損管理交易的方式。憑藉其全面的功能,這個強大的工具使您能夠輕鬆、精確地優化交易結果。 ATA 在下面的說明中代表 自動追蹤助理 。 (*)常規設定概述: 價格單位選擇 :使用者可以選擇 PIP 或 POINTs 尾隨選項來處理部位(無論您喜歡哪一種)。因此,如果您為 EURUSD(x ...) 頭寸輸入 200 點,則該實用程式在該頭寸上執行的追蹤距離通常會轉換為 20 點。 尾隨模式 :有六種尾隨模式。預設模式設定為百分比鎖定尾隨模式,模式一。這種模式最適合簡單的利潤保留。在某些情況下,市場方向會發生逆轉,並且有利可圖的貿易變得無利可圖。此模式確保當前市場價格與鎖定利潤價格水準之間保持合理的價差,以便在趨勢有利的情況下可以累積更多的利潤,在趨勢有利的情況下交易也不會造成損失。其次,如果趨勢顯著逆轉,交易者可以開始另一個頭寸,並滿足於最後一個頭寸以盈利告終的事實。 基於點的動態模式與眾所周知的典型 Meta Trader 追蹤功能相同。無需右鍵單擊每筆正在進行的交易來

TreeBert EA H4 – Smart Swing Trading Automation for EURUSD and More Unlock the power of multi-timeframe trading with institutional logic – fully automated.
The MTF Momentum EA H4 is a high-precision, low-frequency trading robot designed for smart swing traders who want to combine trend-following principles with momentum confirmation – using professional multi-timeframe analysis. How It Works This Expert Advisor operates on the H4 timeframe and uses a three-level decision system : Trend De
MetaTrader 市场 - 在您的交易程序端可以直接使用为交易者提供的自动交易和技术指标。
MQL5.community 支付系统 提供给MQL5.com 网站所有已注册用户用于MetaTrade服务方面的事务。您可以使用WebMoney,PayPal 或银行卡进行存取款。
您错过了交易机会:
- 免费交易应用程序
- 8,000+信号可供复制
- 探索金融市场的经济新闻
注册
登录
