适用于MetaTrader 4的付费EA交易和指标 - 29

Identify Engulfing candle pattern with Arrows & Alert ( built-in RSI filter). This indicator helps you to identify Engulfing candle pattern or Outside bar (OB) on the chart with arrows, along with an alert when a new Engulfing candle appears. Engulfing candle pattern is one of the most important reversal Price Action signals. You can choose between standard Engulfing (Engulfing based on candle body) or non standard Engulfing (Engulfing based on candle high - low )
Alerts can be turned on a

This is very simple strategy based on martingale and reverse martingale strategy. When Ea keeps on winning it multiplies with winning multiplier ,when it has a loosing streak it multiplies with loosing multiplier. Whenever cycle goes from winning to loosing or vice versa the lot size will be reset to default one. This will keep the risk minimized as we are using it for both side. Also when we are in loosing streak we keep on changing the order type from its previous example for example if we hav
Hello Trader,
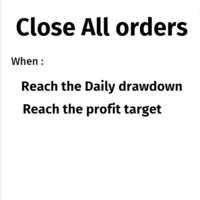
This EA let you manage your daily drawdown and profit. The EA close All market & pending orders when your account reach a choosen level in daily drawdown and choosen level in profit. The level of the loss and the profit can be choosen by 3 ways; - a pourcentage amount of your account - an amount in USD (profit and loss) - an equity target (minimum equity/maximum equity target)
Grid Trend Multiply is a non directional expert advisor which use Martingale to close trade in profit As a user, you need to set the direction in which the EA will take the trade. You can set to either BUY or SELL when you want it to trade in a trending market. In a ranging market, you can set the EA to take both BUY and SELL at the same time. It is a delta neutral strategy which capitalize on the concept that market will visit the same price again and again thus allowing the EA to close the po

The Fractal U is a fractal EA based on a simple price pattern that is frequently seen in financial markets. A fractal is a recurring geometric pattern that is repeated on all time frames. From this concept, the fractal indicator was devised. The indicator isolates potential turning points on a price chart.
The Fractal U trades the possibility of a trend change. This is because fractals are essentially showing a "U-shape" in price. A bearish fractal has the price moving upward and then downw
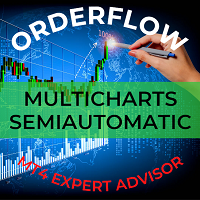
This robot allows you to automate trading of areas of interest drawn on the chart, such as supply and demand zones identified by order flow and institutional trading strategies. It is a multi-chart bot, so you just need to drag the bot to one of the open charts and it will monitor all the charts at once. How does it work: 1. Open the charts you want to trade. 2. Drag the bot onto only one of the open charts. 3. Select your preferences for Risk, Stop loss Ratio or Take profit Ratio. 4. Activate t

Get a free complementary EA after your purchase! Contact me and ill provide it for you.
MT5 Version: https://www.mql5.com/en/market/product/80162
Time frame: M1
Leverage : Higher the better
Spread: Lower the better
Account type : All types
(EA may enter hedge positions, if you want to disable this feature deactivate either Buy, or Sell from the setting)
Please please do not take unnecessary ris

Get a free complementary EA after your purchase! Contact me and ill provide it for you.
MT5 Version: https://www.mql5.com/en/market/product/79739
Time frame: M1
Leverage : Higher the better
Spread: Lower the better
Account type : All types
(EA may enter hedge positions, if you want to disable this feature deactivate either Buy, or Sell from the setting)
Please please do not take unnecessary r
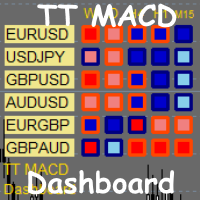
TT MACD Dashboard is multi-time frame and multi-currency market scanner. It is telling you the value of MACD and MACD histogram (a difference between MACD line and Signal line) in a form of small rectangle. If MACD value is above zero (MACD is bullish). Rectangle border color is bullish (Navy by default). If MACD value is below zero (MACD is bearish). Rectangle border color is bearish (OrangeRed by default). If MACD histogram is rising and above zero (Bullish histogram). Rectangle color is bull

The Alligator indicator uses three smoothed moving averages, set at five, eight, and 13 periods, which are all Fibonacci numbers. The initial smoothed average is calculated with a simple moving average (SMA), adding additional smoothed averages that slow down indicator turns. Scan all your favorite pairs with Alligator, and get notified on your preferred time frames.
Setting is Customizable
Click to change time frame or open new pairs
Notification: Phone/Popup/Email

Random trade Random Buy Random Sell Random profit Random Take profit Random Stoploss Crayzy strategy [Important] 0.01 LOT with 10k balance ------------------------------------------------------------------ Contact Us now
Do you want have a EA that trade with your strategy? We will finish the EA in 1-3 working days Prime Capital Viet Nam primecapitalvn@gmail.com
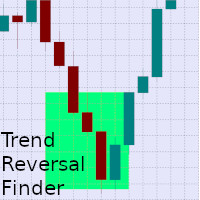
Listed in his faous book "Trading chart patterns like the pros", Suri Duddrella outlines the N-bar rally and decline reversal pattern, which simply states that when stocks make a new high or new low, momentum players will push this stock down or up until eventually they run out of steam. This indicator will look back a certain number of bars to find a continuous uninterrupted rally or decline. Once found, the pattern will look forwards to find the first bar that closes, within a certain range,

Multi Timeframe Moving Average Crossover Indicator With RSI Filter
Indicator gives buy/sell arrows on EMA Crossover. ( Fast EMA Crosses Slow EMA ) While your are monitoring the price in a certain timeframe, you can look for a EMA crossover in different time frames Indicator use RSI as a filter. ( Buy Confirmed when RSI crosses up 50, Sell Confirmed when RSI crosses down 50 ) No complicated settings. Good for pointing reversals on bigger timeframes while looking for a signal on smaller timefram
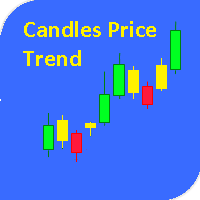
Индикатор рассчитывается по оригинальной формуле и окрашивает свечи в зависимости от общей тенденции на рынке. Синие указывают на восходящий тренд, красные на нисходящий, желтые свечи указывают остановку или возможный разворот. На сильных уровнях или при резком развороте желтые могут не сформироваться но алерт все равно предупредит вас об этом. Достоинства данного индикатора это наименьшее запаздывание, сигнал подается еще вовремя формирования разворотного бара. Настройки: Length - чувствительно

This is a simple PriceTMA bands, non repaint! it can be used for a trend following system or sometimes reversals. as a main signal or a filter for others strategies, it depends on the trader main strategy. calculations for this indicator are a combined Algorithm between moving averages "MA" and average true range"ATR". good luck with your trading! i hope it is helpful Cheers
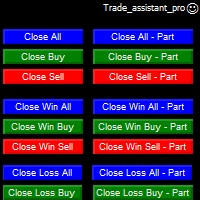
Trade Assistant helps in order management. Just run EA, set up your settings and open a store. EA automatically set = Target Profit, Stop Loss, Trailing Stop / Break Even, Close Trade after + "X" pips (Volume Size "X"%), Delete Pending Orders After "X" Seconds. See the buttons on the chart. He works to close trade, close partialli trade and delete orders
parameters: Set button - close partially (close all part) Volume Size "X"% More settings Enable / Disable Target Profit Target profit Enable

This simple utility EA designed for managing the open trades. For all open trades when the certain amount of profit is reached it closes a part of the position and moves the Stop Loss to breakeven level.
EA has following entry parameters: - Scale-out lots: defines the size of the position that we want to close when profit is reached - Scale-out profit: defines the profit in points when we want to scale out - Breakeven profit: defines how many points above/below breakeven value we want to pu

This is a simple utility which will put Automatic Stop Loss and Take Profit on all your open trades. The input value of the Stop Loss and Take Profit is in Pips. Whenever you open a trade it will put stop loss and take profit in pips automatically. *If you need a more practical stop loss and take profit for your trades then you may like this ATR indicator based stop loss utility, Here! Inputs: 1. SL and Trailing SL - This is the Stop Loss value in Pips. Also used as Trailing Stop Loss if, "Use T
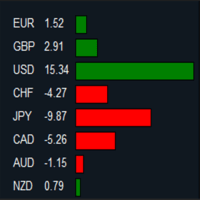
MT5 Version: https://www.mql5.com/en/market/product/124136 Imagine you’re at the helm of your trading terminal, scanning charts of various currency pairs, trying to figure out which ones are strong, which ones are weak, and where the real opportunities lie. It’s a lot to process—flipping between charts, calculating movements, and comparing performance. But what if all of that could be done for you, neatly displayed in one place? That’s where this Forex Strength Dashboard comes in. Picture thi
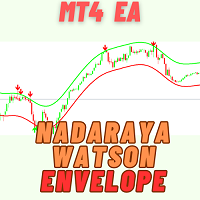
Nadaray Watson Envelope Strategy: The Nadaray Watson Envelope strategy is a technical analysis tool used to identify trends and support and resistance levels. It is based on the Nadaray Watson estimator, which is a non-parametric regression method. The strategy uses envelopes around price data to signal entry and exit points. For detailed documentation Overall Settings/Input Guide High Level Overview of Features Category Setting Description GENERAL SETTINGS Lot Size Initial volume for the fir

Katana EA is an automated trading robot on the MT4 platform suitable for major currency pairs and Gold. The EA is programmed with advanced and powerful algorithms, it works with scalper strategy according to price fluctuations and tick price patterns. Signals follow cash flow movements with high probability. EA strategies have Stop Loss, Take Profit and Trailing options available to protect your account and optimize profits. EA is suitable for accounts with small balances from 200 USD. EA is si
This EA Trails your stops for both manually and auto-opened trades. This EA will work whether you have manually or automatically set stop loss or not. Trailing stop is a more flexible variation of a normal exit order. T railing stop is the practice of moving the stop-loss level closer to the current price when the price moves in your favor. Trailing the stop-loss allows traders to limit their losses and safeguard their positive trades. It is a very popular practice. This EA will manage your o

Trailing Step, Trailing Stop and Stop Loss as we used see how Pro traders used to make consistent profit. Traders who prefer the Stop Loss and Trailing Step trading style can use this EA to power their trading strategy and leverage from the movement of the price towards the Take Profit line with the continuous movement of the SL line. What is special about this EA is that it will immediately open the next trade in the opposite direction once the price hits SL. The EA has a built-in News Filter,
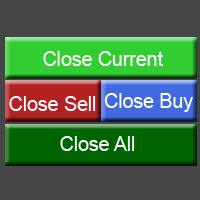
This utility allows you to easily close positions.
You can close buy or sell positions by clicking each buttons. And also you can close whole positions by clicking one buttons.
This panel would be placed left bottom corner of the chart.
If the users want to change the placement and functions contact me.
Important: -Check allow live trading. -Enable Auto Trade trading.

Why the RSI Alert Indicator is Essential for Your Trading Toolkit
In the fast-paced world of trading, timely and accurate information is crucial. The RSI Alert Indicator is a powerful tool designed to help you stay ahead of the market by providing real-time alerts when the Relative Strength Index (RSI) reaches critical levels. Whether you're a novice trader or a seasoned professional, this indicator can significantly enhance your trading strategy by pinpointing potential market reversals with
One of the basic needs of every trader is to have a checklist to enter every position. Of course, using pen and paper may not be convenient forever. With this indicator, you can have a small checklist next to the screen for each of your charts and use it for better use in your trades. MT5 Version This indicator will have many updates and special settings will be added to it.
You can contact us via Instagram, Telegram, WhatsApp, email or here. We are ready to answer you.

Auto Fibonacci Button The Fibonacci retracement is a popular and reliable technical analysis tool for traders to determine support and resistance areas. It employs the "Golden Ratio," a mathematical pattern seen throughout nature and even the universe, to forecast particular levels of support level and resistance level. This tool is generated in technical analysis by dividing the vertical distance between two extreme points on the chart (typically a peak and a low) by the important Fibonacci
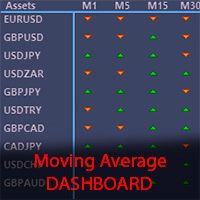
The Moving Average Dashboard indicator allows you to see the relationship between a fast and a slow moving average.
This indicator is working on multiple symbols and up to 21 timeframes. It's allows you to configure the fast and slow moving averages to whatever period, method or price is appropriate
The Moving Average Dashboard saves you time as you can use the indicator to scan multiple currency pairs or other symbols in just one window.
Installation Download the Indicator in your MT5 te

Get a free complementary EA after your purchase! Contact me and ill provide it for you.
Very Important: Please Adjust the "Distance between orders" .. Lower them to get good results. Higher will make the EA much safer.
Trading Forex has a million way!
One of the innovative ways is to go against the surf!
Here we fight the market and work out to get our bread and butter from it :) (Trading is risky, and you may loose!)
From here began the idea! Fighting the market.
The Expert uses

重力拋物線系統 (Mostafa System)
輕鬆判別趨勢走向
提示完美進場點位
交易輔助清單
順勢交易系統
系統介紹:
重力拋物線系統,使用多項式非參數回歸方法計算拋物線重心及趨勢方向,而價格有非常高的機率會按照拋物線的趨勢方向前進,在依個上升趨勢拋物線中,綠線將會是我們第一個進場點,橘線會是第二個進場點,止損位置僅需要放置在橘線下方。此系統可大幅增加趨勢交易的勝率,交易者可清楚分辨當前交易方向,以及系統建議的進場位置。
影片教學:
UncleForex 外匯大叔 ( https://youtu.be/G4Xahx2Mivg )
今天大叔跟大家分享一套由歐洲的分析師,同時也是交易冠軍的 Mostafa Belkhayate 大師所創建的重力拋物線系統策略。
在交易的道路上我們時常聽到"順勢而為" ,按著趨勢方向去交易,然而大部分的交易者很難了解當下的盤面,到底是上升趨勢還是下降趨勢呢? 而重力拋物線系統,卻可以一眼輕鬆辨別趨勢?!
且還能找到最佳的進出場點位!趕緊觀看影片了解吧 ~

Presenting the uGenesys Break of Structure and Change of Character Indicator The uGenesys Market Structure Indicator is the advanced solution designed specifically for forex traders seeking a competitive edge. This innovative tool goes beyond merely identifying Break of Structure (BoS) and Change of Character (CHoC); it also illuminates optimal entry and exit points on your forex charts, transforming your trading experience.
While the uGenesys Market Structure Indicator can reveal pivotal pa

Introducing a sophisticated BreakOut and RecoveryZone tool designed to empower traders in any market scenario, facilitating the optimization of trade opportunities.
The core strategy revolves around executing price breakouts using BuyStop and SellStop orders to achieve specific profit targets in dollars. Notably, traders can manually set the BuyStop and SellStop levels by simply clicking and dragging lines on the chart (FixedZone=true is required).
For swift market entry, you can dr

This is a four strategy in one EA , but two of them have the same closing conditions if the Profit Target or Stop Loss is not reached , Strategy 2 and 3. The first strategy places Buystop/Sellstop orders at key price levels with small stops and closes by implemented indicator,after a certain number of bars or Take Profit function.The user may choose what option for closing may preffer . Close by Macd Offset parameter closes the order by Macd only after the number of bars for the open order h

The GGP Squeeze Momentum MT4 Indicator is a volatility and momentum tool designed to help traders optimize their trading performance and providing traders with actionable insights to make well-informed trading decisions. This indicator is MT4 conversion of the Squeeze Momentum Indicator by “LazyBear “ in Trading View website and some alert methods are added to provide real-time alerts when a trading signal is generated, in order to allow traders to act quickly and efficiently. For MT5 version p

Protect your EA from unauthorized use. With EA Locker you can generate individual licenses for your EA to your customers.
Product blog page You can download MT5 version here
Protection consists of three parts: 1. Your Unique EA identifier 2. User Identifier 3. Expiration date
Description of parts: 1. EA ID is your internal EA identifier. Itcan be the short name of the EA. (MyGridEA, TradeCopierEA...) 2. User identifier can be anything user specific data (Mt4 account number, Account number
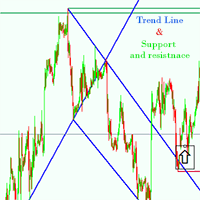
Support and resistance Strategy is one of the most widely used concepts in forex trading.
Strangely enough, everyone seems to have their own idea on how you should measure forex support and resistance. no more wasting time This Indicator is made to do it automatically for you, Features of support and resitance indicator * Automatically detection of the trend line and support & resistance * Works on any pair any time frame any time * Works on offline Chart Inputs : TrendLinePeriod=900 CycleSi

If you are a market operator looking for an advanced solution to identify trends and trend reversals in financial markets, the Weiss Wave indicator could be what you need. Based on the principle of Elliott wave analysis and combining multiple indicators, the indicator provides a comprehensive view of the market in an easy and intuitive way, even for less experienced traders. With clear and easy-to-interpret buy/sell signals, the indicator provides reliable guidance for identifying trends and tre

Use this EA on your Prop Firm challenge to pass with a copy trader. Introducing Prop Firm Killer . This powerful EA is designed to help traders conquer the challenges of prop firms and achieve substantial growth in their trading accounts. It utilizes a Pending Position strategy combined with an advanced and secretive trading algorithm, making it a force to be reckoned with in the market. The strategy employed by Prop Firm Kille r incorporates a unique custom indicator, Trendlines, Support & Resi

The indicator is an inter-week hourly filter. When executing trading operations, the indicator allows considering time features of each trading session. Permissive and restrictive filter intervals are set in string form. The used format is [first day]-[last day]:[first hour]-[last hour]. See the screenshots for examples. Parameters: Good Time for trade - intervals when trading is allowed. Bad Time for trade - intervals when trading is forbidden.
time filter shift (hours) - hourly shift. percent
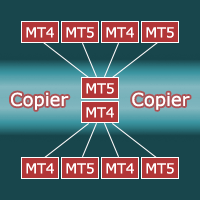
Copier for the MetaTrader4 terminal. Designed to copy trade from one terminal to another. Compatible with the version for the MetaTrader5 terminal; if available, copying can be performed between different terminals (regardless of the type of accounts: hedging or netting). The number of accounts to which copying is possible is not limited (depends only on the computing power of your computer). Directions for copying the version for MetaTrader 4 together with the version for MetaTrader 5: MT5 Net

The indicator determines the inside bar and marks its High/Low. It is plotted based on the closed candles (does not redraw). The identified inside bar can be displayed on the smaller periods. You may set a higher period (to search for the inside bar) and analyze on a smaller one. Also you can see the levels for Mother bar.
Indicator Parameters Period to find Inside Bar — the period to search for the inside bar. If a specific period is set, the search will be performed in that period. Type of i

The purpose of this new version of the MT4 standard indicator provided in your platform is to display in a sub-window multiple timeframes of the same indicator with its divergences. See the example shown in the picture below. But the display isn't like a simple MTF indicator. This is the real display of the indicator on its timeframe. Here's the options available in the FFx divergences indicator: Select the timeframes to be displayed (M1 to Monthly). Define the width (number of bars) for each ti

The TimeFilter indicator allows visually selecting the bitmaks (GoodHourOfDay, BadHoursOfDay, GoodDayOfWeek, BadDaysOfWeek) for the Standard Library's Intraday Time Filter module for trading signals. Additionally, it is possible to enable and disable the trading intervals in a string form. It is also possible to use the trade volume multiplier when using the indicator as a part of an EA. String format: [week day]:[first hour]-[last hour]. See the screenshots and the video for usage examples.
P

Close all opened orders of All charts at defined values... You can define Stop Loss and close pending orders. This EA is setup to close All orders of All charts.
Settings useTP - True/False (use it to close all opened orders at defined TakeProfit) TP - defined take profit to close opened orders useSL - True/False (use it to close all opened orders at defined StopLoss) SL - defined stop loss to close opened orders PendingOrders - True/False (close pending orders with all orders after reaching

The indicator displays the data of the candles from a higher timeframe on the chart. Only the candle body (by the open and close prices) is displayed. The candlesticks are colored depending on the difference between the open and close prices. After removing the indicator from the chart, the objects used by it are deleted automatically.
Indicator Parameters TimeFrame - time frame (drop-down list) BearColor - bearish candle color (standard dialog) BullColor - bullish candle color (standard dialo

This is a short-term scalping Expert Advisor making a small number of trades. The EA follows the price using BuyStop and SellStop orders at a fixed distance and catching fast movements of currency pair quotes. It has a minimum number of adjustable parameters.
The robot is ideal for a trader as an addition to a manual strategy or in conjunction with another EA. The EA distinguishes its trades by a magic number. Pending orders, like market ones, are not left for weekends and are closed 10 minute
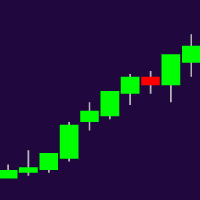
Higher Timeframe Chart Overlay will display higher timeframe candles, including the number of candles high/low you specify.
You no longer need to switch timeframes to check the candles. Everything can be shown in one chart. MT5 Version : https://www.mql5.com/en/market/product/115682 Almost everything can be change as you want. You can change/set:
- Choose different colors for the body and top/bottom wicks.
- Panel's height and width.
- The width of the body and wicks
- Change backgro

ATTENTION the expert does not work in strategy tester, for a trial version visit my profile. ATTENTION the expert must remain with the operations history in " COMPLETE HISTORY " Manual RiskGuard Management
RiskGuard management was born with the idea of helping traders from their initial journey to becoming expert and aware traders. Compatible with any operating system whether Mac or Windows. The operations panel is integrated into the graph giving the possibility to choose size and posit
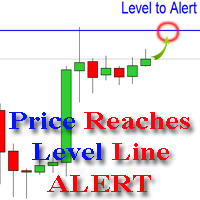
The indicator alerts you when the market price crosses your line level (adjustable). You can change color, thickness and default pip distance for the line via the parameter in input tab (see the screenshot and video below).
Parameters line_color : color for the line to be drawn line_thickness : thickness of the line sound : name of sound file if you want it to play at crossing time default_distancepip : at the first times you add the indicator on chart, it will use this param to draw the line

Moving Speed Scalper is a trading robot uses Scalping Strategy to find opportunities in the market and execute trades with a high probability of winning. The EA uses moving averages to filter the trend, although this trending strategy is simple it works well. Combine the relative volatility of price cycles to determine the best entry position. EA's strategy always uses Stop Loss to protect the account. The EA is suitable for accounts with small balances. You can refer to the Set Files at commen
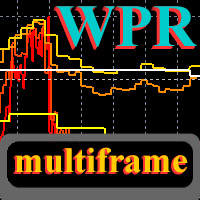
WPR Mtf
This is a multi-frame version of the standard indicator " Williams Percent Range ". Like the other indicators of the author, it allows you to see any set of timeframes at the same time, and all they will be presented on a scale of the current price chart. You can choose any set of timeframes of the indicator and freely switch to the price chart in both the highter and the lower direction. For each price period, indicator charts will always be displayed at the correct scale. The indica

The indicator detects and displays Cypher harmonic pattern also known as Anti-Butterfly (see the screenshot). The pattern is plotted by the extreme values of the ZigZag indicator (included in the resources, no need to install). After detecting the pattern, the indicator notifies of that by a pop-up window, a mobile notification and an email. The indicator highlights the process of the pattern formation and not just the complete pattern. In the former case, it is displayed in the contour triangle
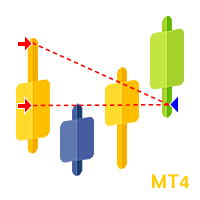
Trade History Plotter is used to draw trades historical position. It's really useful for analyzing previous trades. It can be from manual trade or expert advisor. This trade history plotter is showing open arrow, lines and closing triangle just like a backtest trade history, everything is exactly the same. It can also plot current running trade history Parameters: Plot history Plot running trades Filter by magic number Filter by trade comment Show trade levels Show chart period separator Customi

The current price is for only 7 copies sold, it will then increase to $549 Titan King Presentation
Titan Kings trading system is a combination of cutting-edge AI algorithms and classic trading strategies involving: momentum, supply and demand zones and Ema. In particular, the EA uses an adv
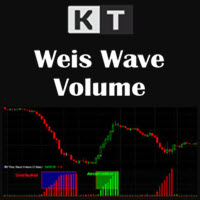
The KT Weis Wave Volume is a technical indicator based on the current market trend and description of the price movement's direction. The indicator is based on volume and displays the cumulative volumes for price increases and decreases in the price chart.
In addition, the indicator window shows a histogram of green and rising red waves.
The green color represents upward movement; the more the price rises, the larger the green volume. The red color represents a decreasing wave; the larger t

KT Fractal Channel Breakout draws a continuous channel by connecting the successive Up and Down fractals. It provides alerts and also plots the Up and Down arrows representing the bullish and bearish breakout of the fractal channel.
Features
If you use Bill Williams fractals in your technical analysis, you must also include it in your trading arsenal. It can be very effective and useful for stop-loss trailing. A new market trend often emerges after a fractal channel breakout in a new directi
Hola Traders. Lot - lot size for pending orders. Martingale - double lot size of pending orders. *(No Martingale = 1.00) TotalGridEachSide - unit each side of pending orders. SpaceOfFirstOrder - distance for the first order in points. Take Profit - profit in points. Stop Loss - loss in points. The entire positioning uses POINTS only. (10 point = 1 pip)
and you can open order BUYLIMIT, SELLLIMIT, ALLBUYANDSELL you can Close Pending, Close orders Profit and Loss and Close All *** ideas for us
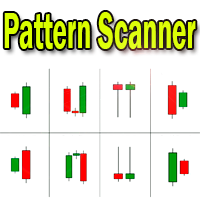
Candlestick pattern indicator - display found candlestick patterns on the chart. MT5-version: https://www.mql5.com/en/market/product/103134 Bearish patterns: Bearish Pattern Designations Pattern name SS
Shooting Star STR(S) Evening Star DJ(E) Evening Doji Star DC Dark Cloud Veil BEP Bearish Engulfing Bullish patterns: Designation of bullish patterns Pattern name HMR
Hammer pattern
STR(M) Morning Star DJ(M) Morning Doji Star PRL Piercing Line BEP Bulli

The KT Heiken Ashi Robot is an advanced and powerful trading expert advisor incorporating a unique trading strategy, combining the Heiken Ashi indicator, Bollinger bands, and Average True Range (ATR). It has been meticulously designed to analyze and exploit trend price movements in the financial markets. One of the notable features of this robot is the use of pending orders. This allows it to place trades at specific price levels, anticipating potential breakouts or retracements. By utilizing p
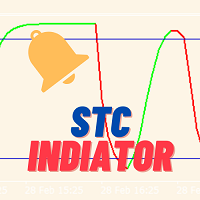
STC Indicator - Boost Your Trading Strategy with Smart Trend Confirmation Description: Enhance your trading strategies and maximize profitability with the STC Indicator for TradingView. Developed by industry experts, the STC Indicator (Schaff Trend Cycle) is a powerful technical analysis tool that combines the best of both trend-following and oscillator indicators to provide reliable buy/sell signals. With its unique algorithm, the STC Indicator effectively identifies trend cycles and confirms

Introducing the uGenesys Psychological Levels Indicator – Your Key to Precision Trading with Real-Time Alerts! Are you tired of guessing where the market might turn? Do you want a tool that can accurately identify psychological levels and notify you when price touches a key level? Look no further – the uGenesys Psychological Levels Indicator is here to revolutionize your trading experience. Imagine having a tool that not only identifies psychological levels with unmatched accuracy but also aler

5 signal in 1 Product TimeFrame Recommend 1m-5m
recommend signal TF 5m
Banks Pro Binary Option is Indicator for binary option Can Use Manaul Trade or Robot on Platform Mt2Trading https://www.mt2trading.com/?ref=104 Time Trading good work EU session Recommend Curency EUR GBP USD careful AUD JPY Recommend Martingale 2-5 Step
Recommend set profit 2%-5%/Day Setting Brake News Event High volatility recommend 15-30 min
Have Problem Contract

MT4 is a Histogram version of MT5: https://www.mql5.com/en/market/product/122151 Introducing Trade Sniper: Your Edge in the Markets. Tired of missing profitable trades or getting caught on the wrong side of the market? Meet Trade Sniper, the cutting-edge indicator that harnesses the power of trends to give you a razor-sharp advantage in your trading. Trend Sniper is not just another run-of-the-mill indicator. It's a sophisticated tool that combines advanced algorithms with time-tested trading

EA Black Wolf initiate a cycle of buy or sell depending of the trend of a built-in indicator, thus the EA works according to the "Trend Follow" strategy, which means following the trend. Recommend pairs EURUSD,GBP USD, EURAUD,AUDJPY,GBPAUD,CADJPY
Time Frame M15
Recommend deposit 1000 usd or 1000 cents Recommend settings Default SETTINGS Lot type - lot type calculation (can be Constant, based on risk or Constant size per 1000) Lot size - lot size Trade Buy - allow the adviser to buy Trad

This is a volume profile that shows the volume with a fixed constant time frame that you set. The indicator also shows the maximum volume value (VPOC - VOLUME POINT OF CONTROL) and the average value, colors and settings you can adjust as you like, there are many possibilities. If you need an indicator that shows the variable volume range frames there is ...HERE... Volume Profile is an advanced charting study that displays trading activity over a specified time period at specified price leve
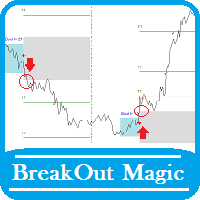
<< See how it works on YouTube >> You can also download the script of this indicator for free here: BreakOutMagic_EA.ex4 Then copy it to the following address: ...\MetaTrader 4\MQL4\Experts Note that in order for the script to work, it must have already downloaded and activated the Break Out Magic indicator from the market. Possibilities:
Arrow signal to buy, sell and hit the targets Alert signal send mail Execute custom audio file The Break Out Magic indicator monitors price fluctuations over
This Telegram Account Updater is a simple piece of program that communicates with Telegram so that you can check your account Balance, Equity, Drawdown percentage and Total Open Lots per pair , its a great tool when you do not have access to your VPS or MT4 servers especially when you have a weak internet connection. Its also suitable for those who are providing Copy Trade kind of services to their clients, this will help your clients to monitor your account and position via your Telegram group.

The Relative Momentum Index (RMI) was developed by Roger Altman, and introduced in his Feb 1993 article in Technical Analysis of Stocks & Commodities magazine. As its name suggests, Relative Momentum Index adds a momentum component to the traditional RSI, designed to increase reliability by decreasing spurious oscillations between defined overbought and oversold levels. This Relative Momentum Index indicator has 2 components. A change in RMI line color provides a warning signal for an upward or

What you can do with CandleStick CandleStick is a useful indicator for doing MTF analysis. This indicator displays the CandleStick of another time frame on the chart . By understanding the information in multiple time charts at the same time, it is easier to understand the overall market view. It is also a useful tool for validating and studying past quotes and trades. There are similar products made by others, but I designed and developed it so that it is easy for me to use.
Features of Candl
This indicator (translated from the Japanese source) automatically identifies authentic Japanese candlepatterns (Japanese Sakata Gohou rules) and displays with arrows the following Japanese candlestick patterns:
BEARISH AND BULLISH ENGULFING CANDLES (known as Tsutsumi in Japanese) BULLISH THREE WHITE SOLDIERS BEARISH THREE BLACK CROWS BEARISH EVENING STARS BULLISH MORNING STARS THREE LINES THREE INSIDE DOWN (marks with a box) THREE INSIDE UP (marks with a box)
You can switch off or on to hav
您知道为什么MetaTrader市场是出售交易策略和技术指标的最佳场所吗?不需要广告或软件保护,没有支付的麻烦。一切都在MetaTrader市场提供。
您错过了交易机会:
- 免费交易应用程序
- 8,000+信号可供复制
- 探索金融市场的经济新闻
注册
登录