适用于MetaTrader 4的EA交易和指标 - 99

The indicator looks for market sentiment impulses and notifies traders accordingly. The indicator can notify of a detected impulse via a sound or alert, as well as emails. You can select the color and display type for bullish and bearish moods. Mood arrow appears on the current bar and remains intact after the bar is formed provided that the bar forming conditions have not changed. At least 100 history bars are required for the indicator operation.
Inputs Period - period of the indicator calcul

Two Dragon is an advanced indicator for identifying trends, which uses complex mathematical algorithms. It works in any timeframe and symbol. Indicator is designed with the possibility to customize all the parameters according to your requirements. Any feature can be enabled or disabled. When a Buy / Sell trend changes the indicator will notify using notification: Alert, Sound signal, Email, Push. МetaТrader 5 version: https://www.mql5.com/en/market/product/14906 Parameters Max_Bars_History —
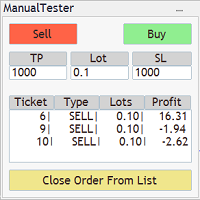
The Manual BackTester Panel utility allows to simulate the manual trading in the MetaTrader 4 strategy tester. The panel works only in the virtual mode of the MetaTrader 4 strategy tester. The demo version allows to open and close ten orders, then the program will automatically turn off. The utility has no parameters at initialization.
Panel Description: The panel has Buy and Sell buttons for placing market orders. It is possible to set the Take Profit and the Stop Loss in the TP and SL fields,

This indicator depends on High and Low price of currency in the last day, and then I made some secret equations to draw 10 lines.
Features You will know what exactly price you should enter the market. You will know when to be out of market. You will know what you should do in market: Buy Sell Take profit, and there are three levels to take your profit Support Resistance Risk to buy Risk to sell
Signal Types and Timeframes Used You can use this indicator just on (M1, M5, M15, M30, H1) timeframe

该指标允许您确定当前的价格方向和市场波动。此版本的交易者动态指数消除了历史数据的重绘,优化了算法计算速度,更多的外部参数进行了更精确的调整,并扩展了其功能:增加了初始振荡器的选择和平均线的平滑方法. 参数: Mode Osc - 估计振荡器选择 Period Osc - 所用振荡器的计算周期 Price Osc - 振荡计算的应用价格 Osc volatility bands period - 振荡器的波动周期 Osc volatility bands multiplier - 振荡器的波动率乘数 Smoothing Osc price line period - 主线平滑期 Smoothing Osc price line method - 主线的平滑方法 Smoothing Osc signal line period - 信号线的平滑周期 Smoothing Osc signal line method - 信号线的平滑方法 Use original levels - 允许添加指标的初始水平水平

Indicator based trading according to the price analysis of bars, the most popular among traders. The indicators calculated based on larger periods are used for identification of a stable trend on the market, and the ones calculated based on smaller periods are used for entering the market after a correction. The oscillators with overbought and oversold levels have a special place in indicator-based trading. The values of such indicators are subjected to wave structure - the higher waves (chart t
This is a medium-term conservative system. It tracks quote movements and defines entry points. The Expert Advisor is completely automated and features the unique algorithm. It has been designed for trading AUDUSD and is based on a range trading strategy. Extreme levels are defined based on history, and the EA starts trading expecting a roll-back. Two limit orders are set in case the price moves further. This product continues the EA Permanent series. Dynamic incoming data filtration method is us
This is a medium-term conservative system. It tracks quote movements and defines entry points. The Expert Advisor is completely automated and features the unique algorithm. It has been designed for trading EURCHF and is based on a range trading strategy. Extreme levels are defined based on history, and the EA starts trading expecting a roll-back. Two limit orders are set in case the price moves further. This product continues the EA Permanent series. Dynamic incoming data filtration method is us

Gegatrade Pro EA is a Cost Averaging System with a Sophisticated Algorithm. It is secured by a built-in “ News WatchDog ” system that suspends trading during news events.
Trading Strategy Gegatrade Pro EA is based on the fact that most of the time the price usually moves between the upper and lower boundaries of the trading channel. Basing on this fact, Gegatrade Pro places its first trade, assuming that the price is going to return to its average value and take the profit which is defined. If

A very powerful tool that analyzes the direction and the strength of the 8 major currencies: EUR, GBP, AUD, NZD, CAD, CHF, JPY, USD – both in real time, and on historical data. The indicator generates a sound signal and a message when a trend changes. Never repaints signal. The strength of the signal is calculated for all pairs which include these currencies (28 pairs total), can have value from 0 to 6 on a bullish trend, and from 0 to -6 on a bearish trend. Thus, you will never miss a good move

MetaCOT 2 is a set of indicators and specialized utilities for the analysis of the U.S. Commodity Futures Trading Commission reports. Thanks to the reports issued by the Commission, it is possible to analyze the size and direction of the positions of the major market participants, which brings the long-term price prediction accuracy to a new higher-quality level, inaccessible to most traders. These indicators, related to the fundamental analysis, can also be used as an effective long-term filter
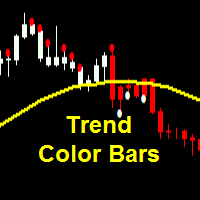
Parameters SoundAlerts = true – play sound alerts, true or false (yes or not) UseAlerts = true – use alerts, true or false (yes or not) eMailAlerts = false – use alerts via email, true or false (yes or not) PushNotifications = false – use push notifications, true or false (yes or not) SoundAlertFile = "alert.wav" – name of alerts sound file ColorBarsDown = clrRed – color body of bearish candlesticks (default – red) ColorBarsUps = clrBlue – color body of bullish candlesticks (default – blue) Colo

Fully automated adviser using an advanced grid algorithm and a function to protect against increased volatility during news releases. The Advisor looks for anticipated levels of reversal / continuation in a narrow price range (the proposed new level of support / resistance) based on previous movements.
Applies invisible for the broker dynamic levels of setting new orders, stop-loss, take-profit and trailing stop. If you set MagicNumber = 0, then the expert can be used in semi-automatic trading.
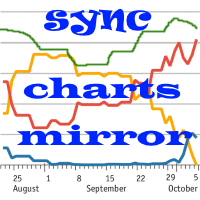
货币对相关性和背离的指标 - 同一价格图表上的所有货币对。显示在终端中打开的所有对。
MT5版本
好处 使用多币种交易策略的交易者可以在同一价格图表上直观地观察所选货币对的价格走势,以便比较它们的走势参数。这是叠加图表指标的高级和扩展版本
它是多币种交易相当有效的助手——“配对交易”和“投资组合交易”,有助于提前确定即将到来的走势。
该技术归结为两种策略,第一种策略旨在在重要新闻发布后或交易大厅开放时发现货币对之间的差异。此类工作的逻辑极其简单,假设市场“风暴”平息后,工具价格之间的delta将再次开始收敛,同时建议关注强支撑和阻力位,以避免在强劲阻力下直接买入,并在底部卖出。
识别支撑/阻力位的错误突破。
可能性 翻转图表上的任何一对 以虚拟购买或销售几对的形式揭示历史模式 计算所选路段上的距离,价格以点数过去了多少 直观地确定货币走势的强度 为每个货币对选择不同的显示颜色 显示样式:条形、蜡烛、线条 时间框架同步和所有图表的滚动 在一个主图表上交易任何货币对的能力 与“ CorrelatePairs ”指标一起使用方便
注意力 在一张图表上安装指标!
在测

Let us analyze what supply and demand are, and how relevant the expression "market memory" is. The screenshots show the operation of the SupDem-Pro custom indicator, it is the improved version of my previously created Shved Supply and Demand indicator. In order to create it, I gave up trading for almost 3 years and studied a lot of literature, I have not traded during this time, but only analyzed the behavior of the price in different situations. It took me quite a long time to correctly formula

The Great Gig In The Sky is an expert advisor and also a song from My favorite Rock Band's. Pink Floyd. There is only one input parameter. Lots amount. You know what do you do in there. Try in a demo account from your real broker to test. Expert logic also includes stop loss and take profit transactions. Do not worry about them. The one-month rental period is only for you to try the experiment and is valid for limited copy. Tested and Preferred pairs are GBPJPY, CHFJPY,CADJPY. I am still contin

Arbitrage-news trading EA. Works at a user-defined deviation from the price during the news release (optional). The trade is opened when the fast broker gets ahead of the slow one by the specified amount of points. The trades are opened by the direction of the fast broker price movement, works both during the news release and without the news filter. The news filter automatically determines the time zone and the currency the news is released on. To enable the news filter you need to do the follo

Introduction: Whatever trading method you use, it is important to know the Pivot levels to take the key attention for your entries & exits. This indicator has been made using the standard classic formula for Auto drawing the Pivot levels. Also based on the previous day trading range, the probable expected today trading range has been highlighted in a different color for your reference.
Output of the Indicator: This Indicator gives the Pivot level Different resistance Levels Different Support le

Grammy — is: Instant messages to your Telegram on any trade events , Commands to control all your terminals from one Telegram chat, Price alerts (crossing horizontal or trend lines), Daily, weekly and monthly reports . You can't test this utility in the Strategy Tester.
Please, contact me to get your free demo version. Why is Grammy better : Fully customizable messages templates , Emoji and "smart" substitution to the messages, Commands to control all your terminals from Tel

Movement Index was first proposed by Steve Breeze and described in his book "The Commitments of Traders Bible: How To Profit from Insider Market Intelligence". It quickly gained popularity among the traders who analyze the CFTC reports, and became a classic and a unique tool in many aspects, which can be used for finding rapid changes, leading to an imbalance of positions between the market participants. The indicator displays the change in the relative position of the participants as a histogra

独特的“剥头皮”趋势指标,具有对结果线进行多层平滑和多种参数选择的功能。它有助于确定趋势的可能变化或几乎在运动开始时的修正。切换的交叉箭头固定并出现在新柱的开盘处,但是,如果有足够的经验,一旦指标线在未完成的柱上相交,就可以寻找入场机会。信号出现限制级别作为附加过滤添加到指标中。 参数: PeriodMA - 主要移动平均线计算周期 MethodMA - 主要移动平均计算方法 PriceMA - 主要移动平均线计算应用价格 BasePeriod - 基本趋势周期 BaseMethod - 基本趋势线的平均方法 BasePrice - 基本趋势线的应用价格 PowerPeriod - 趋势强度计算周期 PowerPrice - 趋势强度计算价格 PeriodBaseSmooth - 趋势线额外平滑的周期 BaseLineSmoothMethod - 附加平滑趋势线的方法 PeriodPowerSmooth - 强度线额外平滑的周期 PoweLineSmoothMethod - 强度线的附加平滑方法 ShowArrows - 启用交叉箭头的显示 Levels - 显示交叉箭头时的附加过滤级
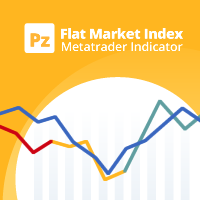
该指标计算代号相对移动了多少才能找到趋势或平淡的市场。它显示最新价格范围的定向百分比。 [ 安装指南 | 更新指南 | 故障排除 | 常见问题 | 所有产品 ] 零值表示市场绝对平稳 值100表示市场完全处于趋势 蓝线表示价格区间健康 红线表示价格范围窄 移动平均线是平坦市场指数(FMI) 它具有直接的交易含义。 当线条为蓝色且在FMI上方时,使用趋势交易策略 当线条为红色且低于FMI时,请使用范围交易策略 根据FMI执行仪器选择 该指标对于避免EA交易平淡交易特别有用。
输入参数 最大历史记录条数:加载时回顾过去的条数。 回顾:研究平盘市场指数的柱线数量。 周期:计算索引的平均周期。 ATR周期:指标中用于计算移动单位的ATR周期。
ATR乘数:ATR的乘数,用于计算索引的移动单位。
作者 ArturoLópezPérez,私人投资者和投机者,软件工程师和Point Zero Trading Solutions的创始人。

Partial Close Expert 是一种将许多功能组合到一个自动化系统中的工具。该 EA 可以通过提供多种选项来管理风险和最大化潜在收益,从而帮助交易者更有效地管理他们的头寸。 使用 Partial Close Expert,交易者可以设置 部分关闭 水平锁定利润,一个 追踪止损 水平,以保护利润和限制损失,一个 收支平衡 水平,以确保即使价格对他们不利,交易也会中断,以及其他几个功能。 通过使用这个多合一的智能交易系统,交易者可以节省时间和精力,因为他们不需要持续监控他们的交易。相反,EA 将根据市场情况执行预设指令,为交易者提供更大的灵活性和对交易的控制。 附加部分关闭专家, 按键盘上的“p” ,更改设置,然后就可以开始了。 部分关闭专家 安装和输入指南 如果您想获得有关 EA 添加 URL ( http://autofxhub.com ) MT4/MT5 终端的通知(见屏幕截图)。 MT4版本 https://www.mql5.com/en/market/product/14965 MT5版本 https://www.mql5.co
纳斯达克100指数EA
演示账户地址: https://www.mql5.com/zh/signals/1076290
这是一款称得上是提款机EA,请仔细阅读以下说明,不要错过赚钱的机会。目前出售价格很低,以后会涨价的哦。 加载到一分钟图表上,这是超短线EA,很小的止损,获胜率很高,可以实现无风险暴利收益。短线+趋势+神经网络。
请注意:必须按照屏幕截图修改参数。 点差成本越低盈利就会越大。一般点差成本在1个pips就可以,不要有挂单距离限制,比如FXCM ThinkMarkets FXTM 等平台都能取得很好的盈利。
lots 1.0 此参数为固定开单手数,指数合约每个平台合约大小不一样,比如FXCM平台NAS100开单1lots实际上等于外汇货币对的0.01lots
use MM 此参数是资金管理,按百分比,100就是100%仓位,按照1000美元本金开单1手作为100%开仓。
Risk 资金管理参数,100就是100%仓位,按照1000美元本金开单1手作为100%开仓。
gi-104 价格两位小数参数设置2000,价格一位小数报价参数设置200

The Sprint is an automated scalper EA for high-frequency trading on the financial instrument of the chart it is attached to. For multi-currency trading the EA should be attached to a chart of the corresponding financial instrument. The EA requires two account types, i.e. (MT5/MT4 or MT4/MT4) terminals on one computer. provider. receiver. The EA trades on the receiver account based on the advance market information of the provider.
Input Parameters Symbol Name - name of financial instrument of t
Neon System N1 PRO is along-term system containing 10 different strategies. Each strategy includes multiple indicators, the system is designed for real trading. The system uses 50 standard indicators, the robot contains 10 strategies. This system is not for those "who want everything at once." This system assumes a professional long-term trading on the Forex market. The robot has been tested in a special tester on real ticks. It uses an adaptive trailing stop algorithm. The EA uses a system of c
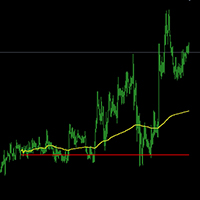
指标采用5分钟的折线图,得到的效果和分时图非常接近 该指标使用方法:1、把5分钟分钟K线图设置改成折线图 2、折线图的颜色改成白色 3、设置好背景和网格颜色 黄色是平均线 红色是零轴(即昨天的收盘价) 指标采用5分钟的折线图,得到的效果和分时图非常接近 该指标使用方法:1、把5分钟分钟K线图设置改成折线图 2、折线图的颜色改成白色 3、设置好背景和网格颜色 黄色是平均线 红色是零轴(即昨天的收盘价) 英文版 Forex Hedge EA 普通版本 Forex Hedge Pro EA 高级版本 中文版 Forex Hedge EA cn 普通版本 Forex Hedge Pro EA cn 高级版本 QQ:437180359 e-
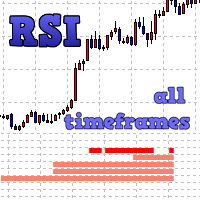
The indicator displays entry signals based on RSI location in overbought/oversold zones on all the timeframes beginning from the current one up to the highest (MN). If RSI is less than Zone but more than (100-Zone), the appropriate indicator value is filled for the timeframe: M1 - from 0 to 10 (sell) or from 0 to -10 (buy); M5 - from 10 to 20 (sell) or from -10 to -20 (buy); M15 - from 20 to 30 (sell) or from -20 to -30 (buy); M30 - from 30 to 40 (sell) or from -30 to -40 (buy); H1 - from 40 to

The market profile indicator provides with an X-Ray vision into market activity, outlining the most important price levels, value area and control value of the daily trading session. [ Installation Guide | Update Guide | Troubleshooting | FAQ | All Products ] Easy to understand and use Understand market dynamics easily Automatic timeframe selection Identify zones of trading value and discard others It is useful in all market conditions Effective for any trading strategy It implements three color
The BOSprint is an automated EA for trading the binary options on the financial instrument of the chart it is attached to. For multi-currency trading the EA should be attached to a chart of the corresponding financial instrument. The EA requires two account types, i.e. two MetaTrader 4 terminals on one computer. provider. receiver. The EA trades on the receiver account based on the advance market information of the provider.
Input Parameters Symbol Name - name of financial instrument of the cha
Introduction to Support Resistance Indicator Support and Resistance are the important price levels to watch out during intraday market. These price levels are often tested before development of new trend or often stop the existing trend causing trend reversal at this point. Highly precise support and resistance are indispensable for experienced traders. Many typical trading strategies like breakout or trend reversal can be played well around these support and resistance levels. The Precision Sup
This multi-timeframe indicator identifies the market's tendency to trade within a narrow price band. [ Installation Guide | Update Guide | Troubleshooting | FAQ | All Products ]
It is easy to understand Finds overbought and oversold situations Draws at bar closing and does not backpaint The calculation timeframe is customizable The red line is the overbought price The green line is the oversold price It has straightforward trading implications. Look for buying opportunities when the market is o

该指标预测价格反转,分析市场的看涨和看跌压力。购买压力是一定天数内所有累积柱的总和乘以交易量。卖压是相同数量条上所有分配的总和乘以交易量。 [ 安装指南 | 更新指南 | 故障排除 | 常见问题 | 所有产品 ] 指标比率使您可以衡量购买压力占总交易量的百分比,该值应在0到100之间波动。它执行两个移动平均值(快和慢),以识别压力趋势的变化并相应地寻找交易。 比率50表示市场均衡 比率超过70表示市场超买 比率低于30意味着市场超卖 红色虚线是当前比率 蓝线是信号线 橙色线是主线 它具有直接的交易含义。
市场超卖时寻找购买机会 市场超买时寻找销售机会 如果信号线高于主线,则压力看涨 如果信号线低于主线,则压力看跌
输入参数 周期:研究计算压力的条数 快速MA:直方图的快速平均周期 慢的MA:直方图的平均周期慢
作者
ArturoLópezPérez,私人投资者和投机者,软件工程师和Point Zero Trading Solutions的创始人。
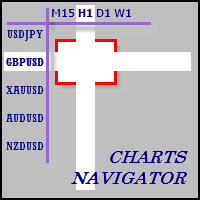
The whole market in one click! Do you value your time? Is ease of use important for you? Are you still looking for the symbol you want or do you have 100 charts open in one terminal? Forget that! Do everything in a single click, on one chart!
Advantages: Quick navigation on all the symbols and timeframes you want in a single chart window; Instant transfer to the required chart in one click; All the necessary symbols and timeframes are clearly and compactly grouped on one chart; Two navigation m
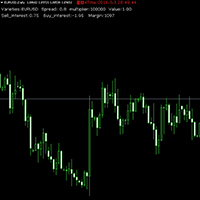
市场基本信息
当前品种 点差 基点价值 空单隔夜利息 多单隔夜利息 保证金 市场时间 市场基本信息
当前品种 点差 基点价值 空单隔夜利息 多单隔夜利息 保证金 市场时间 市场基本信息
当前品种 点差 基点价值 空单隔夜利息 多单隔夜利息 保证金 市场时间
市场基本信息
当前品种 点差 基点价值 空单隔夜利息 多单隔夜利息 保证金 市场时间 市场基本信息
当前品种 点差 基点价值 空单隔夜利息 多单隔夜利息 保证金 市场时间 市场基本信息
当前品种 点差 基点价值 空单隔夜利息 多单隔夜利息 保证金 市场时间
英文版 Forex Hedge EA 普通版本 Forex Hedge Pro EA 高级版本 中文版 Forex Hedge EA cn 普通版本 Forex Hedge Pro EA cn 高级版本
QQ:437180359 e-mail:hl3012

The Supply and Demand Zones indicator is one of the best tools we have ever made. This great tool automatically draws supply and demand zones, the best places for opening and closing positions. It has many advanced features such as multi timeframe zones support, displaying the width of zones, alert notifications for retouched zones, and much more. Because of market fractality, this indicator can be used for any kind of trading. Whether you are a positional, swing, or intraday trader does not ma

Enhance your price action strategy: inside bar breakouts at your fingertips
This indicator detects inside bars of several ranges, making it very easy for price action traders to spot and act on inside bar breakouts. [ Installation Guide | Update Guide | Troubleshooting | FAQ | All Products ] Easy to use and understand Customizable color selections The indicator implements visual/mail/push/sound alerts The indicator does not repaint or backpaint An inside bar is a bar or series of bars which is/a
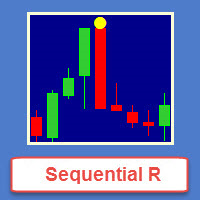
Sequential R is a powerful indicator from the set of professional trader. In today’s market, an objective counter trend technique might be a trader’s most valuable asset.
Most of the traders in the stock market must be familiar with the name "TD Sequential" and "Range Exhaustion". The Sequential R is a Counter-Trend Trading with Simple Range Exhaustion System. TD Sequential is designed to identify trend exhaustion points and keep you one step ahead of the trend-following crowd. The "Sequential
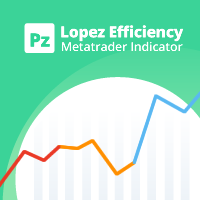
该指标基于一定数量的柱线的真实高/低比率来分析当前市场波动的效率。 [ 安装指南 | 更新指南 | 故障排除 | 常见问题 | 所有产品 ] 比率是市场运动的有效性 比率低于1意味着市场无处可去 比率大于1意味着市场开始显示方向性 比率大于2表示市场正在显示有效的波动 高于3的比率表示市场移动太多:它将停止或回调 它具有直接的交易含义。 当线是红色时寻找位置机会 当比率为橙色时寻找区间交易机会 当比率为蓝色时寻找趋势交易机会
指标如何计算? 指标显示在期望的柱数期间市场移动了多少典型真实区间。典型的真实范围是从最后一根柱线开始的平均真实高-低范围,然后将其与同一时间段内的绝对市场走势进行比较。指标比率可以衡量范围和市场走势之间的比率,从而衡量市场效率。零表示市场效率低下,无处可去。
设置 该指标只有一个参数:指标周期,这是要回算的柱线数量。
作者 ArturoLópezPérez,私人投资者和投机者,软件工程师和Point Zero Trading Solutions的创始人。

这个指标将检测手动和自动方法在图表上绘制的谐波模式。 您可以从此链接查看用户手册: 添加您的评论并联系我们以获得它 有一个免费版本可以在mt4上尝试此产品。 您可以使用它来检测Gartley和Nenstar模式: https://www.mql5.com/en/market/product/30181 您可以从以下链接购买完整的MT4版本: https://www.mql5.com/en/market/product/15212 注意 指标具有控制面板,并将保存每个(图表和时间框架)设置。 您可以将其最小化以在图表上获得更多空间,并且如果您更喜欢使用其他分析工具,则可以按关闭按钮隐藏所有指标数据 当您使用此指标并更改设置,添加诸如移动平均线或布林带之类的指标时,此指标将自动保存您的模板编辑,并且您可以随时加载它们。 如果您使用的是Windows 10,请右键单击MetaTrader图标>兼容性>更改高DPI设置>系统(增强)以获得最佳屏幕设置(应在高清设备中完成)。 指标只是谐波交易理论的解释,用于检测图表上的谐波模式。 如果您想学习它,可以搜索Scott Carney的书,名为“Ha
This is a medium-term conservative system. It tracks quote movements and defines entry points. The Expert Advisor is completely automated and features the unique algorithm. It has been designed for trading CHFJPY and is based on a range trading strategy. Extreme levels are defined based on history, and the EA starts trading expecting a roll-back. Two limit orders are set in case the price moves further. This product continues the EA Permanent series. Dynamic incoming data filtration method is us

Another Relation displays the relative movement of the other symbols (up to 5) in a separate chart window. The indicator works currency pairs, indices and other quotes. Another Relation allows to visually estimate the symbol correlation and their relative amplitude. Thus, the trader is able to compare the movement of the current instrument to others, identify correlations, delays and make decisions based on their general movement.
Indicator usage
The window displays the data on all the symbols

The indicator takes screenshots of the active terminal chart. Available image saving options: At the opening of a new bar (candlestick) depending on the currently selected timeframe; After a certain time interval, e.g. every 10 minutes after indicator launch on a chart; When trade orders are opened/closed both by an Expert Advisor and manually; Each time when a user clicks the "Screeshot" button.
Indicator Parameters Settings Screenshot time Start Time (hh:mm) - sets the start time of indicator

MFI Pointer is an indicator based on Money Flow Index indicator that uses both price and volume to measure buying and selling pressure. Money Flow Index is also known as volume-weighted RSI . MFI Pointer simply draws arrows on chart window when value of Money Flow Index (from parameter MFI_Period) is below MFI_Level (green upward pointing arrow) or above 100-MFI_Level (red downward pointing arrow). Indicator works on all timeframes and all currency pairs, commodities, indices, stocks etc. MFI Po

Spread Display is a simple but very helpful indicator allowing live monitoring of spread in chart window. Using this indicator, there's no need to distract attention never again, seeking current spread value somewhere else. From now on, everything is clear and at the height of your eyes, in chart window of selected currency pair. Indicator has many settings. We can choose any font we want and we can set 3 spread levels ( Spread_Level_1 , Spread_Level_2 and Spread_Level_3 ) between which will cha

Description:
This indicator is a collection of three indicators , it is 3 in 1: PipsFactoryDaily Click Here PipsFactoryWeekly Click Here PipsFactoryMonthly Click Here If you are interesting in all of them, you can save money - this collection indicator is cheaper.
This indicator depends on High and Low price of currency in the (Last day / Last week / Last Month) depends on user input, and then I made some secret equations to draw 10 lines.
Features:
You will know what exactly price you should

The EA uses the strategy based on breakout. Breakout trading is one of the most popular and most frequently used strategies among Forex traders. This strategy has been developed a long ago and has been repeatedly tested on history data, showing superior results. The EA uses 3 types of trend breakouts, (support and resistance breakout, downtrend breakout, uptrend breakout). The EA uses a very small SL so the account is always protected from equity drawdown with a very low risk-per-trade. It uses
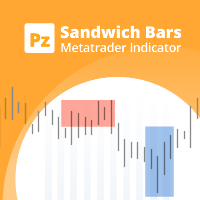
Spot high-probability trades: sandwich bar breakouts at your fingertips This indicator detects Sandwich Bars of several ranges, an extremely reliable breakout pattern. A sandwich setup consists on a single bar that engulfs several past bars, breaking and rejecting the complete price range. [ Installation Guide | Update Guide | Troubleshooting | FAQ | All Products ] Easy and effective usage Customizable bar ranges Customizable color selections The indicator implements visual/mail/push/sound aler

XMaya Scalp ZR Series is a fully automated Expert Advisor designed for Traders. XMaya Scalp ZR Series is a robot trader with multi-currency scalper Expert Advisor. This robot trades on any Time Frame, Can be use on all pairs but not for use on XAU/GOLD . The system is ready-to-use with the setup is simple, with simple optimization on Take Profit, Stop Loss, and Trailing.
User-Defined Variables OrderCmt - used for comments Magic - Magic Number to identify the order's mode for the EA. TargetProfi

Deposit from $100.
BomB is a fully automated Expert Advisor that does not use grid strategies, martingale, averaging positions, waiting out a loss, etc.
All positions have a fixed Take Profit and Stop Loss.
It is possible to use a dynamic lot to increase the volume of positions with successful trading. Automatic detection of the GMT shift. Automatic Swap filter. Restoring the balance after a drawdown. There is a news filter.
The main currency pairs are: AUDCAD, AUDCHF, CADCHF, CHFJPY, EURAU

WARNING: Product is out of support! Don't buy it unless you know how it works! Please download free version and test it heavily - it is enough for most uses. MT5 version is highly recommended due to superior back-tester.
This is PRO version of famous (or infamous) grid strategy used by social traders.
It contains YourAI module that lets you construct your own logic with almost every indicator from the market or code base! Use it in classic Grid Trading style or build your logic from scratch .

Volume Volatility is an indicator which analyzes currency pairs, indices, commodities etc. in terms of extremely high and extremely low accumulation to distribution ratio in comparison to values from past. The most important parameter is "Volume Volatility Factor" - this parameter, in big simplification, determines how far distance in the past is analyzed. The lower value of the parameter, the indicator analyzes less data from the past. I recommend you to set and test e.g. 3, 5, 15, 35, and 48 w

The News Filter based EA Controller (NFC) is a very convenient utility to control the live trading status of your Expert Advisors during important news events. The NFC was programmed to prevent all Expert Advisors of live trading during significant news events. The NFC is resource-efficient and uses the Forex Factory Calendar. It is not necessary to set offset hours dependent on your broker, it will be done by the NFC. The NFC was successfully used and tested under MetaTrader 4 on a personal com

New version of the semi-scalper multicurrency Expert Advisor that uses an advanced adaptive trading strategy based on a position averaging. It uses a completely different strategy for market entries. The new version features a new function – total trailing stop of the opened positions by equity in the deposit currency or as a percentage of profit. A virtual trailing stop can be applied to the first opened trade. A stop loss can be used to protect the capital. The product is designed for 4 and 5-

Solomon's Chest is fully automated scalper Forex robot which trades on ranging and slightly trending market. The trade entries are based on dynamic zones in all timeframes and with the most recent 30bars of all timeframes. Once opportunity level is determined, it will open trades right away. Each order is protected with hidden calculated Stop Loss level. Take profit level is also calculated. The real profit most of the time is actually taken from the trailing stop and with a breakeven point of 5

Be notified of every color change of Heiken Ashi (HA) candles. The indicator will trigger past and new signals every time that HA candles change their colors. Note : this tool is based on the code of Heiken Ashi indicator developed by MetaQuotes Software Corp.
Features The signals are triggered at closing of last bar/opening of a new bar; Any kind of alerts can be enabled: Dialog Box, Email message, SMS notifications for smartphones and tablets, and Sound alerts; By default, up arrows are plott
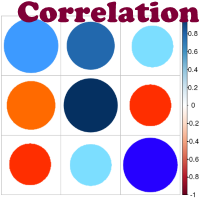
Advantage The analyzer provides an opportunity to examine correlation in history, for example, for the previous month excluding the current one, thus allowing you to evaluate symbol movement in history. It can be conveniently used in conjunction with LineSyncMirrorChart analyzer. Charts are synchronized by a market type: Forex, CFD, Futures, and Indices. The analyzer calculates the distance covered by the price on a specified period in points. The tool fits pairs and portfolio traders.
Descript
STOCH+RSI+CCI Expert Advisor is based on standard Stochastic, RSI, and CCI indicators. A market entry is performed according to indicators' aggregate signals using stop levels and trailing. A deposit is a part of the trading system. This is a martingale. Both arithmetic and geometric progressions are available. Besides, the EA features the function of recovery from a loss.
System settings averaging included – enable averaging.
averaging only on signal – average only by a signal.
averaging Type
With Symbol Switch you can easily change the symbol of all open charts without losing your analysis or template. Easily monitor many symbols with only one monitor. Auto save\load analysis separately for each symbol (including all graphical analysis and attached indicators). The indicator shows the symbols which are visible in your MT4 "Market Watch" window. To add\remove a symbol just add\remove it from MT4 "Market Watch" window. Monitoring all symbols profit with the panel. Works with all broke

Grid robot that maintains every open position opened by the trader. The buttons on the screen are used for opening the initial trade. The yellow labels display the price of total breakeven for each grid. The light blue labels display the level of total take profit for orders of each grid. The take profit is virtual. With each subsequent opened order the take profit of the grid is adjusted to get the total profit in the sum of the profit of the initial order, regardless of the size of all lots in
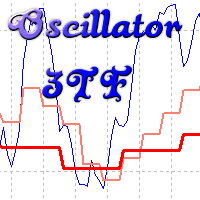
Oscillyator 3TF displays data on standard oscillators (RSI, MFI, STOCH, CCI, DeM, Momentum) on the current and two following timeframes. The modified version of Price Reversal oscillator is also added. The indicator allows you to track the situation on higher timeframes and select suitable entry points when oscillator lines are in oversold/overbought zones. The indicator may notify of all three lines located in specified zones via alerts, emails, and push notifications.
Parameters
Period – indi

或“MAC”。 这是一个旨在帮助您捕捉和交易趋势的指标。这个指标背后的想法可以在接下来的步骤中解释:
画一个快速移动的平均信封。 画一个缓慢移动的平均信封。 MAC Upper Band 是两个包络的高值之间的最高值。 MAC 下频带是两个包络的低值之间的最低值。 MAC 直方图云填充两个波段之间的距离,以显示方向的变化。 蓝云表示上升趋势,而红云表示下降趋势。 阅读下一篇博客,了解如何使用 MAC 缓冲区构建您自己的 EA 或扫描仪:
https://www.mql5.com/en/blogs/post/734293
如何使用 MAC
使用 MAC 云作为过滤器来帮助您识别趋势方向。 使用您常用的交易工具在 MAC Clouds 的方向上进行交易,只是为了尽可能地消除错误信号。 使用建议的进入箭头可帮助您找到强大的趋势点作为起点。 MAC 功能 MAC 不会重新绘制或重新计算其结果。 它适用于加密货币、股票、指数、石油、黄金和所有时间范围。 声音、电子邮件警报和移动通知。 买入、卖出箭头有助于识别趋势信号。 精心设计的参数可帮助用户轻松地在它们之间导航。 建立自己的专家顾

Master Trend Dashboard is a new generation indicator, compact, light and efficient. Each element of this Dashboard is designed to return specific signals as: Price Action, Breakout, Net Change (performance of the instrument), algorithmic studies, correlations and statistical calculations. This tool will change your way of trading allowing you to receive important information. See the Graphic Signals to understand every single signal below:
Graphic Signals Symbol name and arrow color Green = Cur

This scalper Expert Advisor uses instant execution pending orders. No grid and martingale. Each trade is protected by a tight stop loss. It is designed for 4-5-digit quotes. The EA is recommended for use on EURUSD, GBPUSD, AUDUSD, USDJPY, USDCHF, USDCAD, NZDUSD, EURJPY, EURGBP, and EURCHF. VPS is required for flawless operation, minimum deposit is 100 units of the base currency. Timeframe – from M15 to H4. Optimization tip! Only several parameters should be optimized for the period of the last f

Volumes are one of the most important factors of trading, as it is the high volumes that move the market in either direction. But there are very few standard indicators for volumes in MetaTrader 4. The Volume Candles analyses the volumes of the trades and displays candles depending on these volumes. The candle appears once the required number of volumes has passed during trading (the VolumeCandle parameter). If the candles close frequently and are thin, then the volumes on the market are current
TMA Simplemartin Expert Advisor is based on TMA channel indicator, as well as Stochastic and CCI standard indicators. A market entry is performed according to indicators' aggregate signals using stop levels and trailing. A deposit is a part of the trading system. This is a martingale. Both arithmetic and geometric progressions are available. Besides, the EA features the function of recovery from a loss (TMA compiled into resources).
System settings averaging included – enable averaging. averagi

The indicator detects and displays the 5-0 harmonic pattern on the chart according to the scheme provided in the screenshot. The pattern is plotted by the extreme values of the ZigZag indicator (included in the resources, does not require additional installation). After detecting the pattern, the indicator notifies of that by the pop-up window, a mobile notification and an email. The indicator highlights not only the complete figure, but also the time of its formation. During the formation the f

This is an advanced Expert Advisor based on Lasors. The modified analysis algorithm allows you to better process the signals of the same-name indicator. Along with other changes and innovations, this facilitated program separation into a new product. The EA features a level breakthrough strategy. Stop loss and take profit levels are added immediately after a trade is opened. If the market has no definite trend, part of a position is gradually closed with a new impulse. In case of a dynamic trend

The indicator detects and displays the AB=CD harmonic pattern on the chart according to the scheme provided in the screenshot. The pattern is plotted by the extreme values of the ZigZag indicator (included in the resources, does not require additional installation). After detecting the pattern, the indicator notifies of that by the pop-up window, a mobile notification and an email. The indicator highlights not only the complete figure, but also the time of its formation. During the formation the
At last! See the actual, oscillating RSI for multiple pairs & multiple timeframes, all on the one chart!
The Benefits of Multi TimeFrame / Multi Pair Analysis Multiple time frame analysis is one of the most important things you should be doing before you take every trade. The most successful traders rely on monitoring several timeframes at once, from the weekly down to the 1 minute. They do this because using only one timeframe causes most traders to become lost in the "noise" of random price m
MetaTrader市场是 出售自动交易和技术指标的最好地方。
您只需要以一个有吸引力的设计和良好的描述为MetaTrader平台开发应用程序。我们将为您解释如何在市场发布您的产品将它提供给数以百万计的MetaTrader用户。
您错过了交易机会:
- 免费交易应用程序
- 8,000+信号可供复制
- 探索金融市场的经济新闻
注册
登录