适用于MetaTrader 4的EA交易和指标 - 46
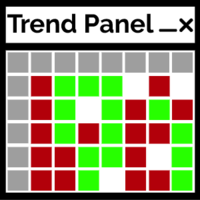
趋势面板是一个简单方便的工具,它将使用用户选择的十对显示时间帧 M1 - D1 的已确认趋势方向。
该指标旨在将方向确认添加到任何策略/模板中,然后还可以作为一个干净的交互式界面快速将图表更改为不同的货币对或时间范围。 群聊: https://www.mql5.com/en/users/conorstephenson 请在购买后与我联系以获取设置建议和免费专家顾问! 我的产品仅在 MQL5 上出售 ,如果您在其他任何地方看到此产品,那是仿制品。不要被愚弄 。 主要特点 清洁图表面板以快速帮助确定时间范围内的趋势方向。 交互功能。 更改图表蜡烛的颜色 - 轻松查看当前和过去的趋势。 点击配对和时间框架按钮可更改当前打开的图表。 单击图表上的面板并将其拖动到最适合您的模板设置的位置。 选择要显示的 10 对。 编辑面板中使用的颜色。 将与外汇对、指数、股票、加密货币... 提示新趋势开始的警报功能。 建议 当面板中的所有一个垂直列都是相同的颜色时,一对可以被认为是强烈趋势。 与策略/模板一起使用以获得时间框架趋势方向的视觉帮助。 输入定义 趋势模式。 更改蜡烛颜色 - True 将更
FREE
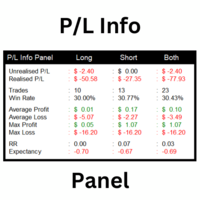
This utility shows various types of information on chart, controlled by many filters and option for each of them. If you want any custom feature or want to remove something from this product for your personal use. Please send me a personal message, I'll be happy to do so for you. Inputs and features explained: BG Color - Background color of the Dashboard
Text Color - Color of text info on the Dashboard
Border Color - Color of Border of the Dashboard Set Color on +/- Text - True/False o
FREE

Average Price Plus is an essential indicator for day-to-day operations. With it, you can graphically check the average price between several open orders on your chart. The average price is the breakeven point between your orders. In addition to the average price, the indicator also shows you the number of pips and the financial value resulting from your open orders, the percentage gains, the number of lots in operation and the number of open orders. Negative values in "pips" or in financial val
FREE
Highly configurable OBV indicator.
Features: Highly customizable alert functions (at levels, crosses, direction changes via email, push, sound, popup) Multi timeframe ability Color customization (at levels, crosses, direction changes) Linear interpolation and histogram mode options Works on strategy tester in multi timeframe mode (at weekend without ticks also) Adjustable Levels Parameters:
OBV Timeframe: You can set the lower/higher timeframes for OBV. OBV Bar Shift: Y ou can set the offs
FREE

This indicator helps you to Scan symbols which are in the Market Watch Window (in demo Max 15 Symbol) and filter out trends with alerts. It works based on the most popular indicator "Bollinger Bands" which is used by many traders for trading: When box color changes to " Green " or " Red " color, it indicates you for trend change for long and short entry. And also you will get alerted on screen. When it changes to " Green ", it indicates you that trend is going upwards, and you can take the long
FREE

Indicador "Heikin Ashi Master" para MetaTrader: Transforma tu Análisis con Velas Japonesas Suavizadas El indicador "Heikin Ashi Master" es una herramienta innovadora diseñada para traders que buscan una perspectiva única del mercado a través de las Velas Japonesas. Compatible con MetaTrader, este indicador suaviza la acción del precio, ofreciendo una interpretación simplificada y visualmente atractiva de las tendencias y cambios en el mercado. Características Destacadas: Suavizado de la Acción
FREE

Robot CFO1.2EA is an innovative financial management system designed to optimize portfolio performance through the integration of contrarian, hedging, and grid techniques. Leveraging cutting-edge artificial intelligence algorithms, it provides sophisticated risk management and investment strategies tailored to meet the unique needs of your financial portfolio.
Robot CFO1.2EA employs a contrarian investment approach, capitalizing on market inefficiencies and deviations from the norm. It identif
FREE

本EA用于管理订单,功能强大。 提供以下功能: 如果单子没有设止损,则为单子设置止损。 如果单子没有设止盈,则为单子设置止盈。 如果某品种的单子总个数超过设定值,则平掉最后开的单子。 如果单子手数超过设定值,则平掉该单子。 如果单子的盈利点数超过设定值,则平掉该单子 如果单子的亏损点数超过设定值,则平掉该单子 如果单子的盈利金额超过设定值,则平掉该单子 如果单子的亏损金额超过设定值,则平掉该单子 如果某个品种的所有单子的盈利金额超过设定值,该品种单子全平掉 如果某个品种的所有单子的亏损金额超过设定值,该品种单子全平掉 如果单子盈利超过设定点数,则设平保 如果单子的浮动盈亏比超过设定值,则设平保。这个单子必须设置有止损,否则无法计算浮动盈亏比。 如果帐号所有单子 盈利 金 额 超过设定值,平掉所有单子 如果帐号所有单子 亏损 金额 超过设定值,平掉所有单子 如果设定了只交易品种,当某个单子品种不在此列时,则会被平掉。即限制了只能交易品种。 如果设定了不交易品种,当某个单子的品种 在此列 时,则会被平掉。即限制了不允许交易的品种。
参数设置 注意: 所有的参数必须设置为正数,对应的功能
FREE
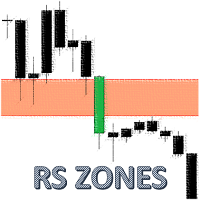
The indicator uses a mechanical approach to identify resistance/support zones and assess their levels of strength showing which price zones are more important than others. Resistance and Support are the main leading indicators used by most traders around the world. To be a successful trader, every trader needs to master the proper detection of price zones. This indicator was created to avoid subjectivity rules when drawing support/resistance zones. Most of the time, resistance and support are no

TickChartOscillator is an indicator that displays a symbol's tick chart in an oscillator subwindow. It offers flexible customization options, including: · The ability to hide the price line in the oscillator. · The option to specify a different symbol for tick chart display. If the "Symbol" parameter is left blank, the tick chart will be shown for the current symbol where the indicator is applied. This tool is perfect for traders who want to view tick dynamics in an oscillator format and u
FREE

Traders Dynamic Index (TDI) Signal Input parameters: signal mode: set it to true if you want to plug it into STAT (Signal Tester and Trader) arrow shift: distance between fast EMA line to arrow on chart middle band filter price line filter RSI period RSI price method Volatility period MA period 1 MA period 2 Averaging method You can find the best setting for 4 hour EURUSD on this video
FREE

The "Dagangduit Spread Indicator" is a versatile tool designed to provide traders with essential information about the current spread in the chart window. This indicator offers customizable features, including font parameters, display location on the chart, spread normalization, and alerts to enhance your trading experience. Key Features: Real-time Spread Display : The indicator displays the current spread in real-time on your trading chart, allowing you to stay informed about the cost of execut
FREE

Description:
This Free Indicator will allow you to monitor the Max/Min spread in a bar/candle. By running it 24h/24h will allow you to recognize which period of time having maximum spread, based on that you will understand the market more, and could develop/improve to have better trading strategy.
Parameters: limit: <specify the limit of spread, above which the indicator will mark the price, at which high spread occurs>
Note: Beside the price marked due to high spread above, the indicator
FREE

该面板具有每个初学者都可以处理的最直观的界面。
在 SLp 列中 - 您需要以点子为单位指定 SL 大小。如果该值变为灰色,同时 Bay / Sell 按钮也处于非活动状态,则您指定的 SL 值小于经纪商设置之前允许的值。
在 TP% 列中 - 您以帐户余额的百分比表示 TP。在设置中,您可以根据此指标的计算方式选择净值、余额或可用保证金。
在 R% 栏中,您可以设置交易的风险值。
插入按钮。 - 允许您立即使用设置的值打开订单,如果禁用,则您可以直接在图表上预设交易参数。
在顶部,您可以通过单击左上角的减号来最小化图表上的面板。
还可以通过调整面板名称下方的 + 和 - 按钮来增加或减少面板本身的大小。
如果您还想开挂单和转移到BU,追踪止损,保存开单的各种设置,支持各种技术的定单,那么考虑一个功能更强大的EasyTradePad面板,您可以在我的产品中找到它。
FREE

***BIG UPDATE to PRO version*** EA Wanyen has been formulated to trade market fluctuations. The operation is based on opening orders using the Wanyen indicator, thus the EA works according to the "OVB/OVS" strategy, which means Overbought/Oversold. When a trade goes to minus the adviser opens another order with an increased lot( Martingale ). It is possible to expose automatic control of the capital where the adviser himself will calculate stop loss and a lot depending on your deposit. Als

Contact us for any custom order, CodeYourTrade.com .
Timed Close EA is used to close all the trades automatically at your specific time. You can set the EA using any of the 3 options: 1. OneTime: In this option EA will run only once. Execute at that date-time and stops. 2. Weekly: In this option EA will run at specific day-time every week. For example if you wanted to close all the trades before market close at Friday, you can use this option. 3. Daily: In this option EA will run d

我添加了一个要求很高的足迹图请求。 该指标非常基本,显示买入量和卖出量。 它不是信号指标,它只会显示蜡烛的交易量并显示过去的值。 Forex 没有集中交易量,但这打破了并显示了逐笔交易量。 卖出蜡烛将显示询价,买入蜡烛将显示出价。 可以作为单一分析系统或与其他因素一起交易。 如果从这个意义上观察市场,这可能是有价值的信息。
我希望增加具有更多功能和特性的指标来帮助分析,价格将反映需求和更多特性。
我添加了一个要求很高的足迹图请求。 该指标非常基本,显示买入量和卖出量。 它不是信号指标,它只会显示蜡烛的交易量并显示过去的值。 Forex 没有集中交易量,但这打破了并显示了逐笔交易量。 卖出蜡烛将显示询价,买入蜡烛将显示出价。 可以作为单一分析系统或与其他因素一起交易。 如果从这个意义上观察市场,这可能是有价值的信息。
我希望增加具有更多功能和特性的指标来帮助分析,价格将反映需求和更多特性。
Market Reversal Catcher Dashboard indicator looks for market reversal points or major pullback. To do this, it analyzes previous price movements and using a flexible algorithm for estimating the probability of a reversal, also gives recommendations on entry points and sets recommended profit targets for positions opened on a signal. The dashboard is designed to sit on a chart on it's own and work in the background to send you alerts on your chosen pairs and timeframes. Dashboard does not requi

Key Features: Custom Image: The script allows you to set any image of your choice as the chart background. The image file should be in the .bmp format and located in the MQL4/Images folder of your MetaTrader 4 data folder. Automatic Replacement: If an image is already set as the chart background, the script will automatically replace it with the new image. How It Works: The script operates in the following manner: Initialization: Upon execution, the script checks if an object named “ i
FREE

SMARTMASS INDICATOR This indicator is different from all known volume indicators. It has a significant distinction; it is an algorithm that relates price movement to volume, attempting to find proportionality and efficient movement while filtering out noise and other movements that are more random and do not follow a trend or reversal. Ultimately, it reveals the true strength of the movement, indicating whether it has genuine support from bulls or bears or if it's merely a high-volume movement
SK Stochastic Candle Moves EA based on Stochastic oscillator . It is used to generate overbought and oversold trading signals. Easy to use and Simple Max Drawdown protection No Martingale Recommended GBPUSD,EURUSD Timeframe M30,H1 others timeframes with the appropriate settings. Works for ECN/Non-ECN brokers and 2-3-4-5 digit symbols
A low latency vps is and an lower spread broker is always recommended. Support us by open My recommended broker. Exness Tickmill How its work ? Candl
FREE
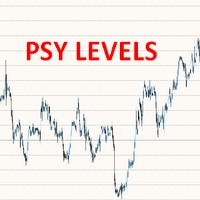
This free MT4 indicator allows you to automatically display psychological price levels on your chart It's very powerful when you combine it with other tools such as Fibs levels, Supports & Resistance levels, Moving Averages, Wyckoff schematics, etc. For example, you can use this indi to display horizontal levels every 100 points on your GER40 chart, or 500 points on your BTC chart, etc. ***Please comment, rate and share it to your friends if you like it***
FREE

Discover our sophisticated Expert Advisor (EA) designed for the MetaTrader 4 (MT4) market: IT Bollinger Bands. This free EA exploits a trading strategy based on Bollinger Bands, offering a powerful approach to optimizing your operations in the financial market. Key Features : Bollinger Bands Strategy: Our EA uses Bollinger Bands, a popular approach in technical analysis. Based on the period (20), the standard deviation (2), and the shift of the bands, our EA identifies trading opport
FREE

When prices breakout resistance levels are combined with Larry Williams' Percent Range oscillator "WPR" breaks out its historical resistance levels then higher chances emerges to record farther prices. It's strongly encouraged to confirm price breakout with oscillator breakout since they have comparable effects to price breaking support and resistance levels; certainly short trades will have the same perception. Concept is based on find swing levels which based on number of bars by each side to
FREE

21 simple moving average ( All Type of 21 MA River ) 51 simple moving average
Long Entry Upper 51 MA and above the 21 River Middle channel. Long Only Above Green Line (Market Opening Line) Short entry Below the lower 51 MA and below the 21 lower channel. Short Only Below Green Line (Market Opening Line)
Exit position
Initial stop loss is 20 pips below (for buy) or above (for sell) Target : Next level as per indicator Profit Target ratio 1:1.2
Download Template : https://drive.google.c
FREE

如果你象这个项目一样,就有5个饥饿审查。 塔克的后续工作: borelatech
大量贸易要求我们寻找多种工具/工艺品,以寻找多种工具。
找到新的机会,这一指标将帮助你具体勾画具体的具体机会。
数众多或多其配件的职等自动更新。
随着价格的变化,这项任务本来会引起恶意。 例如,在日本财团,你可以有4个关于该指标的事例。
图谋: 每0.01 每隔100英尺长。 每种价格以每隔0.0075年关闭25个酒吧。 每种价格以50英尺的长度为准。 每种价格在0.0025年关闭,时间为25个酒吧。 这种做法将类似于一个规则者,你可以看到这一非常例子。
屏幕。 此外,你可以确定不同的肤色和线风格。
这使视觉程度更加容易。
FREE

!!!在 [CodeBase] 中,我发布了 Mql4 指标代码。免费下载代码!!! (您必须在更新终端时调整代码)。
该指标是交易者的工具。它显示了所有周期和符号上的随机指标的运动:М1, М5, М15, М30, Н1, Н4 每分钟(从当前到 -240 分钟的时间尺度,即过去 4 小时)。
Step_Stoch 克服了随机指标的缺点——滞后。例如,在 H1(或 M30)下跌后的上升可以在 H1 的 60 分钟后或 M30 的 30 分钟后在通常的随机指标上看到。该指示器会在一分钟内显示此信息,让您获得更好的结果。
您可以将所有随机指标组合在一起并分析它们的走势,以立即做出最佳交易决策,这可能会导致在关闭交易时损失利润或延迟开盘,此时利润(大部分)的可能性已经丧失. Step_Stoch 线可帮助您更快地看到趋势反转过程的开始。
该指标会自动调整为 4 位和 5 位报价、屏幕 DPI、图表的时间刻度。
输入值
KPeriod, DPeriod, Slowing, Mode_, - 标准随机参数。
ColorBack - 背
FREE

"SOLVE ALL YOUR PROBLEMS FOREVER WITH THIS UNIQUE TRADING SYSTEM!" Buy Trend Reversing PRO Indicator And You Will Get Forex Trend Commander Indicator for FREE !
The one who makes money from the forex market, wins by doing something very simple, he wins 6 out of every 10 trades. Of course for this you need a good indicator and proper money management if you ever hope to become a profitable trader. Anyone who doesn't do so ALWAYS ends up empty handed! Because, I'll say it again: "Traders who don

McS Super Trend -This is one of the most popular classic trend indicators. It has a simple setting, allows you to work not only with the trend, but also displays the stop loss level, which is calculated by this indicator. Benefits:
Instruments: Currency pairs , stocks, commodities, indices, cryptocurrencies. Timeframe: М15 and higher. Trading time: Around the clock. Shows the direction of the current trend. Calculates the stop loss. It can be used when working with trading. Three types of no
FREE

隆重推出 Auto Trendline,这是一种创新的 MT4 指标,可自动
在您的图表上绘制趋势线。告别繁琐且耗时的手动绘制趋势线任务,
让 Auto Trendline 为您完成这项工作!
*购买后联系我向您发送 说明和分步指南。
凭借其先进的算法,Auto Trendline 会自动检测并为您绘制趋势线,
从而节省您的时间和精力。只需将指标附加到您的图表,并观察它根据价格行为的高点和低点识别和绘制趋势线。 Auto Trendline 是高度可定制的,允许您调整指标的灵敏度以适合您的交易风格和偏好。
您还可以选择不同的线条样式和颜色,甚至可以设置警报以在趋势线被打破时通知您。 无论您是初学者还是经验丰富的交易者,自动趋势线都是识别和分析任何市场趋势的重要工具。
凭借其友好的用户界面和高级功能,该指标一定会提升您的交易体验并帮助您做出更明智的交易决策。 主要特征:
自动绘制趋势线 高度可定制的灵敏度设置 多种线条样式和颜色 破损趋势线的警报通知 用户友好的界面 立即试用自动趋势线,发现自动趋势线分析的好处! 相关产品 : Auto Trend

Obie 1M Scalper Metatrader 4 Forex Robot 是一款利用 13 条移动平均线的自动外汇交易软件。
从本质上讲,它使用多个移动平均线来制定扫描市场以获取买卖交易信号的逻辑,可确保此类警报越来越准确。
顾名思义,这是一种剥头皮算法,在 1 分钟时间范围内对主要外汇货币对(如英镑/美元、欧元/美元、美元/瑞士法郎、美元/加元等)以及上市股票表现最佳 在纳斯达克。
交易此自动交易系统所涉及的风险是点差。
因此,1 分钟剥头皮专家顾问应仅部署在点差相对较小的外汇对上,例如 EUR/USD、USD/JPY 和 GBP/USD。
策略测试报告 在 1 分钟图表上的 GBP/USD 外汇对的 1 分钟黄牛外汇机器人策略测试报告下方找到。
整体表现 EA 从总共 13 笔交易中获得了 605.44 美元的总利润。 最大的盈利交易产生了 357.27 美元的利润,而最大的亏损交易产生了 0.00 美元的损失。
统计数据: 测试中的柱线:建模的 8519 个刻度
初始存款:10000.00 美元
净利润总额:605.44 美元
总
FREE

该指标显示其他(和非标准)时间范围的最高价/最低价/开盘价/收盘价 - 年、6 个月、4 个月、3 个月、2 个月、月、周、日、H3-H6-H8-H12 小时 。 您还可以设置打开蜡烛的班次并构建虚拟蜡烛。 这些时间范围之一的“周期分隔符”以垂直线的形式提供。 可以针对当前或先前水平的突破(突破昨天/上周的高点/低点等)配置警报。 您还可以将所有级别向右移动一个周期。 也就是说,当前周期将显示前一周期的最高价/最低价。
参数 Number of levels to calculate (0-all) — 屏幕上将显示多少条。 Change the opening of bars (hours) — 将蜡烛的开盘移动 n 小时。 该指标将根据新的开盘时间绘制虚拟柱。 MN1 以上的周期不会改变。 Move the levels to the right — 将所有级别向右移动一格。 您将看到当前蜡烛的先前水平。 Period Separator (vertical lines) — 显示垂直线、周期分隔符。 Show High Lines (trigger for all
IntradaySignals Intraday Signals is a visual and effective semi-automatic trading system, that: generates possible entry points to open BUY and SELL trades; displays recommended Take Profit and Stop Loss; displays current profit on open trade; displays current spread. The profitability of the indicator is shown in the screenshot on the example of the GBPUSD pair Does not redraw and works on opening bar. Time frames - M1-H1. Recommended TimeFrame-M5-M15. Signals are produced based on the used
FREE

This is an indicator detecting trend direction. It uses the popular Bill Williams Alligator. It shows market state on all timeframes on one chart. As is well known, traders gain the main profit on the Forex market trading by trend, and losses usually occur when the market is flat. So, in order to gain profit a trader should learn to detect trend market and direction of a current trend in a rapid manner. This indicator has been developed for this purpose. MTF Alligator helps to: Profitably trade
FREE

商品通道指数 (CCI) 指标的多货币和多时间框架修改。 您可以在参数中指定任何所需的货币和时间范围。 此外,该面板还可以在跨越超买和超卖水平时发送通知。 通过单击带有句点的单元格,将打开该符号和句点。 这是 MTF 扫描仪。
默认情况下,从图表中隐藏仪表板的键是“D”。
参数 CCI Period — 平均周期。 CCI Applied price — 价格类型。 Clear the chart at startup — 启动时清除图表。 Set of Pairs — 符号集 — Market Watch — 来自“市场观察”的货币对; — Specified manually — 在参数“Pairs”中手动指定对。 — Current pair — 当前对。 Pairs (separated by a space or semicolon) — 由空格或分号分隔的符号列表。 货币名称的书写方式应与经纪商的名称完全相同,并保留大小写和前缀/后缀。 Time Frames (separated by a space or semicolon) — 由空格或分号分隔的时

iCUSTOM INDICATOR TESTER是CODERS的工具,但不仅限于此。 即使您没有.mq4文件的源代码,而只有编译后的.ex4文件,即使或特别是它,该程序也设计用于测试和检查自定义指标。
交易者可能会测试指标,并查看其想法是否与指标数据相关联-如果该想法是真的计算出来的,以及是否有可能基于此特定指标创建EA。 它可以节省开发人员和交易者的时间。
请在指标的名称字段中输入指标的名称,然后将.ex4指标文件放入指标文件夹。
程序将显示前64个缓冲器的当前值。
如果BUFFER值始终恒定为零,则该BUFFER可能无效。 //////////////////////////////////////////////////////////////////////////////////////////////////////////
FREE

目的:
该指标的功能是在主要的MT4价格图表上绘制3条移动平均线。
MA来自用户指定的3个不同的时间范围,与当前显示的图表无关。
当您在不同的时间范围内切换图表视图时,3个MA将继续显示属性中指定的时间范围的MA线。
例:
默认设置为H4,D1和W1时间帧绘制了三个50条的MA。 在M5 / M15的日内交易期间,默认设置(H4,D1,W1的MA50)可以帮助您发现较高时间范围的“硬”支撑/阻力。
好处:
始终可以在3个不同的时间范围内对所有三个MA进行可视访问,可以更好地指导您进行交易。
目的:
该指标的功能是在主要的MT4价格图表上绘制3条移动平均线。
MA来自用户指定的3个不同的时间范围,与当前显示的图表无关。
当您在不同的时间范围内切换图表视图时,3个MA将继续显示属性中指定的时间范围的MA线。
例:
默认设置为H4,D1和W1时间帧绘制了三个50条的MA。 在M5 / M15的日内交易期间,默认设置(H4,D1,W1的MA50)可以帮助您发现较高时间范围的“硬”支撑/阻力。
好处:
始终可以在3个不同的时间范围内对
FREE

VArmadA的平衡输入
一个简单而强大的基于分形的支撑/阻力指标。
适用于1h及以上时间段,并对所有主要货币对进行测试。请注意信号。箭头表示多头或空头进入。
它是如何工作的。
箭头表示反向支撑/阻力。向上的箭头表示做多-向下的箭头表示做空交易。
操作说明:指标多头/指标空头
- 指标多头/指标空头:选择给定指标箭头的颜色。
- 显示阻力位。可视化用于确定进入信号的阻力位。
- 显示支撑位。可视化用于确定进入信号的支撑位。
..................................................................................................
FREE

该指标的目的在于在您的交易图表上可视化表示唐奇安通道。唐奇安通道是一种直观的技术工具,用于描述特定时期内的最高高点和最低低点之间的范围。此指标增强了价格运动的视觉分析,为潜在的突破和趋势延续点提供了洞察力。唐奇安通道可以应用于当前时间框架和更高的时间框架,如果您选择启用该选项的话。 指标的主要特点: Use_System_Visuals:此参数允许您在使用系统视觉样式和自定义指标外观之间进行切换。当激活时,指标的视觉元素将与您的交易平台整体主题相匹配。 Signal_from_HT_Timeframe:启用此选项允许您从更高的时间框架接收信号。换句话说,您可以考虑在更长的时间框架上观察唐奇安通道的行为,以影响您在当前时间框架上的交易决策。 HT_Timeframe:当激活Signal_from_HT_Timeframe时,此参数允许您选择更高的时间框架,从中您希望接收信号。比较唐奇安通道在不同时间框架上的行为可以为交易决策提供有价值的背景。 Period:此参数定义计算唐奇安通道的时期。它确定用于建立通道上限和下限的条形或蜡烛数量。 Down_Side和Up_Side:这些参数允许您为
FREE

A signal indicator consisting of several well-known indicators that process data sequentially. 2 options - for schedule and basement. In the settings it is possible to enable alerts about the change of trend (alerts) sound, by e-mail and push. It is possible to change the colors and thickness of the lines, the colors and codes of the arrows, the number of calculation bars and separately configure the parameters included in the indicators.
FREE

Tarantula is a trend Expert Advisor that looks for entry points based on the standard Moving Average indicator. It works with two timeframes selected in the settings. The EA looks for the points of trend change and opens an order when the signal matches on different timeframes. All orders are protected by stop loss. However almost all orders are closed by the EA on a signal change.
Parameters SL - stop loss. TP - take profit. OnWork_1 - enable/disable searching for signals on the first timefra
FREE

AD Trend line draws trend lines on the basis of A/D indicator (Accumulation/Distribution). When A/D indicator breaks a trend line, the probability of the trend reversal is very high. This is a multitimeframe indicator which can display values from higher timeframes. Parameters Time-frame — Select a timeframe; zero is the current timeframe of the chart; Trend Line — Display lines on the chart; Apply to — Apply lines to close the candle's highest/lowest value; Width line — Width of the line; Style
FREE

About Waddah Multimeter (free): This product is based on the WAExplosion Indicator. It helps identify explosive market trends and potential trading opportunities. Waddah Multi-meter (Multi-timeframe) Check out the detailed product post here for scanner and multimeter both: https://www.mql5.com/en/blogs/post/758020
Please note that scanner is paid and multimeter is free.
Features: Waddah Trend Direction Trend Strength (above/below explosion line or deadzone) Trend Explosion Alert Alignment al
FREE

EMA Separation plots 2 exponential moving averages, and a fill between them. The fill is colored differently according to an uptrend (short period EMA above long period EMA), or a downtrend (short period EMA below long period EMA). This is a small tool to help visualize the difference between long and short period averages. We hope you enjoy! EMA Separation can also be paired with our free EMA Separation Coefficient
Parameters Short period (Default=10): # bars used to calculate short period EM
FREE

Multi timeframe fractal indicator which shows the higher timeframe's fractal point on lower timeframes.
Parameters Fractal_Timeframe : You can set the higher timeframes for fractals. Maxbar : You can set the maximum number of candles for the calculations. Up_Fractal_Color, Up_Fractal_Symbol, Down_Fractal_Color, Down_Fractal_Symbol : Color and style settings of the fractal points. Extend_Line : Draws a horizontal line from the previous fractal point until a candle closes it over or a user-speci
FREE

The Tmcd is a very smooth oscillator and a good indicator of trend. It has a noise filter built in which shows sideways markets and it can also show the beginning of a trend. It works on any symbol from Forex to commodities as well as crypto currencies. It does not require a change of settings. The default settings are fine. The use of it can be varied and I recommend it is be used in conjunction with other indicators. The indicator is free for use and your review will be appreciated.
Join my
FREE

Overview Automated smart money market structure identification following smart money concept and inner circle trader concept, it gives an unprecedented edge on your smart money and market structure analysis by automatically identifies valid market structure using smart money concept: Identify impulsive and corrective moves Identify valid pullbacks built by impulsive and corrective market moves Idenitfy bearish or bullish leg and their inducements for smart money concept Identify valid market st

这个全自动的外汇机器人可以直接进行交易。
您可以在任何时间框架和ANT PAIR上使用它。
这款全自动机器人也适用于美分账户。
如果您在更多的图表上使用该机器人,请每次更改魔法数字。
该机器人有更多的选择。
=> 利润关闭
=> 获利
=> 以相反信号止损退出
=> 如果你的余额增加,就增加手数。
=> 马丁格尔选项
=> 追踪你的利润
祝愿每一个喜欢机器人的人都能获得最大的成功。请负责任的交易。
谢谢大家 这个全自动的外汇机器人可以直接进行交易。
您可以在任何时间框架和ANT PAIR上使用它。
这款全自动机器人也适用于美分账户。
如果您在更多的图表上使用该机器人,请每次更改魔法数字。
该机器人有更多的选择。
=> 利润关闭
=> 获利
=> 以相反信号止损退出
=> 如果你的余额增加,就增加手数。
=> 马丁格尔选项
=> 追踪你的利润
祝愿每一个喜欢机器人的人都能获得最大的成功。请负责任的交易。
谢谢大家

This indicator identifies short-term, medium-term and long-term highs and lows of the market according to the method described by Larry Williams in the book "Long-term secrets to short-term trading".
Brief description of the principle of identifying the market highs and lows A short-term high is a high of a bar with lower highs on either side of it, and, conversely, a short-term low of a bar is a low with higher lows on either side of it. Medium-term highs and lows are determined similarly: a
FREE

The recommended timeframe is H1!
The indicator has two kinds of signal.
This is a signal to open a position from the appearance of an arrow. The price leaves the channel In the first case, the indicator builds arrows based on the constructed channel and Bollinger Bands years.
In another case, the trader can trade if the price just went beyond the channel. If the price is higher than the channel - we sell. If the price is lower than the channel, then you can look for a place to buy.
It ca
FREE

The Expert Advisor is fully automated, trades in all sessions (full-time), using a strategy based on candlestick patterns: Bullish Patterns: Reversal Composite Candles (similar to the Hammer pattern, but it uses the composite candle instead the single candle), Three White Soldiers, Piercing Line, Morning Doji, Engulfing, Harami, Morning Star, Hammer and Meeting Lines; Bearish Patterns: Reversal Composite Candles (similar to the Hanging Man pattern, but it uses the composite candle instead the
A free program for copying orders between terminals on the same computer.
Any orders are copied in any direction, between any accounts.
The principle of operation:
On the terminal from which you want to copy, the "Server" parameter is set. On the terminal or terminals where the copied positions need to be opened, the "Client" parameter is set. It is also necessary to enter the account number of the "Server" terminal on the client.
In the future, it is planned to increase the functiona
FREE

H I G H - P R O B A B I L I T Y - B R E A K O U T T R E N D L I N E I N D I C A T O R This is no ordinary trendline indicator. It has a highly-probability algorithms incorporated in the script to display only trendlines that may give a very high chance of price breakout. The indicator is not a stand alone indicator. Trader should interpret it together with their very own analysis technique to come up with a more efficient trading strategy. You can use with it other trend indic
FREE

僅限股票(差價合約)的日間交易。 交易需要工作。 沒有捷徑或指標可以告訴您所有的進入和退出。 利潤來自心態。 指標是與資金管理和成功心理學結合使用的工具。 查找音量配置文件中的不平衡。 貿易價格量不平衡。 許多不平衡發生在收盤、開盤和新聞中。 查看股票中的買家與賣家。 使用 5 分鐘到 1 小時來查看誰可以控制價格並發現價格不平衡。 更大的股票是 15 分鐘及以上。 將鼠標懸停在顏色音量條上以查看過去條的數量。 當前條形圖的音量寫在右上角。 找出交易量的不平衡,看看價格在一段時間內可能走向何方。 跟隨主導趨勢以獲得最佳結果 如果趨勢發展尋找交易趨勢。 使用追踪止損並留意大量反轉不平衡。 交易 Apple、SPY、GOOLE、TESLA。 所有你最喜歡的股票

There are time periods in the market, when trading is highly likely to be unprofitable. This indicator warns you about such non-trading situations and helps you preserve your money and time.
Parameters Remind about non-trading periods: Expiration week - remind about the expiration week Consumer index day - remind a day before the release of Consumer index day NON FARM - remind a day before the release of NON FARM Christmas - remind a day before Christmas New Year Days 25.12 - 15.01 - remind ab
FREE

Unlock Your Trading Potential with Our Smart and Advanced EA!
Unleash the power of our high-tech Expert Advisors to refine your trading strategy and supercharge your overall performance. Witness maximum profit potential and minimized risks. Our EAs seamlessly integrate with various account types and trading platforms. Enjoy the flexibility to incorporate our EA into your existing strategy without any hassle.
Tap into the potential of artificial intelligence for market analysis. Our EAs c
FREE

This indicator is based on the ADX indicator and indicates the trend very easily.
You can customize the indicator to your needs: ADXPeriod ADXSignal_Level BarWidth CandleWith HeikenAshi
The Adx color candles indicator is fully FREE and compatible with the other part of the system; the Acc arrow >>>> https://www.mql5.com/en/market/product/33770 ENJOY and check out my other indicator: https://www.mql5.com/en/market/product/32111
FREE
Price Ray indicator is a utility that will improve the way you trade. Primarily, it shows the Bid, Ask or Last price as a line ray which beams till the current candle, last visible chart candle or extended to all candle bars. The enhanced features in this indicator provide information in an area where you focus most, right next to the current candle. You can select text to be shown above or below the Price ray. The indicator is fully customizable, allowing it to fit any strategy requirements. Th
FREE

Telegram Notifier is a simple and powerful utility which sends notification, news from MT4 to Telegram channel and group. Official Telegram Group: https://t.me/ezforex_telegram_notifier WHO WILL NEED THIS UTILITY 1. EA Sellers who want to manage automatically their private channel and chat group.
2. Signal Providers who want to send the signals, reports and news to the channel or chat group. CORE FEATURES
1. Can use with View Account and not need to enable the Auto Trading button.
2. Track

Contact us for any custom order, CodeYourTrade.com . The main use of Straddle EA is to trade at the major fundamental news events. It opens 2 pending orders Buy Stop and Sell Stop to capture the market single direction movements at the time of news. The EA will run from "News Time – Seconds before News Time" to "Expiration Time". These are the sequence of states in the EA: Waiting : Before "News Time – Seconds before News Time". The EA is waiting to start. Passed : The EA started and trade ex

此EA是一个 高频交易系统 ,只在市场波动剧烈时进行交易。通过运用独特的技术指标,检测市场的短期波动,在价格形成突破时入场,并在几秒内抓住几个点迅速离场。每一个挂单都有内在止损,每一个已成交的单子有移动止损进行保护。 请注意,此EA的实盘表现严重依赖于对 经纪商 和 VPS 的选择。 推荐在一个真正的ECN经纪商开户,经纪商必须要有最低的点差,最小的手续费和最快的执行速度。 推荐在mql5.com上租赁 VPS ,把和服务器间的通讯延迟降低到0~2毫秒。 推荐在这些货币对上使用: EURUSD GBPUSD USDJPY EURGBP 。 推荐在 M1 周期上使用。 信号: https://www.mql5.com/en/signals/author/oodd008 回测: https://www.mql5.com/en/users/oodd008/blog
Parameters Lots - 使用固定手数 Risk - 根据账户净值自动计算手数,只有当Lots是0时才有效 EA_Comment - 设置自己的评论信息 MAGIC - Magic数字,无需更改 Max_Spre

Search for an entry with low risk for trading by Lisek Waves Indicator. Using Lisek Waves Indicator can improve your trading performance. In it’s simplest form, this trading tool make it easy to s earch for an entry with low risk and to manage your trade and risk. Lisek Wave analysis is based on the notion that markets follow specific patterns called waves which are the result of a natural rhythm of crowd psychology that exists in all markets. You can avoid the loss from taking trades that are
FREE

The purpose of this new version of the MT4 standard indicator provided in your platform is to display in a sub-window multiple timeframes of the same indicator. See the example shown in the picture below. But the display isn’t like a simple MTF indicator. This is the real display of the indicator on its timeframe. Here's the options available in the FFx indicator: Select the timeframes to be displayed (M1 to Monthly) Define the width (number of bars) for each timeframe box Alert pop up/sound/ema
FREE

This oscillator has become one of the main tools of most professional traders. The indicator includes a classical MACD ( Moving Average Convergence/Divergence ) line, a signal line, as well as a MACD histogram. Exponential moving averages are used in the calculation. The indicator also provides the ability to enable signals on identification of divergences between the price graph and the indicator. Divergences are identified using three patterns: classic, hidden and extended divergences.
Indic
FREE

Информационная панель, которая выставляет уровни покупки продажи и цели для профита на текущий день. Уровни рисуются согласно движению валюты за вчерашний день. Панель вмещает в себя информацию о валютной паре, тенденции на рынке, время до закрытия бара, управление капиталом, рекомендуемый лот, профит в пунктах, а также уровни для покупки и продажи инструмента. Для заключения сделок использовать только отложенные ордера на пробой. Входные параметры Lots - установить текущий лот Risk - риск в про
FREE
The Price Line Alert Indicator will allow you to set price level that will alert you when hit, the price level will be shown in the chart as lines. Useful to get notified at specific prices, support, resistance, round numbers and so forth. If you want to a similar utility that will automatically close your position at a specific price check https://www.mql5.com/en/market/product/23113
How does it work? You can set several Price Lines and configured them to notify you if the price goes above or
FREE

The indicator looks for market Highs and Lows. They are defined by fractals, i.e. the market creates the indicator algorithm and structure, unlike ZigZag having a rigid algorithm that affects the final result. This indicator provides a different view of the price series and detects patterns that are difficult to find on standard charts and timeframes. The indicator does not repaint but works with a small delay. The first fractal level is based on the price, the second fractal level is based on t
FREE

This indicator signals about crossing of the main and the signal lines of stochastic (lower stochastic) in the trend direction which is determined by two stochastics of higher time frames (higher stochastics). It is not a secret that stochastic generates accurate signals in a flat market and a lot of false signals in a protracted trend. A combination of two stochastics of higher time frames performs a good filtration of false signals and shows the main tendency. The indicator is recommended for
FREE

Introduction
Virtual Money Flow free - Lightweight free trading robot based on Money Flow index. Orders set with ISL and take profit is virtual. Equipped with trailing stop and limited money management. How to? Any account type,leverage and time frame Works only on currency pair EURUSD, optimizations needed in regualar intervals You can start with as low as $20-50 based on leverage 500 This is not a scalper and trades can therefore be less frequent, be patient! Limited contract size
FREE

你好! 我是日本散户投资者Tatsuron。 我们在外汇管理超过10亿日元。 因此,让我介绍一个我使用的非常有用的指标。
該指標是市場價格的基礎。
ThreeLine改進了移動平均線(SMA),以應對長期SMA數值設置。
您重複進行每日交易和驗證的次數越多,“三線”將越可信。
如果ThreeLine的角度向上,它將為白色。 如果面朝下,則為每種顏色。
由於很容易理解是提高還是降低市場,因此您可以一目了然地檢查市場環境。
長期移動平均線(SMA)值應如何設置?
您將免於此類麻煩。
尋找突破方法和應對趨勢很容易。
SMA,也是交易和指標的基礎,留給這條三線線。
请检查实际运行的指示器的视频。 两种趋势在1:12左右开始。
The indicator that is the basis of the market price. ThreeLine has improved the Moving Average (SMA) to answer the long-term SMA numerical settings. The more yo
FREE
MetaTrader市场是一个简单方便的网站,在这里开发者可以出售自己的交易应用程序。
我们将帮助您发布您的产品,并向您解释如何为市场准备您的产品描述。市场上所有的应用程序都是加密保护并且只能在买家的电脑上运行。非法拷贝是不可能的。
您错过了交易机会:
- 免费交易应用程序
- 8,000+信号可供复制
- 探索金融市场的经济新闻
注册
登录