适用于MetaTrader 4的EA交易和指标 - 93

Forex trend has always been a friend of traders, and trend indicators help determine the trend and make the right decisions. Most of the trading systems developed by trading gurus are based on the trend.
It is best used on timeframes above the M30, from the beginning of the London session to America.
It should be remembered that there are no indicators that are not wrong. Any strategy requires confirmation of its signals. When building your own system, it is recommended to use several indicat
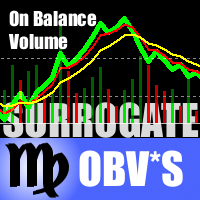
This is a special edition of the On-Balance Volume indicator based on pseudo-real volumes emulated from tick volumes. It calculates a near to real estimation of trade volumes distribution for Forex instruments (where only tick volumes are available) and then applies conventional OBV formula to them. Volumes are calculated by the same algorithm that's used in the indicator TrueVolumeSurrogate . The indicator itself is not required but can be used for reference.
Parameters MAfast - fast moving av
Advanced ADX indicator that allows operating on many timeframes simultaneously! Unique indicator with the ability to display ADX charts not only on the current timeframe, but also on higher ones. The example attached shows how it is possible to see 3 ADX chart on M5, M15 and M30 timeframes respectively. This functionality allows to significantly improve the accuracy of determining the trend. The Timeframe Delta parameter specifies how much the indicator’s timeframe should be different from the t

This indicator is designed for M1 time frame and shows 2 lines: Sum of Points when the price goes up divided on Sum of Ticks when the price goes up (Aqua color). Sum of Points when the price goes down divided on Sum of Ticks when the price goes down (Orange color). You will see all major data as a comment in the left upper corner of the chart. Keep in mind that Sum of Points will be greater or equal to Sum of Ticks. Of course, the ATT is calculating all ticks forward only, beginning from the tim

Provides the simplicity of binary options but addresses the shortcomings of regular binary options, namely: Poor risk reward ratio, fixed duration trades, poor broker choice, poor indicators/alerts, no hidden (stealth) stop loss/take profit, etc.
Features 1 to 1 risk reward ratio, calculated automatically (configurable) Manual (with alert) or automatic trade entry (on alert conditions) Lot size calculation (money management) - based on % of account to risk or fixed amount Compact interactive on

Pending Orders Grid Complete System opens any combination of Buy Stop, Sell Stop, Buy Limit and Sell Limit pending orders and closes all existing pending orders. You will have a possibility to put a legitimate Open Price for the first position in the grid. Usually it should in the area of Support/Resistance lines. You just need to drop this script on the chart of a desired currency pair.
Input Parameters Before placing all pending orders, the input window is opened allowing you to modify all in
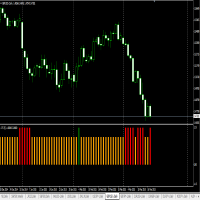
This is an indicator for finding the strongest trend each day, suitable for intraday trading or a swing trading. See the live performance at : https://www.mql5.com/en/signals/93383
How to Use: RED BAR means Bearish Trend for the next candle GREEN BAR means Bullish Trend for the next candle ORANGE BAR means Sideways Trend for the next candle
Example:
If we are using D1 timeframe, see the last BAR, if the bar is RED BAR, open short/sell for today. If we are using H1 timeframe, see the last BAR,
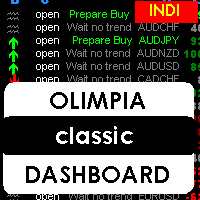
This indicator is a multipairs dashboard which recognizes the best pair setup to open orders with 8 families of currencies. Families of currencies include: AUD, USD, EUR, GBP, CAD, NZD, CHF, JPY; 28 pairs in total. The precise moment to open an order is shown at Column A on the dashboard, you can also setup alerts, e-mails and notification to mobile devices. You can filter alerts by spread value of pairs.
What is the dashboard showing? RED values mean short trends, GREEN values mean long trends

This is an indicator for additional signal filtering. It can be used as an additional filter in a trading system. The indicator does not redraw its data and can be used both in forex trading and with binary options. It has 3 operation modes and flexible sensitivity settings. The indicator uses multiple buffers, therefore it can be easily used in various Expert Advisors.

The indicator is designed for visual determining market directions. It allows to determine the distance from a price and helps in drawing correct conclusions. Perfectly defines flat zones, horizontal intraday trends and trend movements, and an additional setting allows to use the indicator on any instrument. Does not redraw its readings. You get professional trading indicator for a reasonable price.
Settings: Period_FF = 7 - indicator period Sensitivity_FF = 5 - sensitivity in % Wish you all su
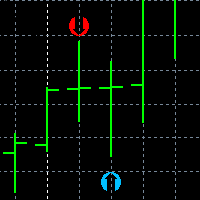
Openpip is a scalper Expert Advisor to be used on low-spread accounts (mainly for ECN accounts or for zero-spread accounts). The Expert Advisor includes a limit on the size of the spread, with which positions are opened. Contains trailing stop functions (hidden mode is used, when the stop loss is invisible to the broker) and averaging functions, which can optionally be disabled. Openpip executes a huge amount of deals, which has a positive effect on rebates . Deal opening algorithm is based on t

Fibolopes (converted from Envelopes) Indicator is based on the Fibonacci sequence. The input parameter FiboNumPeriod is responsible for the number in the integer sequence (0, 1, 1, 2, 3, 5. 8 13, 34, 55, 89...) The indicator will calculate the Main Yellow dot line and 2 bands as a +/- Deviation to it. This indicator is calculating a ZigZag (Aqua line) which combine with Fibolopes together form a system signals for Open (Z crossing Fibolopes) a new position and Close (Z crossing Fibolopes in oppo

A portfolio night scalper for Canadian dollar instruments: AUDCAD, EURCAD, GBPCAD, CADJPY, CADJPY, CADCHF, USDCAD. Timeframe - M15.
Parameters Orders_Comment - comment to orders opened by the EA. Lot_Size - fixed lot size if Auto_MM = 0. Auto_MM - percent of equity to be used in trading. If Auto_MM = 0, it will use a fixed lot. Magic_Number - unique number of orders (set different values for each trading symbol). Start_Time - the EA's operation start hour (default is 00.00; we do not recommend

The purpose of the indicator is drawing an equidistant channel. It is somewhat different from the traditional model. The choice of control parameters is simple and does not require any special description. Enter the calculation interval in hours and the solution to the problem will appear on the screen. Please note that the time involved in calculation of the channel must be greater than the timeframe it will be displayed on. If the parameters you enter are beyond the allowable limits, you will

Marcus = market customization is 3 in 1 indicator. Universal business tool from professional traders that helps visualizing interesting market situations. Preview markets using price action and sentiment in the market. Three tools necessary to understand the market situation and the anticipation of further movement. Finally, you will see what parquet traders see. With these tools, you will see the important supports and resistances. It shows you the entry of big players on the market. The indica

The indicator colors bars displaying prices of overbought and oversold areas on the chart. It will help you to estimate moments when market climate changes and the price has its local extreme values. It can be used both independently and as a good supplement to any channel trading system. And this indicator is easy-to-use in expert advisors due to usage of indicator buffers instead of graphical objects. Settings ExtPeriod = 100 — indicator period; Sensitivity = 80 — indicator sensitivity.
Purpose The indicator is intended for manual multi-currency trading based on the Triple Screen Strategy. It works with any symbols located in the Market Watch window of the MT4: currencies, metals, indexes, etc. The number of instruments can be limited by capacity of the МТ4's parameters. But if desired, you can create several windows with various set of instruments and parameters.
Operation Principle The indicator uses the modified Triple Screen Strategy for determining trend direction in the

Индикатор Форекс LTT Range System показывает на графике средние диапазоны движения рыночной цены за периоды M 15, H 1, H 4, D 1, W 1, MN 1. Верхняя и нижняя границы диапазонов рассчитываются от цены открытия бара. Пивот – середина между ценой открытия бара и границей диапазона: если рыночная цена находится выше цены открытия бара – метка пивота располагается между ценой открытия бара и верхней меткой диапазона, если рыночная цена находится ниже цены открытия бара – метка пивота располагается ме

Take Your Trading Experience To the Next Level ! and get the exclusive TFSR-Analyzer for free ! So you have all these outstanding features on up to 20 symbols and all timeframes in a smart and clear Design.
Correct identification of the trends in stock investments are pivotal and TrendFollowerSR ensures this perspective while displaying the correct trend on multiply timeframes to help you go long way as much as possible. The latest technology of the Indicator enables to track whether if a

This indicator shows an Up trend (Green square) if a fast MA is above a slow MA and Down trend (Red square) if a fast MA is below a slow MA from all Time Frames for each currency pair. Input parameters: From Symb1 to Symb9. - You may change any of this Symbol to any legal currency pair existed on your platform. Period_Fast = 5; Method_Fast = MODE_EMA; Price_Fast = PRICE_CLOSE; Period_Slow = 21; Method_Slow = MODE_SMA; Price_Slow = PRICE_TYPICAL; Attention: Before using this indicator you have t

The Advanced SovPattern is a multi-currency robot which trades on M30.
Trade Strategy: This EA tests and reveals market changes. Then it uses mathematical analysis to discover patterns and adjusts to changing trading conditions. It allows this EA to work without time restrictions regardless any changes of the market. The EA is based on our study of regular currencies behavior on the market depending on opening of trading sessions. It automatically places buy or sell orders at the better moment

We have published new software , Call "Close All Trade At Time"
More powerful , Easy & Customizable to close all trades and pending orders automatically at specific time. Please visit : https://www.mql5.com/en/market/product/37780
Delete pending order at time. An simple tools for delete all pending orders automatically at specific time each day. Just drag this EA into any chart any currency. It will automatic delete pending orders at time,days from your setting.
Input Parameters
1. Al

Olimpia Dragged Trends! This dashboard indicator is a visual tool which recognizes dragged trends of 28 pairs in a easy-to-read histogram. You will see a group of squares indicating the sum and average values of trends of the last "...." minutes for each square from L to A in a dragged way. "Dragged Way" means that regardless the hour of the day or opened or closed candle it always shows the present and the pastinformation. You can configure a sequence of numbers with values between 1 minute to
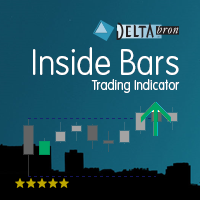
The Inside Bars indicator shows Inside Bars, the Breakout Zone and Breakouts thereof. Inside Bars are an important price action pattern. The price action of an Inside Bar is completely covered by the price action of the previous bar. Inside Bars are most often used on higher timeframes. Settings Inside Bars default settings are good enough most of the time. Feel free to fine tune them to your needs. ATR factor to skip large candles - very large candles should be filtered as they often cover othe
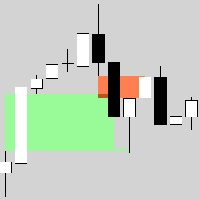
Hidden123Gap (123Gap) is universal business tool from the professional traders that helps to visualize market situation. It previews markets using a price action and a sentiment in the market. The tool is necessary to understand the market situation and the anticipation of further movement. Finally, you will see how traders estimate the market. With this tool, you will see important supports and resistances. It shows you the entry of big players on the market. The indicator works on all timefram
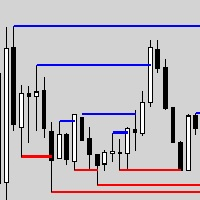
PivotHighLow. Universal business tool from professional traders that helps to visualize interest market situations. It previews markets using a price action and sentiment in the market. Tool is necessary to understand the market situation and the anticipation of further movement. Finally, you will see how traders estimate the market. With this tool, you will see important supports and resistances. It shows you the entry of big players on the market. The indicator works on all timeframes. You are
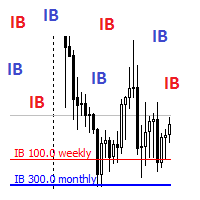
InitialBalance. Universal business tool from professional traders that helps to visualize interest market situations. It previews markets using a price action and sentiment in the market. Tool necessary to understand the market situation and the anticipation of further movement. Finally, you will see how traders estimate the market. Who knows the first steps in the market can estimate the point where the market will stop and reflect! With this tool, you will see important supports and resistance

This indicator shows data from 9 currency pairs by your choice for all 9 Time Frames. If a digital value of the RSI is less or equal to DnLevel = 30 (or whatever number you decided to put) then a Green square will appear. This is potentially an oversold condition and maybe a good time to go Long. If a digital value of the RSI is greater or equal to UpLevel = 70 (or whatever number you decided to put) then a Red square will appear. This is potentially an overbought condition and maybe a good time

This indicator shows an Up trend ( Green square ) if a parabolic SAR value is below the current price, and Down trend ( Red square ) if a parabolic SAR value is above the current price from all Time Frame for each currency pairs. Input parameters from Symb1 to Symb9 — You may change any of these Symbols to any legal currency pair existed on your platform. step=0.0; — Represents the acceleration factor for PSAR indicator. maximum=0.2; — Maximum value for the acceleration factor for PSAR indicator

使用 WolfeWaveBuilder 指标加入交易! 这是专门为获得最成功和最有利可图的投资决策而创建的独特工具。 它是真实账户的理想选择,并受益于经过全面测试和几乎有保证的交易策略。 不要错过你的机会! 开始使用 WolfeWaveBuilder 指标赚钱交易!
MT5版本 https://www.mql5.com/ru/market/product/82360
指标特点
为 Wolfe Waves 策略提供信号。 显示趋势。 自 1980 年以来一直使用的行之有效的策略! 简单的进入信号。 不重绘也不滞后。 有声音信号,E-Mail 和电话上的通知。
操作说明
等到箭头出现,终端中出现消息或通知邮件,电话。 你打开一个交易。 建议在价格越过 1-4 线时出场。 为了更好地理解策略,建议阅读理论。
基本设置
High_period - 用于计算高周期模型的最小柱数 Low_period - 用于计算低周期模型的最小柱数 Trigger_Sens - 计算分形的最小柱数

Bull Bear Powers indicator shows the absolute power of bulls and bears in the market. Both powers are shown simultaneously with red and green colors for bear and bull powers respectively. When red line goes over the green line it means that bears are controlling the market. When green line goes over the red line it means that bulls are controlling the market. The green/red horizontal symbol line at the bottom of the indicators shows which party has more strength. Time Frame: M30 and H1 are recom

This indicator is designed for drawing equidistant channels. Two options are available: based on the number of hours in the indicator calculation and by the number of bars. To draw a channel, enter a number 1 or greater. The maximum value is limited by the amount of visible bars. If the parameters you enter are beyond the allowable limits, you will get notified if the indicator restrictions. Please note that the time involved in calculation of the channel must be greater than the timeframe it wi

This indicator shows Commodity Channel Index (CCI) data from 9 currency pairs by your choice for all 9 Time Frames. If a digital value of the CCI is less or equal to DnLevel = -100 (or whatever number you decided to put) then a Green square will appear. This is potentially an oversold condition and maybe a good time to go Long. If a digital value of the CCI is greater or equal to UpLevel = 100 (or whatever number you decided to put) then a Red square will appear. This is potentially an overbough

This indicator allows to analyze a chart using the rule of supple and demand. You will see zones of sales and purchases and determine the most profitable points to open positions. The indicator is based on the principle of market fractality. Chart zones show places where a strong buyer or seller has made the price reverse and change its direction. The indicator has several types of zones calculation. Color and type of zones displaying are set as desired. The zone width can be displayed in pips.

"Nice Forex Pro" 特別適用於 EUR/USD 貨幣對,這是外匯市場上最受歡迎和流動性最高的貨幣對之一。此 EA 可以針對該貨幣對進行優化,原因如下: 為什麼 "Nice Forex Pro" 是 EUR/USD 的最佳選擇: 高流動性 : EUR/USD 是全球交易量最大的貨幣對,這意味著它具有極高的流動性。這使得點差(spread)較小,滑點(slippage)較少,非常適合像 Nice Forex Pro 這樣依賴準確執行的自動交易系統,以最大化利潤。 市場條件穩定 : EUR/USD 貨幣對的市場條件通常比其他波動性較大的貨幣對更穩定。這種穩定性使 Nice Forex Pro 更容易識別可靠的進出場點,減少錯誤信號或異常波動的可能性。 經濟數據易得 : EUR/USD 貨幣對對來自歐元區和美國的重大經濟事件和新聞非常敏感。 Nice Forex Pro 可以被編程來利用經濟數據發布、央行決策和影響歐元及美元的地緣政治事件。 技術指標清晰 : EUR/USD 貨幣對的價格波動往往更具可預測性,這使得 Nice Forex Pro 能夠有效地使用技術分析工具。像移動

Description of the Indicator Trend Stop shows the highest/lowest value of the last N periods. Can help traders identify the trend direction and potential stop levels. Use Trend Stop indicator to detects the trend direction.
Downtrend if the price crosses the Trend Stop line upwards Uptrend if the price crosses the Trend Stop line downwards
Use Trend Stop indicator to define optimal stop levels. Downtrend Place your stops above the Trend Stop line Uptrend Place your stops below the T

This indicator shows bands (flexible corridor) for a current price movement and the change of trend. The indicator can be used on any time frames and currency pairs. The following input parameters can be easily changed for your needs: nPeriod = 13; - number of bars which the indicator will use for calculation Deviation = 1.618; - coefficient for bands distance from the middle line MaShift = 0; - shift from current bar
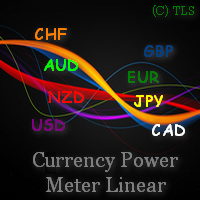
这是货币权力的线性指标,具有通过平滑值进行过滤的能力。它显示所选货币的当前力量(最大数量为 8),以及历史价值。计算取决于指标启动时所选的图表时间范围。 该指标将数据显示为所有货币的线条或当前货币对的直方图。当前货币对的货币强度指数的交集在图表上额外显示为箭头。当前趋势方向由条形图的颜色突出显示。 主要设置: iPeriod - 用于分析货币力量的柱数。 HistoryBars - 历史上计算的柱数。该参数影响第一次启动期间的执行时间。如果经纪人对历史长度有限制,还需要减少必要的历史数据。 SmoothingPeriod - 数据平滑周期(要启用平滑,设置为 1)。 SmoothingMethod - 数据平滑方法。 ShowPairLabels - 在指标窗口的左侧启用/禁用带有货币名称的显示标签。 LabelsFontSize - 货币标签字体大小。 ShowRatio1-8 - 要显示的货币名称。 UsePairs - 货币权力计算的符号列表。 PairPrefix - 货币对的附加前缀。例如,在 EURUSD.e 符号中,“.e”是一个前缀。 ShowWarningCommen
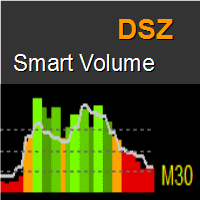
DSZ Smart Volume indicator displays the current and future values of the volume. Every instrument has its own personality which comes from events like market openings, lunch times, news releases and night. DSZ Smart Volume simply analyzes volume statistically to create volume distribution over day. Volume bars are red if values are below average and green when above. The line represents volume distribution over a day. Colored band in the bottom represents volume distribution.
Interpretation Red
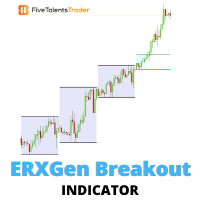
Without volatility, trading the financial market is close to impossible. Profit is made ONLY when the price is moving. The ERXGen (Early Riser Next Generation) system is a short-term trading technique built around the phenomenon that there are certain times during a trading day when the price volatility has the tendency to be high. In essence, ERXGen is based on the very popular London Open Breakout strategy, although with bespoke tried and tested rules that increase consistency and profitabilit

DeMarker (DeM) indicator is another member of the Oscillator family of technical indicators. Traders use the index to determine overbought and oversold conditions, assess risk levels, and time when price exhaustion is imminent. This indicator shows DeMarker data from 9 currency pairs of your choice for all 9 timeframes. If a digital value of DeM is less or equal to DnLevel = 0.3 (or whatever number you decided to put), Green square appears. This is potentially an oversold condition and may be a

The Expert Advisor forms a virtual representation of Renko chart (no indicators used) and then trades on predefined formations of Renko boxes. An order is opened when a predefined number ( SignalSize ) of unidirectional Renko bars are formed after reversal. The EA advantages: No more than one order on a symbol is opened in the market; No martingale, no drawdown, no averaging; Optional stop loss with trailing; Optional management of lot size according to deposit exposure or risk of losses with sp

The Average Directional Index (ADX), Minus Directional Indicator (-DI) and Plus Directional Indicator (+DI) represent a group of directional movement indicators that form a trading system. This indicator shows ADX data from 9 currency pairs by your choice for all 9 Time Frames. Input parameters From Symb1 to Symb9 - you may change any of this Symbol to any legal currency pair existed on your platform. MainLine = false; - if TRUE then the ADX measures trend strength without regard to trend direct
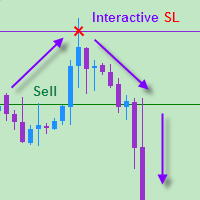
The EA allows a trader to place stop loss invisible for brokers and thereby prevent false breakthroughs and unwanted stop loss triggering. When you use standard stop loss, the price may break through stop loss before moving to the direction of an open order and therefore the orders is closed. Interactive Stop Loss removes standard stop loss of the open order and adds a horizontal line instead. After this it maintains the order until the line is crossed by the price. And then it finally closes th

This indicator automatically builds an alternative set of resistance and support lines based on areas where price are concentrated (instead of extremum points). The algorithm utilizes Linear Hough Transform ( Wikipedia ). New lines are used for trading in the similar way as in the classical approach, that is they indicate points for possible reversal or breakthrough in the future price actions. Yet their main advantage is that they cover most populated and consistent price regions, discovering a
Pending Orders Grid Complete System opens any combination of Buy Stop, Sell Stop, Buy Limit and Sell Limit pending orders and closes all existing pending orders. You will be able to Drag-and-Drop the Script on the chart and it will pick up the start price for the first position in the grid from the "Drop" point. Usually it should be in the area of Support/Resistance lines.
Input Parameters Before placing all pending orders, the input window is opened allowing you to modify all input parameters:
该EA是基于简单的数学。 该EA放置2多向订单进一步,无论价格去,一个订单总是在加号,第二个在减号. 如果我们平均,然后在价格的反向运动(只有少数利差),平均订单被关闭,只有有利可图的保持! 这是由于他的利润和交易。 当然,平均头寸本身也会以MinProfit为代价添加到利润银行,特别是如果您使用rebyte程序返回点差。
此外,EA有一个MA过滤器,但我通常禁用它。 了解EA的工作最简单的方法是将其放在可视化测试仪中,并以低速查看其工作。 我认为即使是初学者也不会很难做到。
特点
TF-timeframe蜡烛图确定趋势的方向,以分钟为单位1 5 15 30 60 240。.. MinStep-订单之间的最小步长(在终端与5和3位数的报价增加10倍) Lot-lot if=0,则该手数将按风险的可用保证金百分比计算 % 风险-可用资金的百分比 K_Martin-后续批次的乘法(可以设置为1禁用批次的增加,而不是加载存款) MA-按MA过滤(如果价格高于MA,则只购买,反之亦然0-禁用过滤器) 魔术-独特的顾问的订单数量 DrawInfo-在屏幕上显示信息 DigitsLot-舍入

StarDust searches for divergences in the values of several indicators considering them as signs of flat and enters the market if a relatively steady trend is detected. The Expert Advisor trades "basic" symbols with a low spread. The best results are achieved on М15. The EA automatically adjusts to 4 and 5-digit quote flows.
Settings Comment_to_orders – comment to a placed order. The field can be left blank if no comment is required. MM – enable money management with automatic setting of a worki

Grail Scalper EA – 自动剥头皮交易专家顾问 Grail Scalper EA 是金融市场自动交易的强大工具。 采用先进的算法和策略设计,此EA适合新手和经验丰富的交易者。 它结合了精准信号、风险管理和自适应参数,以实现最大效率。 参数设置: 参数 描述 dist1/dist2 信号计算周期(默认值:14/21)。 Lots 固定手数(例如,0.01)。 StopLossPercent 以ADR百分比计算的止损(例如,40%)。 TakeProfitPercent 以ADR百分比计算的止盈(例如,90%)。 TrailingStop 追踪止损的点数(例如,40)。 UseAutoLot 启用自动手数(true/false)。 RiskPercent 自动手数的风险百分比(例如,10%)。 Slippage 允许的滑点(例如,3)。 MaxSpread 最大允许点差(例如,20)。 Grail Scalper EA 的优势: 高精准信号: 算法分析市场数据,仅生成强劲入场信号。
风险最小化: 自动计算手数,并防止高点差,确保安全交易。
易于使用: 直观的
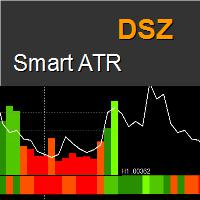
DSZ Smart ATR indicator displays the current and future values of the True Range . Indicator analyzes volatility statistically and create Average True Range distribution over day. Unique future is that time frame of indicator can be set freely from main window allowing to have different perspective. Bars are red if values are below average and green when above.
Benefits Gives true value of ATR filtered from data from non regular trading time. Indicates significant candles when they exceed expec

The main aim of this indicator lies in determining entry and exit points, that is why the ExactArrow indicator does not draw nothing but arrows which show entry and exit points. In spite of apparent simplicity of the indicator, it has complicated analytic algorithms which determine entry and exit points. The indicator generates exact and timely entry and exit signals which appear on the current candle. The indicator generates an average of 1-2 candles before its analogues do. The indicator is ve

This indicator is designed for H1 and H4 timeframes (TF) only. No input parameters because it is tuned to these two TF. It draws two step-like lines: a main Silver line and a signal Red line. These two lines are calculated so that to enhance the filtration of the market noise. Buy when the main line goes above the signal line. Sell when the main line goes below the signal line.

Supplement for Alpha Trend Spotter (ATS) Indicator: https://www.mql5.com/en/market/product/8590 This indicator acts by price action. Use it when ATS shows clear Bullish or Bearish Trend for finding the strongest trend each day. Suitable for timeframes M5, H1, H4 and D1. Suitable for Binary Option 5 minutes signal. How to Use: RED Arrow means Sell
GREEN Arrow means Buy

This indicator works on every currency pairs and time frames (TF). One input parameter: nPeriod - number of bars for histogram calculation. I recommend to optimize nPeriod value for each TF. If Green histogram poles are crossing the zero line from below then Long position may be opened. If Red histogram poles are crossing the zero line from above then Long position may be opened.

This is a well-known ZigZag indicator. But it differs by the fact that its plot is based on values of the middle line which is set by a user. It can display Andrews’ Pitchfork and standard or Bobokus Fibo levels. NO REPAINTING.
Parameters Period МА — middle line period. Default value is 34. Minimum value is 4. Maximum value is set at your discretion. Used to calculate price - base price to calculate the middle line. The averaging method - method of smoothing the middle line. Turning pitchfork —
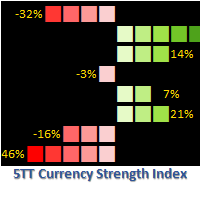
Want to know if to go long or short on any currency pair? 5TT Currency Strength Index is the answer! 5TT Currency Strength Index is a unique indicator for determining the short-term strength of any currency. Each currency strength is determined by an index of the currency with the strength of 7 other major currencies. The indicator is constantly monitoring price action across 28 currency pairs and 56 combinations; taking the following into consideration Price volatility. Short-term price range.

This is a must have tool for a serious trader. It saves your precious time spent for opening/closing trades, creating pending trades and modifying your TP/SL in bulk according to either pips or price. If you need to quickly open several pending orders (Buy Stop, Sell Stop) at a certain distance from each other, this script will do all the routine for you! The first time you use this handy tool, you will realize it has already paid for itself. Instructions: Drag and drop this script onto a chart.

The ProfileVolumesMarket indicator calculates tick volume on each price level in a selected range. Volume is vital when determining strength and therefore significance of price levels. The calculation range is set by a trader by means of moving two vertical lines. Thus the indicator allows to track important levels on different steps of a symbol price formation. A histogram of volume profile can be displayed on the chart (or removed from the chart) if you press "ON" ("OFF") button. When you chan
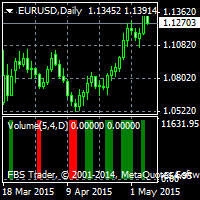
Alpha Trend Spotter (ATS) Volume Break Out This is an indicator that combines Volume breakout/breakdown and Moving Average Breakout/breakdown. It is able to predict further price changes. It is not repainted, not recalculated. All lines are shown at the open of a new candlestick, never winking or vanishing in the current candle. These lines are appeared at the beginning of the current candle. Suitable for M5 to D1 Timeframe. How to Use: If Green line appears, that shows the "oversold" area, so t

Simply drop the indicator on a chart, and you will always know when candlesticks form one of the Price Action patterns! The indicator automatically analyzes recently closed candles, and notifies if they form any of the Price Action patterns. The following classical patterns are analyzed: Pin bar Outer bar Pivot Point Reversal Double base Closing price reversal Force bar Mirror bars Move-congestion-move For each pattern, the indicator also shows trade direction in accordance with the classical Pr

The indicator is created for professional trading by Fibonacci levels. AutoFiboLevels plots Fibonacci retracement and extension levels on impulse and corrective wave. The indicator unambiguously interprets a market situation. Points of extremum for level plotting are calculated using fractal analysis. A trader can independently set retracement and extension levels and calculation time frame adjusting the indicator for various strategies.
Parameters: WorkTF - time frame for indicator calculation

The indicator determines Dragon pattern. It is based on the zigzag. There is buffer 0 which has no color located in the Colors tab. You will see the zigzag if you set it to some color. The indicator draws an up arrow when it detects a pattern which assumes further upward movement of the indicator. Similarly, the indicator draws a down arrow when it detects a pattern which assumes further downward movement of the indicator. Parameters: Alerts - show alert when an arrow appears. Push - send a pus
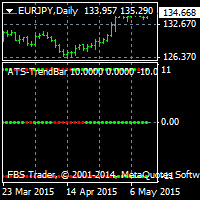
This indicator searches for the strongest trend and works on any timeframe. D1 timeframe is recomended. The product features three lines showing fast, medium and slow bars. If red bars appear at each of the three lines simultaneously, there is a strong bearish trend.
If green bars appear at each of the three lines simultaneously, there is a strong bullish trend. The indicator does not repaint and can be combined with other indicators. It is also suitable for binary option trading.

The indicator displays the moving average of all periods on one chart. It shows the MA of a one step lower timeframe and all the MAs equal to and higher than it.
Parameters Period moving average - Moving Average period (default is 34); Used to calculate price - price used for the MA calculation (default is the average price = (high+low)/2); The averaging method - default is linear-weighted; Moving average shift - MA shift (default is 0). Just enter the MA calculation period and its parameters,

Hammering Hammering 是一种自动交易系统,旨在处理任何货币对。交易时,使用多币种和单币种模式。 为了做出交易决策,EA 使用来自 斜率方向线 指标的信号。 设置说明。 Profit_Percent_AccountEquity = 0.4; - 利润水平占可用资金的百分比 Fix_AccountEquity = 0; - 免费资金的强制性水平 FIX_PROFIT = 1000; - 强制利润水平 周期 = 55; - 指标期。 过滤器编号 = 2; - 指标过滤器。 ma_method = 3; - 指标的平均方法。 应用价格 = 0;是指标的使用价格。 TF = 15; - 指标的图表周期。 PAIRS = "EURUSD, GBPUSD, USDCHF, USDJPY"; - 一组用于多货币交易的货币对。 幻数 = 6; - 顾问的订单标识符 TrailingStart = 9.5; - 以点为单位的利润水平。拖网的起始水平,在此之后进行拖网,即开启拖网。 追踪止损 = 0.5; - 以存款货币为单位的固定拖网规模 尾随步长 = 0.5; - 存款货币的尾随步

5TT Pivot Lines is a visual display of pivot lines. These are primarily support and resistance points with the 'Blue' Pivot Point. Pivot points are useful for determining key levels for entry or exits (setting targets and stop loss levels). Having these support & resistance lines visually displayed on the chart is very useful for intraday traders. 5TT Pivot Lines come with some user-friendly settings to decide if to display the lines or connectors on the chart Settings CandlesBack: This gives th

true Momentum - time-based Indicator it will inform about Momentum, a strong impulse in the appropriate direction it's based on a self-developed candle Pattern, in relation to the ATR (Average True Range)
Quick Start : the indicator is ready to use choose your personal times to trade try an indicator-preset or use an additional indicator, below the pro-settings
Filter Hours Weekdays Moving Averages Correlation Instruments - Moving Averages MACD RSI ADX PSAR Stochastic Bollinger Bands Keltner-
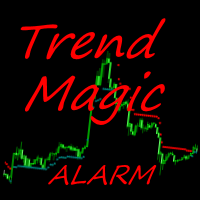
The Trend Magic Alarm shows the direction of a trend and indicates when it changes with a sound, popup window, push or email notice. Blue dots in the chart indicate an uptrend, red dots indicate a downtrend. Levels of former highs + lows give orientation in a chart. Trend Magic Alarm can draw these levels as lines in the chart, see inputs.
Input Parameters Counter : number of bars used for calculation PowerSet : shows how near to the bars the trigger dots are placed DotSize : size of the shown

The product combines a manual trade panel with the ability to perform actions automatically in a highly configurable way. Actions include capturing indicator values and then based on those values raising alerts, open/close or partially close trades, scale-in, setting up pending orders, adjusting stop loss, take profit and more. On-chart controls can be configured, such as tick boxes and buttons, so can be fully interactive. The EA also handles money management, news events, hidden stop loss, tak

MetaTrader市场是一个简单方便的网站,在这里开发者可以出售自己的交易应用程序。
我们将帮助您发布您的产品,并向您解释如何为市场准备您的产品描述。市场上所有的应用程序都是加密保护并且只能在买家的电脑上运行。非法拷贝是不可能的。
您错过了交易机会:
- 免费交易应用程序
- 8,000+信号可供复制
- 探索金融市场的经济新闻
注册
登录