适用于MetaTrader 4的付费技术指标 - 116
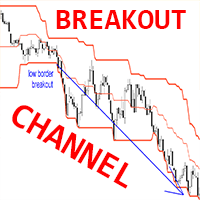
Crypto_Forex 指标 BREAKOUT CHANNEL 适用于 MT4,无需重绘。
- 此指标可用作基于高/低突破的完整交易系统。 - 它只有 1 个参数 - HYSTORY DEPTH,它反映了指标考虑的蜡烛数量。 - 参数 HYSTORY DEPTH 推荐值:时间范围 D1 - 20(一个月)、H4 - 30(一周)、H1 - 24(一天)。 - BREAKOUT CHANNEL 由 3 条线组成:高边界 - 最后 N(HYSTORY DEPTH 参数)蜡烛的最高价格,低边界 - 最后 N(HYSTORY DEPTH 参数)蜡烛的最低价格,中线。 - 指标可与其他指标/价格行动模式结合使用。 - 可以在图片上找到 BREAKOUT CHANNEL 指标使用的示例。
// 更多出色的专家顾问和指标可在此处获得: https://www.mql5.com/en/users/def1380/seller 这是仅在此 MQL5 网站上提供的原创产品。
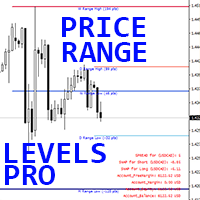
MT4 外汇指标“价格范围水平专业版”。
- 指标“价格范围水平专业版”是一款非常有用的专业辅助交易工具。 - 它向您显示价格(价格范围水平)可达到的每日、每周和每月最可能水平。 - 每日范围对日内交易者有用。 - 每周和每月范围对波动和长期交易者有用。 - 指标非常适合规划您的获利目标或安排止损。 - 它具有信息价差掉期显示 - 它显示所附外汇对的当前价差和掉期。 - 显示还显示账户余额、净值和保证金。 - 可以将信息价差掉期显示定位在图表的任何角落: 0 - 左上角,1 - 右上角,2 - 左下角,3 - 右下角。
// 更多出色的专家顾问和指标可在此处获得: https://www.mql5.com/en/users/def1380/seller 这是仅在此 MQL5 网站上提供的原创产品。

Session Liquidity is the most anticipated trading strategy among the ICT trader. With this indicator you could frame the trade by simply deploying it on the chart. By simply inputting the Asian Opening Time, New York Opening Time, and choose the color option and display option you like then you will get the session laid down for you on the chart. You can choose between showing session as box or horizontal line. I personally trade this strategies for quite sometimes.
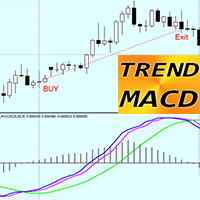
MT4 的 TREND MACD 指标 - 是一款出色且高效的交易工具!
- 此指标适用于专注于捕捉大幅价格波动的趋势交易者。 - TREND MACD 由 3 条线组成:绿线 - 显示主要趋势方向,蓝线和洋红色线用于进入和退出。 - 指标允许最大化利润 - 不要过早退出盈利交易。 - 指标具有内置移动和 PC 警报。
如何使用指标进行买入交易(见图片): 1) 检查蓝线和洋红色线是否都在绿线上方。 2) 然后,一旦蓝线高于洋红色线 - 买入。 3) 一旦蓝线低于洋红色线,退出交易。 4) 卖出交易反之亦然。
// 更多出色的专家顾问和指标可在此处获得: https://www.mql5.com/en/users/def1380/seller 它是仅在此 MQL5 网站上提供的原创产品。

This is the automatic price spike signal indicator for MT4. Plots advance alerts on potential breakouts/pullbacks. Suits forex, stocks & crypto trading strategies.
This is a perfect indicator for reversal traders. A spike often indicates a turn-around moment. The best way to use that gauge is to apply it to your favourite trading system as a filter. We use this indicator in our Capital Gate EA in conjunction with our proprietary signal filtering system and the Martingale method, resulting in

The KT Range Filter Buy and Sell simplifies minor price movements and fluctuations, transforming them into a smoother, more defined trend. While QQE smoothing is typically applied to RSI, It applies the concept directly to price, offering a unique and effective approach to market analysis.
It features a three-band structure, consisting of a main averaging line flanked by an upper and a lower band. These bands are calculated using a range multiplier, providing a clear visual representation of p
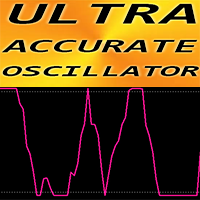
超精确的 MT4 振荡器。
UA 振荡器 - 是一种高级自定义 Crypto_Forex 指标,与趋势指标(例如 EMA)结合使用时准确度约为 80%。
- 使用先进的新计算方法。UA 振荡器比标准 MT4 振荡器更快、更准确。 - 新一代振荡器 - 查看图片以查看如何将其与 EMA10 结合使用的示例。 - 超卖值:低于 0.03 // 超买值:超过 0.97。 - 使用此指标有很多机会升级标准策略。 - 指标设置非常简单。主要参数:灵敏度 - 建议值范围:0.4-0.8。 - 具有移动和 PC 警报。
// 更多出色的专家顾问和指标可在此处获得: https://www.mql5.com/en/users/def1380/seller 这是仅在此 MQL5 网站上提供的原创产品。

Trend Master ZA 指标 通过 Trend Master ZA 指标解锁趋势分析的力量,这是一个为希望将多种技术策略整合到一个工具中的交易者而设计的强大工具。此指标提供了对市场趋势和价格动态的深入洞察。 主要特点: 通过布林带分析趋势 :利用布林带的强大功能来识别市场趋势,支持可调整的周期和偏差。该指标根据市场状况进行调整,清晰地显示上涨和下跌趋势。 蜡烛力量的可视化 :Trend Master ZA 指标实时分析蜡烛的力量,使用相对强弱指数(RSI)。多头和空头、蜡烛的实体和影线通过不同的颜色显示,便于确定价格走势的强度。 上涨和下跌趋势信号 :该指标基于计算出的布林带水平和RSI强度生成强有力的上涨和下跌趋势信号。信号以亮眼的颜色和箭头显示,便于快速识别潜在的交易机会。 动态趋势线 :基于计算出的价格行为水平,自动绘制趋势线,为可能的支撑和阻力区域提供清晰的视图。您可以根据个人偏好调整趋势线的样式、颜色和粗细。 设置和灵活性 :通过多种参数设置个性化您的指标,包括蜡烛实体和影线的粗细、趋势线宽度等。选择与您的交易策略相匹配的信号显示模式和线条样式。 易于集成 :专为在

This is an indicator that seeks to show consolidation zones .
Discover the Power of Prediction with the Limiar Latus Indicator ! An innovative indicator designed for traders seeking to identify and anticipate crucial turning points in sideways market movements. Key Features: Predicting Changes: Utilizes advanced algorithms to detect sideways patterns, allowing you to anticipate significant movements before they happen. Clear Visual Analysis: With intuitive rectangles representing con
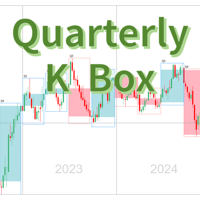
季度K线盒形指标说明 产品名称 季度K线盒形指标(Quarter K Box Indicator) 产品简介 季度K线盒形指标是一款专为外汇、股票和期货交易者设计的技术分析工具。它能够在 月图、周图、日图以及更小周期图表 上显示季度蜡烛的范围(高点、低点、开盘价、收盘价),通过绘制清晰的背景盒形,帮助交易者快速识别市场的季度趋势和关键支撑/阻力区域。 无论您是趋势跟随者还是短线交易者,此指标都能为您提供更高时间周期的市场结构视角,帮助您更好地判断市场动向,制定精准的交易策略。 功能特色 季度背景盒形显示 在低于季度周期的图表(如月图、周图、日图)上,通过盒形清晰标注每个季度的开盘价、高点、低点和收盘价。 背景盒形颜色可自定义,不同季度的盒形颜色自动区分,便于快速识别。 多时间周期支持 可在 月图、周图、日图、4小时图 等任意低于季度周期的时间框架中使用,兼容所有主要交易品种(外汇、股票、指数、期货等)。 趋势判断利器 轻松识别季度趋势的方向(上涨、下跌或震荡)。 明确季度级别的关键支撑和阻力区域,避免在重要区域误判。 自定义参数设置 允许用户自定义盒形颜色、显示数量等,
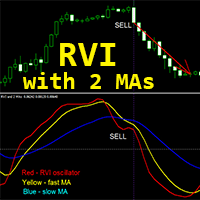
Crypto_Forex 指标“RVI 和 2 个移动平均线”适用于 MT4,无需重绘。
- 相对活力指数 (RVI) 本身是一种技术动量指标,在趋势市场中非常有用。 - “RVI 和 2 个移动平均线”指标允许您查看 RVI 振荡器的快速和慢速移动平均线。 - 指标非常适合动量交易,尤其是在大时间范围内:D1、H4、H1、M30。 - 通过参数设置此指标非常容易,可在任何时间范围内使用。 - 您可以在图片上看到买入和卖出入场条件。 - 买入入场条件: (1)-快速黄色 MA 位于慢速蓝色 MA 上方,(2)-红色 RVI 线位于黄色快速 MA 上方,(3)-红色 RVI 线从快速黄色 MA 向上反弹。 - 卖出入场条件: (1)-快速黄色 MA 低于慢速蓝色 MA,(2)-红色 RVI 线低于黄色快速 MA,(3)-红色 RVI 线从快速黄色 MA 向下反弹。
// 更多优秀的专家顾问和指标可在此处获得: https://www.mql5.com/en/users/def1380/seller 这是仅在此 MQL5 网站上提供的原创产品。

The KT Dynamic Price Oscillator (DPO) offers a specialized approach to analyzing the trend, momentum, and volatility of financial instruments. It excels at identifying trend continuations, overbought or oversold conditions, and potential reversal points with precision. It is specifically designed to assist traders in identifying short-term price cycles and potential reversals by effectively filtering out long-term trends.
How to use the DPO
Trend Confirmation: The DPO acts as a reliable confir

Waterfall Trading Indicator Overview The Waterfall Trading Indicator is a powerful momentum detection tool designed to identify high-probability trading opportunities across multiple timeframes. Built on pure price action analysis, this indicator provides clear, non-repainting signals that are especially effective for binary options and forex trading. Key Features Non-Repainting Signals : Based on real-time price action, ensuring reliable trade signals Multi-Timeframe Compatibility : Effective a

"The upgraded version of the Gold heat map. The indicator is more effective on the gold chart, where daily opportunities will appear clearly before you. Levels14Golden , introduces the integration of supports, resistances, and time, along with significant enhancements."
1. **Heatmap for Price Dynamics**: A heatmap has been added to indicate the intensity of price movements, ranging from **45 to 630 degrees**. - **Major Levels**: Marked in **blue**, as shown in the video. - **Sec

Crypto_Forex 指标适用于 MT4 Heiken Ashi Histo Filter - 是一款出色且高效的辅助交易工具!无需重绘!
- 使用先进的新计算方法 - 参数“计算价格”有 10 个选项。 - 非常适合与价格行为模式结合使用: - 绿色直方图 - 寻找看涨模式。 - 洋红色直方图 - 寻找看跌模式。 - 使用此指标,有很多机会升级标准策略。 - 指标内置移动、PC 和电子邮件警报。 .................................................................................................................... // 更多出色的专家顾问和指标可在此处获得: https://www.mql5.com/en/users/def1380/seller 它是仅在此 MQL5 网站上提供的原创产品。

As an ICT or SMC trader you must do top-down analysis, and you struggle to make template of drawing object on Metatrader just like you normally do on Tradingview. Well, Drawing Assistance indicator will make your top-down analysis much easier on Metatrader. Allow to design template for 3 timeframes. (HTF, MTF and LTF). Each objects drawn on chart will have the color, style and visibility individually by the timeframe it was drawn on. Save time as all analyzing is done on Metatrader chart. Shortc
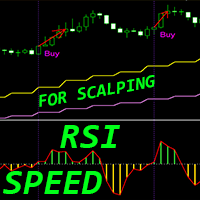
Crypto_Forex 指标“RSI SPEED”适用于 MT4 - 出色的预测工具,无需重绘。
- 该指标的计算基于物理方程。RSI SPEED 是 RSI 本身的一阶导数。 - RSI SPEED 适合在主要趋势方向上进行剥头皮交易。 - 将其与合适的趋势指标结合使用,例如 HTF MA(如图所示)。 - RSI SPEED 指标显示 RSI 本身改变方向的速度 - 它非常敏感。 - 建议将 RSI SPEED 指标用于动量交易策略,如果 RSI SPEED 指标的值 < 0:价格动量下降;如果 RSI SPEED 指标的值 > 0:价格动量上升。 - 指标具有内置的移动和 PC 警报。
// 更多出色的专家顾问和指标可在此处获得: https://www.mql5.com/en/users/def1380/seller 它是仅在此 MQL5 网站上提供的原创产品。

Fibo Extrema Bands is a unique indicator that visually demonstrates when the market shifts into a trend and highlights key levels acting as support or resistance. It combines easy-to-read “stepped” extrema lines with Fibonacci levels (whose values can be adjusted in the indicator’s inputs), simplifying the search for entry and exit points. Install Fibo Extrema Bands to gain a powerful tool for trend analysis and for identifying critical price levels! This product is also available for MetaTrade

Master alert is an indicator based on deep mathematical and statistical calculations. It generates two types of signals; Buy signals Sell signals It uses the following indicators to generate signals; Adx CCI SAR MACD MA WPR MOM When the indicator shows 6 or more of the above indicators with the same buy signal on the dashboard the market is trending up. It is a good time to place buy order. When the indicator shows 6 or more of the as above signals with the same sell signals the market is trendi
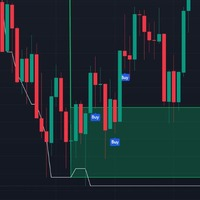
MACDx RSI Supply And Demand Indicator is a dynamic trading indicator designed to identify potential reversal zones in financial markets by combining the momentum insights of the Relative Strength Index (RSI) with order block (supply/demand) levels derived from a MACD-based custom tool. It visually highlights bullish and bearish zones on the chart, offering clear entry signals through directional arrows. Ideal for swing traders and reversal strategists, this tool aims to capture price reversals

Range indicator is a mt4 indicator that shows various levels to enter and Exit a trade. Once you have installed the indicator in the terminal you will see on the trading dashboard various values which include; Support level in pips from the current price, Resistance level in pips from the current price, Stop loss level in pips from the current price to exit if market conditions change
Range bound is a mt4 indicator that shows various levels to enter the market. It uses MACD as the primary reference indicator. When MACD oscillator is showing buy or sell signals these are displayed on your trading dashboard but as levels to buy or sell on the main chart. The indicator shows blue signals and red signals That are support and resistance levels. In short this indicator shows ranges where your trades should be safe from market changes against your order.
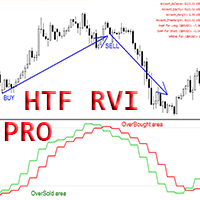
Crypto_Forex 指标 HTF RVI Pro 振荡器适用于 MT4。
- 使用专业的 HTF RVI Pro 振荡器升级您的交易方法,适用于 MT4。HTF 表示 - 更高的时间框架。 - RVI 是用于趋势变化检测和从超卖/超买区域进入的最佳振荡器之一。 - 该指标非常适合多时间框架交易系统,价格行动从超卖/买入区域进入。 - HTF RVI Pro 指标允许您将更高时间框架的 RVI 附加到当前图表 --> 这是专业的交易方法。 - 超买区域高于 0.23,超卖区域低于 -0.23。 - 指标内置移动和 PC 警报。 - 它具有信息价差掉期显示 - 它显示其所连接的外汇对的当前价差和掉期。 - 显示屏还显示账户余额、权益和保证金。 - 可以将信息价差掉期显示定位在图表的任意角落: 0 - 左上角,1 - 右上角,2 - 左下角,3 - 右下角。
// 更多优秀的专家顾问和指标可在此处获得: https://www.mql5.com/en/users/def1380/seller 这是仅在此 MQL5 网站上提供的原创产品。

Arrow up down is a mt4 indicator that shows various levels to enter the market. It consists of two signals; Buy signal Sell signal Buy signals are shown as blue arrows on the chart once you install the indicator. Sell signals are shown as red signals on the chart. The indicator uses other underlying indicators like moving average together with statistical calculations to generate signals.
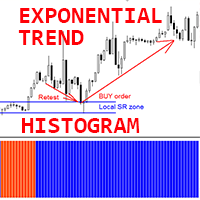
Crypto_Forex 指标“指数趋势直方图”适用于 MT4,无需重绘。
- 指数趋势直方图指标对于趋势检测非常有效。 - 使用它的最佳方式是结合支撑/阻力位和重测技术(见图片): - 一旦指标检测到新趋势 - 找到本地 SR 水平并在那里安排相应的挂单,等待该区域的重测。 - 如果新趋势看涨 - 安排买入限价挂单;如果新趋势看跌 - 安排卖出限价挂单。 - 指标有两种颜色:红色代表看跌下行趋势,蓝色代表看涨上行趋势(颜色可在设置中更改)。 - 具有移动和 PC 警报。 .................................................................................................................... // 更多出色的专家顾问和指标可在此处获得: https://www.mql5.com/en/users/def1380/seller 它是仅在此 MQL5 网站上提供的原创产品。

Trendfollow Indicator - with Stoploss and Trailingstop Accurate Signals – Identifies trend reversal candles Filter – for better trend detection Intelligent signal limitation - Only qualified signals in the trend direction are displayed Easy to use – Perfect for beginners & professionals Visual support – arrows in the chart + display in real time Notifications – Receive alerts & push notifications The indicator also provides the initial stoploss. As the position progresses, this is us

Ultimate Binary Options: The Best Indicator for Your Binary Options Trading If you're looking for a reliable, efficient, and powerful way to boost your results in binary options trading, Ultimate Binary Options is the perfect solution for you. This indicator was developed to provide traders with unparalleled accuracy, delivering success rates above 90% . But it's not just about numbers—it's about turning your strategies into consistently winning trades. What Makes Ultimate Binary Options S

RSI bands indicator is a mt4 indicator that shows various levels to enter trades based on market conditions. It consists of the below buffers; Yellow buffer Blue buffer White buffer When the yellow buffer is above blue buffer the market is trending up good place to open buy order. When the blue buffer is above yellow buffer the market is trending downwards good time to place sell order. Also another alternative scenario is when yellow buffer is above upper white band buffer indicates strong uptr

Rsi with Bollinger bands is a mt4 indicator that shows various levels to enter trades in the market based on conditions. It consists of two main buffers; Yellow buffer that is the current price Grey buffer that shows overbought and oversold levels. When the yellow buffer crosses 70 zone in grey buffer market is trending upwards. When the yellow buffer crosses below 30 zone in the grey buffer the market is showing a strong downtrend. The overbought and oversold levels are customizable in the ind

The OrderBlocks Trigger Indicator for MT4 provides essential information on the market structure. The indicator identifies major trend reversal and exhaustion points of momentum. As a result, forex traders can identify Bullish and Bearish price reversal zones and BUY and SELL accordingly. Moreover, the indicator provides Buy and Sell Arrow Signals.
An order block is a market structure that is identified as the last Bearish candle before a Bullish price move and vice versa. These order blocks a
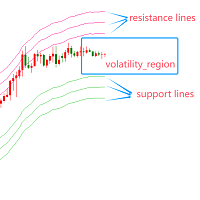
指标简介 : 波动区间指标旨在通过分析市场的历史价格数据,帮助交易者识别当前市场的波动范围。通过计算价格波动的上限和下限,交易者能够确定潜在的支持和阻力位置,从而为后续的交易决策提供依据。该指标特别适合用于震荡市场和高波动环境,可以有效帮助交易者捕捉价格突破区间的时机,从而优化入场和退出点。
应用场景 : 震荡市场 : 在震荡行情中,价格通常在某一特定区间内波动,波动区间指标能够帮助交易者识别该区间的上下限。当价格突破这些边界时,可能会出现新的趋势或反转,从而为交易者提供明确的入场或退出信号。 高波动市场 : 在高波动市场中,波动区间指标可以帮助交易者识别价格的潜在突破点。例如,当市场突然出现大幅波动时,波动区间可能会被迅速突破,波动区间的突破可能意味着新的趋势形成,交易者可以利用这一点进行交易。 趋势识别 : 在趋势市场中,波动区间的突破可能意味着当前趋势的加速或延续。当价格突破上限时,可能是上涨趋势的确认;当价格突破下限时,可能是下跌趋势的确认。 联系方式: https://www.mql5.com/en/users/zhihui_dianjin

The Gann Hi-Lo indicator is a powerful tool for trend analysis.
This modified version colors the signal line and chart candles according to the trend direction.
In an uptrend, the candles and the line appear in a bullish color, while in a downtrend, they are displayed in a bearish shade.
This makes it easier to visually identify trend changes and provides traders with clear guidance.
Thanks to the simple interpretation of the indicator, traders can quickly react to market movements and make wel

RiskMaster Pro Lotsize Protector
该指标提供了管理风险的最简单方法。无需复杂的设置,即可提供执行订单所需的准确信息。 无需复杂的设置,选择所需的订单类型 Market/Pending Orders,输入可用资本的百分比风险和风险回报比率(Risk-Reward-Ratio RRR)。 Market Orders: • 用鼠标将止损(SL)线拖到所需位置。 • 该指标直接显示允许的手数,SL/TP 和 TP 的点数距离作为参考线。 Pending Orders: • 用鼠标将止损(SL)线和入场线拖到所需位置。 • 该指标显示允许的手数,SL/TP 和 TP 的点数距离作为参考线。 通过按钮,可以在不更改设置的情况下直接调整风险资本。 作为扩展,相关的专家顾问可以直接获取以下值: • 手数 • 入场 • 止损 SL • 止盈 TP 执行适当的订单(Buy/Sell/Buy Stop/Sell Stop/Buy Limit/Buy Stop),无需额外的设置或操作。 点击“Order”按钮,订单执行将按照参考线显示的所有必要参数启动。 指

very simple indicator to help with fast risk management during volatility.
~Displays: - stop loss in points of your choice. - take profit in points of your choice. - what lot size to risk on the trade relative percentage.
~Values that can be changed: - take profit points. - stop loss points. - risk in percentage. - color of lines. - width of lines. - linestyle. - buy / sell trade.

智能支撑和阻力指标 智能支撑和阻力指标旨在通过自动识别多个时间框架上的关键支撑和阻力水平,增强您的技术分析,帮助交易者做出明智的决策。该工具通过计算指定回溯周期内的最高和最低价格点,基于最频繁测试的水平,然后计算这些水平的平均值,并动态地将其绘制在图表上。这意味着生成的支撑和阻力水平比大多数现有的支撑和阻力指标更可靠。它还集成了斐波那契回撤水平作为潜在的价格目标,进一步增强市场预测,这些目标也可以作为额外的支撑或阻力水平。 主要特点: 自动支撑和阻力水平: 在指定回溯期内(默认:200)识别最重要的支撑和阻力水平。 可自定义时间框架: 支持从1分钟(M1)到月线(MN1)的所有主要时间框架,允许在每个时间框架上精确绘制水平线。 灵活的线条自定义: 根据您的交易偏好,定制支撑、阻力和斐波那契目标水平的线条宽度、样式和颜色。 斐波那契目标: 自动在每个时间框架上绘制最多三个基于斐波那契的目标水平(23.6%、38.2%、61.8%),并可以切换可见性。 多周期支撑: 指标会更新不同时间框架上的支撑、阻力和目标线,确保每个交易时段的相关数据。 增强的可视化: 通过颜色编码的线条轻松查看支撑、
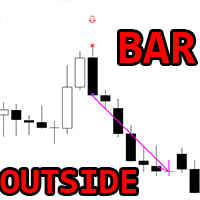
Crypto_Forex 指标 OUTSIDE Bar 模式适用于 MT4。
- 指标“OUTSIDE Bar”是价格行为交易的非常强大的指标:无需重绘,无延迟。 - 指标检测图表上的 OUTSIDE Bar 模式: - 看涨 OUTSIDE Bar - 图表上的蓝色箭头信号(见图片)。 - 看跌 OUTSIDE Bar - 图表上的红色箭头信号(见图片)。 - 带有 PC、手机和电子邮件警报。 - 指标“OUTSIDE Bar 模式”非常适合与支撑/阻力位结合使用。 .................................................................................................................... // 更多出色的专家顾问和指标可在此处获得: https://www.mql5.com/en/users/def1380/seller 这是仅在此 MQL5 网站上提供的原创产品。
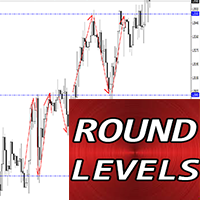
MT4 外汇指标“整数水平”。
- 指标“整数水平”是交易者必须考虑支撑/阻力的辅助指标。 - 价格非常尊重整数水平 - 价格经常从整数水平反弹。 - 对 H4、D1 时间范围使用 1000 点步长。 - 对 H1 和更低时间范围(用于日内交易)使用 500 点步长。 - 整数水平也适合分配获利(在整数水平之前)和 SL(在整数水平之后)。 - 这些水平非常强,尤其是在价格横盘和持平期间。 .................................................................................................................... // 更多出色的专家顾问和指标可在此处获得: https://www.mql5.com/en/users/def1380/seller 这是仅在此 MQL5 网站上提供的原创产品。

智能趋势通道指标 描述:
智能趋势通道是一款强大而灵活的工具,通过在价格图表上动态绘制支撑与阻力通道,帮助交易者清晰识别市场的关键趋势。利用高级分形计算,该指标能自动生成趋势线,根据市场变化进行调整,助力交易者发现突破与反转区域。 主要功能: 通道显示控制: 可随时开启或关闭趋势通道显示。 动态分形计算: 根据不同时间周期和分形参数自动调整趋势线。 清晰的趋势可视化: 包括上轨线、下轨线和中线,帮助交易者更好地理解市场走势。 颜色自定义: 可个性化设置线条颜色,以提高视觉效果并突出关键市场区域。 适应多种时间周期: 从1分钟到1个月自动适应不同时间框架。 优势: 识别强劲市场趋势与潜在反转点。 提供市场结构信息,增强交易信心。 自动绘制趋势线,节省交易者的时间。 适用场景: 适合突破交易、趋势跟随以及技术分析的交易者。 适用于短线剥头皮交易和长期市场分析。 智能趋势通道指标为市场分析提供了智能化、可定制的解决方案,帮助交易者掌握市场动态,做出明智的交易决策。
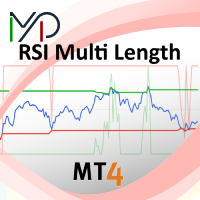
This indicator provides insights into Relative Strength Index (RSI) values over multiple timeframes. It highlights the percentage of RSIs across varying periods that are classified as overbought or oversold, and also calculates the average of these RSIs. The percentage of overbought or oversold RSIs is further utilized to define adaptive thresholds for these levels. Settings: Maximum Length: Specifies the longest RSI period used in the calculations. Minimum Length: Specifies the shortest RSI pe
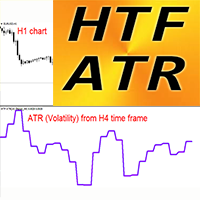
Crypto_Forex 波动率指标 HTF ATR 适用于 MT4。
- 平均真实范围 (ATR) 本身是最重要的指标之一 - 它显示市场波动性。 - HTF ATR 是技术分析中使用的市场波动率指标。HTF 表示 - 更高时间范围。 - ATR 非常适合规划您的动态获利/SL 位置: 例如,大多数最佳 SL 值位于 1.2-2.5 ATR 值中。 - 此指标是可添加到任何交易系统的有用工具。 - HTF ATR 指标允许您将更高时间范围的 ATR 附加到您当前的图表 --> 这是专业的交易方法。 .................................................................................................................... // 更多出色的专家顾问和指标可在此处获得: https://www.mql5.com/en/users/def1380/seller 它是仅在此 MQL5 网站上提供的原创产品。
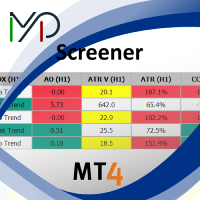
The MP Screener is a powerful and user-friendly tool designed for traders who need to filter and analyze multiple symbols based on various technical criteria. Whether you are a scalper, day trader, or swing trader, this screener helps you quickly identify the best trading opportunities in the market by scanning multiple timeframes and indicators in real time. With the MP Screener, traders can streamline their market analysis, making it easier to focus on profitable setups while saving time. Unl

ForexFire Renkotrader Recognize profitable entries & trade with confidence! Highlights: Precise signals – Identifies reversal candles in the trend EMA filter - Uses Ema`s for reliable signals Intelligent signal limiting - Only qualified signals are displayed Easy to use – Perfect for beginners & professionals Visual support - arrows in the chart + SL display in the chart Notifications – Receive alerts & push notifications This is how the indicator works: Long Signal:
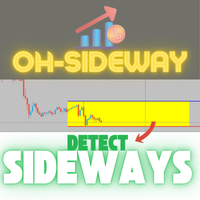
The indicator continuously calculates the current ATR value and displays it on the chart. If an adjustable threshold is undershot, a channel is automatically drawn to indicate a possible sideways movement. As soon as this threshold is exceeded again, the channel is removed from the chart. This is intended to show that the current market movements are weak and the channel shows a possible direction of a sideways movement in the market.
In addition to the threshold, the scaling of the ATR value
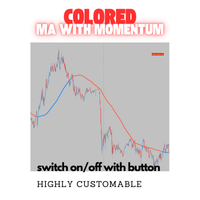
The indicator generates buy and sell signals based on a combination of a modified moving average with a trend momentum algorithm.
To ensure clarity on the chart, this indicator can be switched on and off using a freely positionable button.
Note: If you use this indicator multiple times, e.g. to display different MA periods, then you must change the "button label (ID)" in addition to the period to ensure it works. The label when pressed should also be changed accordingly for a clear overview.

This indicator draws lines at the open, close, high and low price of the last chart candle from the set timeframe.
In addition, a label shows whether it was an up or down candle.
The standard settings follow the original idea of getting the price data from the daily timeframe for day trading/scalping, but
since this indicator is fully customizable, you can also set a different timeframe.
Based on the drawn price lines, you can then also display Fibonacci levels.
This function can also be
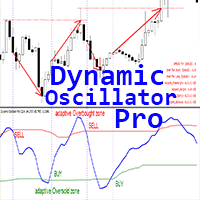
Dynamic Oscillator Pro - 是一种高级自定义 Crypto_Forex 指标 - 适用于 MT4 的高效交易工具!
- 新一代振荡器 - 查看图片以了解如何使用它。 - 动态振荡器具有自适应超卖/超买区域。 - 振荡器是一种辅助工具,用于从超卖/超买区域找到准确的切入点。 - 超卖值:低于绿线,超买值:高于红线。 - 它比标准振荡器更准确。 - 指标具有内置移动和 PC 警报。 - 它具有信息价差掉期显示 - 它显示所连接的外汇对的当前价差和掉期。 - 显示屏还显示账户余额、净值和保证金。 - 可以将信息价差掉期显示定位在图表的任何角落: 0 - 左上角,1 - 右上角,2 - 左下角,3 - 右下角。
// 更多出色的专家顾问和指标可在此处找到: https://www.mql5.com/en/users/def1380/seller 这是仅在此 MQL5 网站上提供的原创产品
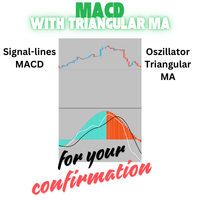
This indicator uses the signal lines of the MACD and uses Triangular MA as Oscillator. It is a good addition to trading decisions and part of the OH strategy.
Optimal trade confirmation occurs when the signal lines of the MACD coincide with the trend color of the Triangular Oscillator.
Of course everything important can be changed.
This indicator is part of the OH-Strategy, you can view other indicators of this strategy if you click on my name as a seller.

Spread & Candle Close Timer Indicator for MT4 Optimize your trading with this lightweight and efficient indicator, designed to display the real-time spread and candle close countdown directly on your MT4 chart. Features: Live Spread Monitoring – Instantly see market conditions. Candle Close Timer – Stay prepared for the next price movement. Simple & Non-Intrusive Design – No unnecessary settings, just clear and accurate data. Ideal for scalpers, day traders, and those who need real-time exec
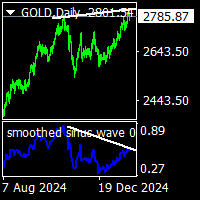
smoothed sinus wave indicator is new concept of sinus wave indicator. it gives less divergency then sinus wave indicator. minimum value for cnt number is 500.it can be increase acording to chart bar numbers. there is wave to set default 500. it can lower weekly and mountly chart down to 100. on pictures divergency lines and letters has been drawn by hand.to explain how it works.

Principle of Operation 1. Data Retrieval:
The indicator gathers real-time data on the trading instrument, including: Minimum and maximum lot sizes Tick value Spread Number of digits Account data (balance, currency) 2. Connection Check:
If there is no connection to the broker, a message is displayed on the chart, and no further calculations are performed. 3. Optimal Lot Size Calculation: Risk Determination: The indicator considers the specified risk value (e.g., 2% of the account balance) and

Levels price is a mt4 indicator that shows various levels to enter the market based on indicator calculations. The indicator consists of the following buffers; Red buffer Blue buffer Purple buffer The blue buffer is the resistance level where price is expected to bounce back. The red buffer is the support level based on the current market price. There is also a purple buffer below red buffer that can indicate the current support and resistance levels have been breached when price crosses this p

Mt support and resistance is an indicator that shows various levels to buy or sell based on prevailing market conditions. The main basis of the indicator is support levels and resistance levels. It consists of; Red buffer Blue buffer Purple buffer The blue buffer is resistance level where price is supposed to return back. The red buffer is the support level where price should bounce back.

Previous day levels is a mt4 indicator that shows various levels to buy or sell in the market based on prevailing market conditions. The main theory behind this indicator is support and resistance levels. The indicator uses previous day values in calculations to get the support and resistance levels for the next day period. This indicator consists of two purple buffers. The top buffer is the resistance level and the bottom buffer is the support level.
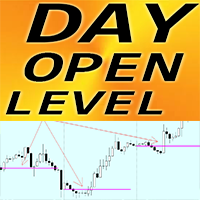
Crypto_Forex 指标 MT4 的日开盘价。
- 指标“日开盘价”是非常有用的辅助指标。 - 日开盘价非常重要,因为价格在白天经常会回到该区域。 - 指标显示每天的日开盘线。 - 它对日内交易者设置目标或用作支撑/阻力区域很有用。 - 日开盘价指标可用于反转日内交易。 ................................................................................................................... // 更多优秀的专家顾问和指标可在此处获得: https://www.mql5.com/en/users/def1380/seller 它是仅在此 MQL5 网站上提供的原创产品。
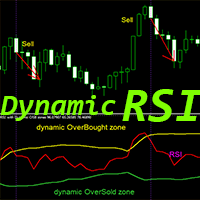
Crypto_Forex 指标“带动态超卖/超买区域的 RSI”适用于 MT4,无需重绘。
- RSI 是最受欢迎的交易震荡指标之一 - 非常适合剥头皮交易。 - 从动态超买区域进行卖出交易,从动态超卖区域进行买入交易,效果非常好。 - RSI 震荡指标对于背离检测也非常有用。 - 此指标非常适合与超卖/买入区域的价格行为交易相结合。 - 动态超买区域 - 高于黄线。 - 动态超卖区域 - 低于绿线。 - 带有 PC 和移动警报。 .................................................................................................................... // 更多出色的专家顾问和指标可在此处获得: https://www.mql5.com/en/users/def1380/seller 这是仅在此 MQL5 网站上提供的原创产品。
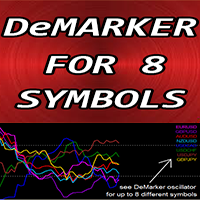
适用于 MT4 的外汇指标“DeMarker for 8 Symbols”,无需重绘。
- DeMarker 振荡器曲线指示指标计算期间当前价格相对于先前高点和低点的位置。 - DeMarker 提供其他振荡器中最有效的常规背离信号。 - 在超买区域(高于 0.7)中以常规背离进行卖出入场,在超卖区域(低于 0.3)中以常规背离进行买入入场,效果非常好。 - “DeMarker for 8 Symbols” 让您有机会在 1 张图表上控制多达 8 个不同符号的 DeMarker 值。 - 此指标非常适合与超卖/买入区域的价格行动入场相结合。
// 更多出色的专家顾问和指标可在此处获得: https://www.mql5.com/en/users/def1380/seller 这是仅在此 MQL5 网站上提供的原创产品。

Inside Candle Indicator for MT4 The Inside Candle Indicator is a simple yet effective tool for identifying inside bar formations on the chart. Inside candles signal market consolidation , often leading to breakout opportunities. Features: Automatically detects inside bars and marks them with a small dot below the candle.
Helps traders spot potential breakout zones and areas of market compression.
Works on all timeframes and asset classes , making it versatile for different trading strategi
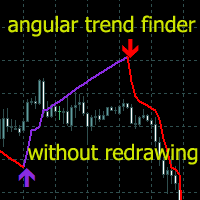
趋势指标是用于金融市场交易的技术分析领域之一。
Angular Trend Lines - 全面确定趋势方向并产生入场信号。除了平滑蜡烛的平均方向
它还利用趋势线的倾斜角度。构建江恩角度的原理被当作倾斜角度的基础。
技术分析指标结合了烛台平滑和图表几何。
趋势线和箭头有两种类型:红线和箭头表示看涨方向。紫线和箭头表示看跌方向。
指示器功能
该指标使用简单、参数配置方便,可用于趋势分析和接收开仓信号。
指示器不会重新绘制,箭头出现在蜡烛的收盘处。
当信号发生时提供多种类型的警报。
可用于任何金融工具(外汇、加密货币、金属、股票、指数)。
该指标可以在任何时间范围和图表上发挥作用。
该指标采用轻量级算法,不加载处理器,确保在多个窗口中使用。
根据时间范围和交易方法选择参数。
主要输入参数
Period - 用于分析计算的蜡烛数量。
Angle ——趋势线的斜率。
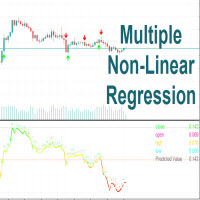
Multiple Non-Linear Regression MT4 This indicator is designed to perform multiple non-linear regression analysis using four independent variables: close, open, high, and low prices. Here's a components and functionalities: Inputs: Normalization Data Length: Length of data used for normalization. Learning Rate: Rate at which the algorithm learns from errors. Show data points: Show plotting of normalized input data(close, open, high, low) Smooth?: Option to smooth the output. Smooth Length: Lengt
How Antabod Stochastic Works Antabod Stochastic is a cutting-edge technical indicator designed to analyze market momentum and identify overbought and oversold conditions with unparalleled precision. Here's a breakdown of how it works and what makes it a game-changer for traders: ________________________________________ 1. Core Concept At its heart, Antabod Stochastic is based on the stochastic oscillator principle, which measures the position of a current price relative to its range over a spec

This indicator overlays higher timeframe candles on the lower timeframe chart. You have option to make the candles Hollow (outline) or Solid (fill) for better visibility and analysis of your charts. You can easily change your chart timeframes ( to any lower timeframe than the indicator input) while using this indicator for true multi-timeframe analysis.
Features: Timeframes from 1 Min to 1 Month Minimal Inputs Customize candle body, color etc.
Inputs: Candles Period - Choose the timeframe f
In trading, it is important to trade at the right time, which is why it is advantageous to use this indicator to display the opening of the foreign exchange markets. Define your personal trading times by setting these times with an adjustable background color. You can switch this indicator on and off using a button on the chart. This indicator is part of the OH strategy; you can view other indicators of this strategy by clicking on my name as a seller.

Two modified triangular MA as upper and lower bands that show the trend by changing color. If both MAs show the same color, a confirmed trend is present. The indicator can be switched on and off using a button on the chart. This indicator is part of the OH strategy. You can view other indicators of this strategy if you click on my name as a seller.
Take a look to my other indicator....

An indicator based on the Bollinger Bands principle, modified by scaled calculation of standard deviations and combined into oscillator bands make this indicator special. An up and down trend is displayed clearly and concisely and, in addition, the integrated levels 70 and 90 show the possible end of the trend or the possibility of consolidation. This indicator is part of the OH strategy. You can view other indicators of this strategy if you click on my name as a seller.
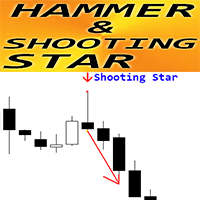
Crypto_Forex 指标“锤子和射击之星模式”适用于 MT4。
- 指标“锤子和射击之星模式”是价格行为交易的非常强大的指标:无需重绘,无延迟。 - 指标检测图表上的看涨锤子和看跌射击之星模式: - 看涨锤子 - 图表上的蓝色箭头信号(见图片)。 - 看跌射击之星 - 图表上的红色箭头信号(见图片)。 - 带有 PC、手机和电子邮件警报。 - 指标“锤子和射击之星模式”非常适合与支撑/阻力位结合使用。 ................................................................................................................... // 更多出色的专家顾问和指标可在此处获得: https://www.mql5.com/en/users/def1380/seller 这是仅在此 MQL5 网站上提供的原创产品。
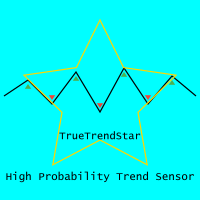
Advanced True Trend Detector known as TrueTrendStar(TTS) is a very Sensitive Highly Predictive indicator of Price Trends for Professional traders. ( Feb Month End Sale-Massive Discount of 30% !!! Sale off!!! ) This indicator detects advanced signals of high odds changes in Price Trend direction long before other indicator detects it. I have been working on it since 2019. This is possible due to fractal nature of forex and other financial markets,which this indicator exploits and capture

Fair Value Gap (FVG) Indicator with Clear Trendlines Identify Fair Value Gaps (FVGs) like a pro! This powerful MQL4 indicator marks Bullish and Bearish FVGs with clear, precise trendlines , giving you a visual edge in spotting high-probability trading opportunities. Key Features: Two Trendlines per FVG : Clearly marks the top and bottom of each FVG zone for easy identification. No Rays : Trendlines are clean and concise, ensuring a clutter-free chart. Customizable Colors : Personal
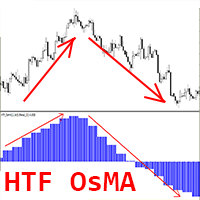
Crypto_Forex 指标 HTF OsMA 振荡器适用于 MT4。
- HTF OsMA 是市场上最好的趋势指标之一。HTF 表示 - 更高时间框架。 - 此指标非常适合具有价格行动条目或与其他指标结合使用的多时间框架交易系统。 - HTF OsMA 指标允许您将更高时间框架的 OsMA 附加到当前图表 --> 这是专业的交易方法。 .................................................................................................................... // 更多出色的专家顾问和指标可在此处获得: https://www.mql5.com/en/users/def1380/seller 它是仅在此 MQL5 网站上提供的原创产品。
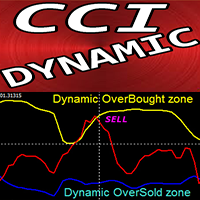
Crypto_Forex 指标“CCI 带动态超卖/超买区域”适用于 MT4,无需重绘。
- 商品通道指数 (CCI) 非常适合将动量交易纳入趋势方向。 - 非常适合从动态超买区域采取卖出入场,从动态超卖区域采取买入入场,进入主要趋势方向。 - 此指标也非常适合与价格行动入场相结合。 - 动态超买区域 - 高于黄线。 - 动态超卖区域 - 低于蓝线。 - CCI 振荡器测量当前价格与历史平均价格之间的差异。 - 带有 PC 和移动警报。 .................................................................................................................... // 更多出色的专家顾问和指标可在此处获得: https://www.mql5.com/en/users/def1380/seller 这是仅在此 MQL5 网站上提供的原创产品。

This indicator looks at daily, weekly, and monthly data and tells you how often those levels get "tested" or touched. In other words, you can see how reliable a particular level has been historically and whether the price is likely to visit it. Easy Customization:
You can tweak the number of days, weeks, or months the indicator checks, as well as adjust the tolerance for what counts as a “touch.” Plus, you can easily turn the pivot lines or the labels on and off to keep your chart as busy—or as
学习如何在MetaTrader AppStore上购买EA交易,MetaTrader平台的应用程序商店。
MQL5.community支付系统支持通过PayPay、银行卡和热门付款系统进行交易。为更好的客户体验我们强烈建议您在购买前测试EA交易。
您错过了交易机会:
- 免费交易应用程序
- 8,000+信号可供复制
- 探索金融市场的经济新闻
注册
登录