YouTubeにあるマーケットチュートリアルビデオをご覧ください
ロボットや指標を購入する
仮想ホスティングで
EAを実行
EAを実行
ロボットや指標を購入前にテストする
マーケットで収入を得る
販売のためにプロダクトをプレゼンテーションする方法
MetaTrader 4のための有料のテクニカル指標 - 116

Just Trade Indicator – 正確でストレスフリーなトレードのための最強の味方!
Just Trade Indicator は、MetaTrader 5 向けに設計された究極のインジケーターで、市場の明確なエントリーおよびエグジットポイントを特定するのに役立ちます。高度なアルゴリズムを活用し、直感的な視覚シグナルを提供することで、簡単かつ効率的なトレードを実現します。 Just Trade Indicator を選ぶ理由
明確で正確なシグナル – 買い・売りシグナルを直感的な矢印でチャートに直接表示し、解釈の曖昧さを排除。
マルチタイムフレーム & マルチアセット対応 – 通貨ペア、株式、指数、仮想通貨など、すべての市場で使用可能。M1 から月足まで対応。
リペイントなし – 生成されたシグナルは変更されたり消えたりせず、長期的な信頼性を保証。
どんなトレードスタイルにも対応 – スキャルピング、デイトレード、スイングトレード、どの手法にも最適。
統計情報を表示 – シグナルの成功率をチャート上で直接確認可能。 使い方
Just T

This indicator overlays higher timeframe candles on the lower timeframe chart. You have option to make the candles Hollow (outline) or Solid (fill) for better visibility and analysis of your charts. You can easily change your chart timeframes ( to any lower timeframe than the indicator input) while using this indicator for true multi-timeframe analysis.
Features: Timeframes from 1 Min to 1 Month Minimal Inputs Customize candle body, color etc.
Inputs: Candles Period - Choose the timeframe f
In trading, it is important to trade at the right time, which is why it is advantageous to use this indicator to display the opening of the foreign exchange markets. Define your personal trading times by setting these times with an adjustable background color. You can switch this indicator on and off using a button on the chart. This indicator is part of the OH strategy; you can view other indicators of this strategy by clicking on my name as a seller.
Two modified triangular MA as upper and lower bands that show the trend by changing color. If both MAs show the same color, a confirmed trend is present. The indicator can be switched on and off using a button on the chart. This indicator is part of the OH strategy. You can view other indicators of this strategy if you click on my name as a seller.
Take a look to my other indicator....

An indicator based on the Bollinger Bands principle, modified by scaled calculation of standard deviations and combined into oscillator bands make this indicator special. An up and down trend is displayed clearly and concisely and, in addition, the integrated levels 70 and 90 show the possible end of the trend or the possibility of consolidation. This indicator is part of the OH strategy. You can view other indicators of this strategy if you click on my name as a seller.
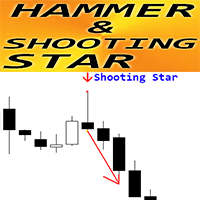
Crypto_Forex インジケーター「ハンマーとシューティング スター パターン」MT4 用。
- インジケーター「ハンマーとシューティング スター パターン」は、プライス アクション トレーディングに非常に強力なインジケーターです。再描画なし、遅延なし。 - インジケーターは、チャート上の強気のハンマーと弱気のシューティング スター パターンを検出します。 - 強気のハンマー - チャート上の青い矢印信号 (画像を参照)。 - 弱気のシューティング スター - チャート上の赤い矢印信号 (画像を参照)。 - PC、モバイル、および電子メール アラート付き。 - インジケーター「ハンマーとシューティング スター パターン」は、サポート/レジスタンス レベルと組み合わせるのに最適です。
// より優れたエキスパート アドバイザーとインジケーターは、こちらで入手できます: https://www.mql5.com/en/users/def1380/seller これは、この MQL5 Web サイトでのみ提供されるオリジナル製品です。
Advanced Detector of Trend Reversal and Continuance known as TrueTrendStar(TTS) is a sensitive and Predictive indicator of Price Trends for Professional traders. ( WEEKEND DISCOUNT 15% OFF !!! ) ( ATTENTION BUYERS:- PLEASE CONTACT ME FOR HOW BEST TO USE THE INDICATOR FOR MAXIMUM PROFITS )
This indicator detects advanced signals of high odds changes in Price Trend direction long before other indicator detects it. I have been working on it since 2019. This is possible due to fractal nat

Fair Value Gap (FVG) Indicator with Clear Trendlines Identify Fair Value Gaps (FVGs) like a pro! This powerful MQL4 indicator marks Bullish and Bearish FVGs with clear, precise trendlines , giving you a visual edge in spotting high-probability trading opportunities. Key Features: Two Trendlines per FVG : Clearly marks the top and bottom of each FVG zone for easy identification. No Rays : Trendlines are clean and concise, ensuring a clutter-free chart. Customizable Colors : Personal
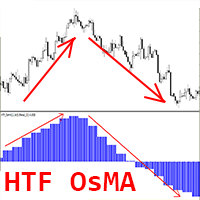
Crypto_Forex インジケーター HTF OsMA オシレーター (MT4 用)。
- HTF OsMA は、市場で最も優れたトレンド インジケーターの 1 つです。HTF は、Higher Time Frame を意味します。 - このインジケーターは、プライス アクション エントリを使用するか、他のインジケーターと組み合わせて使用する、マルチタイム フレーム トレーディング システムに最適です。 - HTF OsMA インジケーターを使用すると、Higher Time Frame の OsMA を現在のチャートに添付できます --> これは、プロフェッショナルなトレーディング アプローチです。
// より優れたエキスパート アドバイザーとインジケーターは、こちらで入手できます: https://www.mql5.com/en/users/def1380/seller これは、この MQL5 Web サイトでのみ提供されるオリジナル製品です。
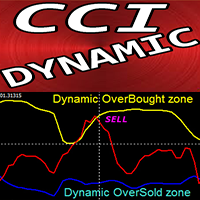
Crypto_Forex インジケーター「ダイナミック売られ過ぎ/買われ過ぎゾーン付き CCI」MT4 用、リペイントなし。
- コモディティ チャネル インデックス (CCI) は、トレンド方向へのモメンタム トレーディングに最適です。 - ダイナミック買われ過ぎゾーンから売りエントリーを取り、ダイナミック売られ過ぎゾーンからメイン トレンドの方向に買いエントリーを取るのに最適です。 - このインジケーターは、プライス アクション エントリーと組み合わせるのにも最適です。 - ダイナミック買われ過ぎゾーン - 黄色の線より上。 - ダイナミック売られ過ぎゾーン - 青線より下。 - CCI オシレーターは、現在の価格と過去の平均価格の差を測定します。 - PC およびモバイル アラート付き。
// より優れたエキスパート アドバイザーとインジケーターは、こちらで入手できます: https://www.mql5.com/en/users/def1380/seller これは、この MQL5 Web サイトでのみ提供されるオリジナル製品です。

This indicator looks at daily, weekly, and monthly data and tells you how often those levels get "tested" or touched. In other words, you can see how reliable a particular level has been historically and whether the price is likely to visit it. Easy Customization:
You can tweak the number of days, weeks, or months the indicator checks, as well as adjust the tolerance for what counts as a “touch.” Plus, you can easily turn the pivot lines or the labels on and off to keep your chart as busy—or as
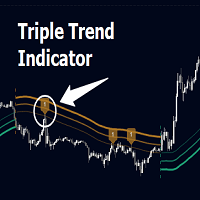
Triple Trend Indicator is a versatile trend-following tool designed to help traders identify trend strength and potential pullback levels using a three-band system. Each band represents a varying degree of price deviation from the mean, providing progressively stronger trend signals.
Key Features:
Three Adaptive Bands:
The indicator dynamically calculates three bands (1, 2, and 3) based on moving averages (SMA, EMA, WMA) and ATR multipliers.
Bands are positioned below the price in a

Presenting UMS Scanner – Your Ultimate Edge in the MT4 Marketplace! https://youtube.com/shorts/znUdz5PEBAY?feature=share Unlock the secrets of the market with the ground-breaking UMS Scanner (Universal Market Strategy) – a revolutionary tool designed to empower traders like you. Say goodbye to overwhelming market noise and hello to precision, insight, and unparalleled trading confidence. Cut Through the Clutter:
In today’s fast-paced trading world, deciphering valuable signals from market nois

DTM チャネル インジケーターは、チャネルまたは三角形を作成するトップ、ボトム、高速トレンドラインをインタラクティブに描画します。 いずれかのトレンドラインがいずれかの側から価格に触れた場合、設定に従ってアラートが送信されます。 非常にシンプルで、トレンドラインの色とアラートのみを設定する必要があります。 このインジケーターは、使用している他のインジケーターにも役立ちます。 準備完了! https://www.mql5.com/en/users/gabedk/seller このインジケーターは、Daytrademonkey 取引システムの一部です。 DTM chaneru injikētā wa, chaneru matawa sankakkei o sakusei suru toppu, botomu, kōsoku torendo rain o intarakutibu ni byōga shimasu. Izureka no torendo rain ga izureka no soba kara kakaku ni fureta baai, settei ni shitag
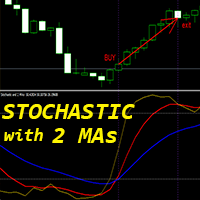
Crypto_Forex インジケーター「ストキャスティクスと 2 つの移動平均」MT4 用、リペイントなし。
- ストキャスティクス オシレーターは市場で最も優れたインジケーターの 1 つで、多くのトレーダーにとって最適なツールです。 - 「ストキャスティクスと 2 つの移動平均」インジケーターを使用すると、ストキャスティクス オシレーターの高速移動平均と低速移動平均を確認できます。 - 買われすぎゾーン - 80 以上、売られすぎゾーン - 20 以下。 - 80 以上のゾーンから売りエントリーし、20 以下から買いエントリーすると効果的です。 - 買いと売りのエントリー条件は画像で確認できます。 - 買い (売り) シグナル条件を検討します: (1) - 売られすぎ (買われすぎ) で高速 MA が低速 MA を上向き (下向き) に交差: 買い (売り) トレードを開きます。 (2) - ストキャスティクス値が買われすぎゾーンで高速 MA を下向きに交差 (売られすぎゾーンで高速 MA を上向きに交差): 買い (売り) トレードを終了します。
// より優れたエキスパー
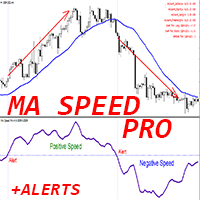
Crypto_Forex インジケーター「MA Speed Pro」、MT4 用、リペイントなし。
移動平均の速度 - ユニークなトレンドインジケーターです。
- このインジケーターの計算は、物理学の方程式に基づいています。 - 速度は移動平均の 1 次導関数です。 - MA Speed Pro インジケーターは、MA 自体がどれだけ速く方向を変えるかを示します。 - MA Speed Pro を使用すると、標準戦略でもアップグレードする機会がたくさんあります。SMA、EMA、SMMA、LWMA に適しています。 - トレンド戦略では、インジケーターの値が < 0 の場合: トレンドが下降し、インジケーターの値が > 0 の場合: トレンドが上昇するため、MA Speed Pro を使用することをお勧めします。 - 時間枠 - 任意。取引ペア - 任意。 - インジケーターには、モバイルおよび PC アラートが組み込まれています。 - 情報スプレッド スワップ表示 - 接続されている外国為替ペアの現在のスプレッドとスワップを表示します。 - ディスプレイには、アカウント残高、エク

FX Sweeps is an indicator that gives non repaint arrows in liquidity sweep areas
It uses a combination of calculations including volume divergence, Average True Range and the average of previous high and lows
The indicator can be used for reversal trades or binary options - Please see screenshots
Symbol: Any Timeframe: 5m - 4H
Please test thoroughly in strategy tester before purchase!
Any questions - Send me a message
Enjoy! -----------------

FVG & iFVG Alert indicator for MT4
- it is coded to detect freshest untouched FVG, both bullish and bearish, it draws lines for the FVG making it clear - when price reaches these levels it will alert upon candle close that price is potentially breaking this FVG or retesting it - price might hold and will then be FVG or it might inverse and become an iFVG - good for alerting you when to look at chart, then execute depending on trading system

Easy Trade Indicator – Your Path to Profitable Trades! Work any Time Frame! Maximize your profits with precise and assertive trades!
️ Trade with comfort – the indicator does the analysis and you only open the order in the direction in which the indicator shows you!
Exclusive panel with past trade counter and accuracy tracking! Simplify your analysis, boost your performance, and trade with confidence! Get it now and take your trading to the next level

ICT Killzone Indicator – Master the Market’s Key Trading Sessions Unlock the true potential of Institutional Order Flow with the ICT Killzone Indicator , designed for serious traders who follow Inner Circle Trader (ICT) concepts. This tool highlights the most critical trading periods—the Asia, London, and New York Killzones —allowing you to align your trades with high-probability setups used by smart money traders. Key Features: Automated Killzone Markings – The indicator dynamically plots th

Arrow Indicator for Fast Scalping
Determines the direction of movement on almost every candle.
Allows timely opening of positions in accordance with changing market conditions.
Works on all timeframes, all currency pairs, metals, indices, and cryptocurrencies.
Can be used when trading binary options.
Key Features: No settings required; Accurately determines the direction of movement; Does not repaint after the candle closes; Works on all timeframes and all trading instruments; Suitable for
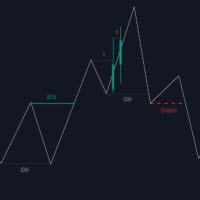
The Market Structure with Inducements & Sweeps indicator is a unique take on Smart Money Concepts related market structure labels that aims to give traders a more precise interpretation considering various factors.
Compared to traditional market structure scripts that include Change of Character (CHoCH) & Break of Structures (BOS) -- this script also includes the detection of Inducements (IDM) & Sweeps which are major components of determining other structures labeled on the chart.
SMC & pri

Arrow simulator gives buy and sell signals based on non repaint arrow logic
It also shows take profit and stop loss placement based on average true range
Also provided is a simulation panel in the corner to show how the signals performed over a set number of bars
When running in strategy tester or live lower the number of bars to reduce using pc resources and speed up back testing
Filter out arrows with the ma filter if needed and choose your trading time
Default settings is for 5m EUR/USD

*Antabod GameChanger Indicator – Transform Your Trading!*
Are you tired of chasing trends too late or second-guessing your trades? The *Antabod GameChanger Indicator* is here to *revolutionize your trading strategy* and give you the edge you need in the markets! Why Choose GameChanger?
*Accurate Trend Detection* – GameChanger identifies trend reversals with *pinpoint accuracy*, ensuring you enter and exit trades at the optimal time.
*Clear Buy & Sell Signals* – No more guesswork! T
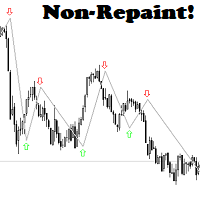
Scalper like a PRO! Trade like a PRO! Easy to use! Your profit and consistency is here! All TF and all Pairs! Just place it on the chart, select the chart and active time of your choice and follow the signals! Trade with comfort – the indicator does the analysis and you only open the order in the direction in which the indicator shows you!
finally start taking money from the market!
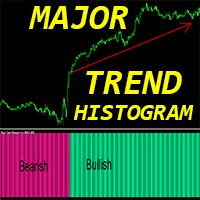
mt4のcrypto_forexインジケーター「 Major_trend_histogram 」、塗り直しはありません。
- Major_trend_histogramインジケータ本当に大きなトレンドをキャッチするように設計されています。 - インジケータは2色である可能性があります:弱気トレンドの場合はピンク、強気の場合は緑です(色は変更できます)。 - 標準のMAクロスよりも、最初の段階での傾向を検出します。 - Major_trend_histogramは、価格アクション、VSA、その他のインジケーターという他の取引方法と組み合わせることができます。 - インジケータには、モバイルおよびPCアラートが組み込まれています。
//優れた取引ロボットとインジケーターはこちらから入手できます:https:// www.mql5.com/en/users/def1380/seller このMQL5 Webサイトでのみ提供されるオリジナル製品です。

Belladonna is an advanced custom technical indicator for MetaTrader 4 based on Hull Moving Average (HMA). It visualizes the trend direction using colored lines and arrows on the chart. The indicator is optimized to minimize lag and eliminate market noise, making it especially useful for short-term and medium-term trading.
Functions and Features: Moving Average Type: Hull Moving Average (based on two EMA/SMA lines).
Calculation Methods: Support for different types of moving average (SMA, EMA,

The Hodrick-Prescott filter is a well known filtering algorithm Perfect for offline jobs it lacks realtime capabilities that are necessary in trading This is a first time a causal Hodrick-Prescott filter has been made
I was able to successfully make a causal (realtime) version of the Hodrick-Prescott algorithm which keeps the lag to a minimum as you can see on the screenshots, it is really responsive to sharp changes while retaining a high smoothing ability, making it one of the best smoothers
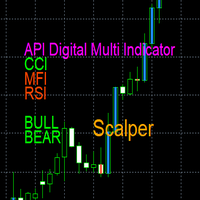
API Digital Multi Indicator Scalper – Clear Digital Display API Digital Multi Indicator Scalper , a tool that integrates RSI, MFI, CCI, Bulls and Bears into a digital display for market analysis . This indicator is designed for scalpers and short-term traders who demand clear data . Key Features: Digital Display – Monitor RSI, MFI, CCI, Bulls and Bears values in an easy-to-read digital format.
Color Changes – Visual cues help identify possible trend changes at a glance.
Adjustable
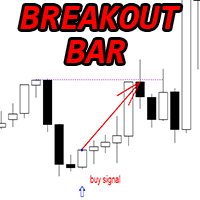
Crypto_Forex MT4 用インジケーター「ブレイクアウト バー パターン」
- インジケーター「ブレイクアウト バー パターン」は、プライス アクション トレーディングに非常に強力なインジケーターです。再描画や遅延はありません。 - インジケーターはチャート上のブレイクアウト バー パターンを検出します: - 強気ブレイクアウト バー パターン - チャート上の青い矢印信号 (画像を参照)。 - 弱気ブレイクアウト バー パターン - チャート上の赤い矢印信号 (画像を参照)。 - PC、モバイル、および電子メール アラート付き。 - インジケーター「ブレイクアウト バー パターン」は、サポート/レジスタンス レベルと組み合わせるのに最適です。
// 優れたトレーディング ロボットとインジケーターは、 https://www.mql5.com/en/users/def1380/seller から入手できます。 これは、この MQL5 Web サイトでのみ提供されるオリジナル製品です。
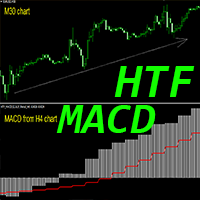
Crypto_Forex インジケーター HTF MACD オシレーター (MT4 用)。
- HTF は、Higher Time Frame (より高い時間枠) を意味します。 - MACD インジケーター自体は、トレンド トレーディングで最も人気のあるインジケーターの 1 つです。 - このインジケーターは、プライス アクション エントリを使用するマルチ時間枠トレーディング システム、または他のインジケーターとの組み合わせに最適です。 - HTF MACD インジケーターを使用すると、より高い時間枠の MACD を現在のチャートに添付できます --> これはプロフェッショナルなトレーディング アプローチです。 - インジケーターには、モバイルおよび PC アラートが組み込まれています。
// 優れたトレーディング ロボットとインジケーターは、 https://www.mql5.com/en/users/def1380/seller から入手できます。 これは、この MQL5 Web サイトでのみ提供されるオリジナル製品です。
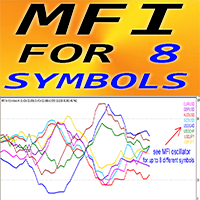
MT4 用 Forex インジケーター「MFI for 8 Symbols」、リペイントなし。
- マネーフローインデックス (MFI) は、価格とボリュームデータを使用して売られすぎと買われすぎのゾーンを識別するテクニカルオシレーターです。 - MFI が 80 を超える場合は買われすぎから売りエントリーし、20 を下回る場合は売られすぎから買いエントリーするのに最適です。 - MFI はダイバージェンス検出に非常に役立ち、プライスアクションと組み合わせるのも最適です。 - 「MFI for 8 Symbols」では、1 つのチャートで最大 8 つの異なるシンボルの MFI 値を制御できます。 - MFI オシレーターは、強気と弱気の価格モメンタムに関する情報を提供します。
// 優れたトレーディングロボットとインジケーターは、 https://www.mql5.com/en/users/def1380/seller から入手できます。 これは、この MQL5 ウェブサイトでのみ提供されるオリジナル製品です。
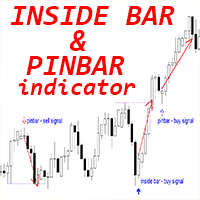
Crypto_Forex インジケーター「インサイドバー & ピンバーパターン」MT4 用。
- インサイドバー & ピンバーパターンは、プライスアクション取引に非常に強力です - 再描画なし、遅延なし。 - インジケータは、チャート上のインサイドバーとピンバーパターンを検出します: - 強気パターン - チャート上の青い矢印信号 (画像を参照)。 - 弱気パターン - チャート上の赤い矢印信号 (画像を参照)。 - インサイドバー自体の R/R 比率 (報酬/リスク) が高い。 - PC、モバイル、および電子メールアラート付き。 - インサイドバー & ピンバーパターンは、サポート/レジスタンスレベルと組み合わせるのに最適です。
// 優れたトレーディングロボットとインジケーターは、こちらで入手できます: https://www.mql5.com/en/users/def1380/seller これは、この MQL5 ウェブサイトでのみ提供されるオリジナル製品です。

Trend NonLag Indicator is a professional and easy to use Forex, Crypto and CFDs trading system which is based on the best principles of trading using the Swing High and Swing Low and Price Action strategy. The indicator provides accurate BUY and SELL signals. You can trade even on the go using PUSH notifications. Probably you already heard about the Swing High and Swing Low trading methods before. Usually the Swing High/Low is a very complex thing not only for newbie traders but also for th

ORDER BLOCKS REVERSAL
Reversal Trading involves identifying points where an asset's price direction changes, capitalizing on potential profits from such shifts. Spotting reversals requires analyzing price patterns and volume indicators.
Key indicators include moving averages, RSI, and MACD, which help traders predict potential trend shifts. This indicator show us potential reversal points using ORDER BLOCKS.
While Reversal Trading offers potentially high reward opportunities by entering earl
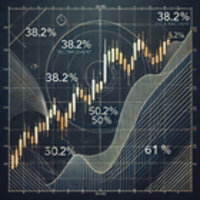
Indicador de Fibonacci Semanal para MT4 Maximize suas operações no mercado financeiro com o Indicador de Fibonacci Semanal para MetaTrader 4 (MT4) , a ferramenta essencial para traders que buscam identificar pontos estratégicos de suporte e resistência com base na ação do preço da última semana. Principais Recursos: Atualização Automática : O indicador recalcula os níveis de Fibonacci automaticamente a cada novo candle semanal. Níveis Personalizados : Traça apenas os níveis essenciais de Fibonac
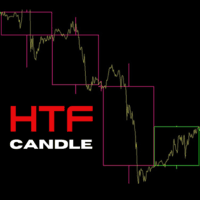
ICT Traders! Here's another cool Indicator that will allow to trade the HTF narrative while focus on price action on your entry timeframes. The following are the input for setup the indicator: Maximum Bar: The number of HTF bar you want to display High Timeframe: the Timeframe which narrative you want to base on and trade from the lower timeframe. Visual Timeframe: the largest Timeframe the indicator will print the HTF candles. Bullish Candle: The color of the bullish candle Bearish Candle: The
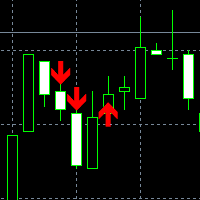
This is Binary option indicator mt4 for one candle expiry, also can be used for forex Higher Timeframes like H4,D1,W1, it is very accurate no lags no repaints, before you purchase you can ask me any question you may recon with feel free to contact me, Indicator Buffers are 0 for buy and 1 for sell, it Draws arows immidiate;
Alerts has been included; Push Notification has been included;
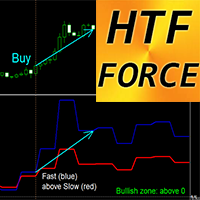
Crypto_Forex インジケーター HTF Force Oscillator for MT4。
- HTF Force は、マルチタイムフレーム取引用の強力なインジケーターです。HTF は、Higher Time Frame を意味します。 - Force インデックスは、価格とボリュームのデータを 1 つの値に組み合わせるトップ インジケーターの 1 つです。 - Higher Time Frame の値は、トレンドの方向 (下降トレンド - 0 未満、上昇トレンド - 0 超) を示します。 - Fast Force_indicator - 青線、Slow Force_indicator - 赤線。 - 買いシグナル - Fast ラインが Slow ラインを上向きに交差し、両方とも 0 を超えています (画像を参照)。 - 売りシグナル - Fast ラインが Slow ラインを下向きに交差し、両方とも 0 未満です (画像を参照)。 - インジケーターには、モバイルおよび PC アラートが組み込まれています。
// 素晴らしいトレーディング ロボットとインジケーター

ZigZag mod ko'rsatkichi - kuchli texnik tahlil vositasi ZigZag mod ko'rsatkichi nima? ZigZag Mod indikatori treyderlarga foreks, fond va kriptovalyuta bozorlarida narxlarning asosiy burilish nuqtalarini aniqlashga yordam berish uchun mo'ljallangan texnik tahlil vositasidir . Bozor shovqinini filtrlaydi va trend yo'nalishini aniq ingl . Asosiy xususiyatlar Trendning o'zgarishini aniqlaydi - bozor yo'nalishini ko'rsatish uchun asosiy yuqori va past darajalarni ta'kidlaydi.
Narxlarning keraksiz o
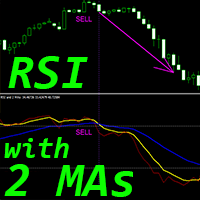
Crypto_Forex インジケーター「RSI と 2 つの移動平均」MT4 用、リペイントなし。
- このインジケーターは、モメンタム トレーディング システムに最適です。 - 「RSI と 2 つの MA」インジケーターを使用すると、RSI 自体の高速移動平均と低速移動平均を確認できます。 - このインジケーターを使用すると、トレンドの変化を非常に早く確認できます。 - 「RSI と 2 つの MA」を使用すると、買われすぎ/売られすぎゾーンからトレンド方向への勢いを捉えることができます。 - このインジケーターは、パラメーターを使用して簡単に設定できます。 - このインジケーターは、任意の時間枠で使用できます。
// 優れたトレーディング ロボットとインジケーターは、 https://www.mql5.com/en/users/def1380/seller から入手できます。 これは、この MQL5 Web サイトでのみ提供されるオリジナル製品です。
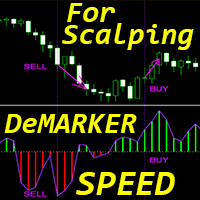
Crypto_Forex インジケーター「DeMarker Speed」、MT4 用、リペイントなし。
- このインジケーターの計算は、物理学の方程式に基づいています。DeMarker Speed は、DeMarker 自体の 1 次導関数です。 - DeMarker オシレーター曲線は、インジケーターの計算期間中の以前の高値と安値に対する現在の価格位置を示します。 - DeMarker Speed インジケーターは、高速スキャルピング エントリに適しています (画像で確認できます)。 - DeMarker Speed は、DeMarker 自体が方向を変える速度を示します。非常に敏感です。 - DeMarker Speed インジケーターの値が < 0 の場合: 速度は負です。DeMarker Speed インジケーターの値が > 0 の場合: 速度は正です。 - インジケーターには、モバイルおよび PC アラートが組み込まれています。
// 優れたトレーディング ロボットとインジケーターは、こちらで入手できます: https://www.mql5.com/en/users/d
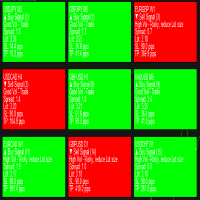
Introducing Telos Dashboard Indicator – Your Ultimate Trading Companion Optimized For Forex!
Note: This is a dashboard indicator and won't work on the strategy tester, demoing it there is a waste. Instead get the main indicator or, use the demo of DynamicCOG to see how it works with arrows, although Telos is a more refined and filtered version than the DynamicCOG indicator. Never Miss a Trading Opportunity Again!
Welcome to the future of trading with the Telos Dashboard Indicator ! Inspired b
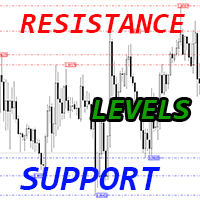
Crypto_Forex MT4 用インジケーター「サポート レジスタンス レベル」
- インジケーター「サポート レジスタンス レベル」は、取引に非常に役立つ補助インジケーターです。 - 「サポート」と「レジスタンス」は、価格が尊重するチャート上の重要なゾーンです。 - サポート レベルは、価格が定期的に下落を止めて跳ね返る場所です。 - レジスタンス レベルは、価格が通常上昇を止めて下落する場所です。 - インジケーター「サポート レジスタンス レベル」は、最近のレベルを表示します: レジスタンス レベル - 赤い線。サポート レベル - 青い線。 - 計算に使用するバーの数、線の種類、色は設定で調整できます。 - インジケーター「サポート レジスタンス レベル」は、価格アクション パターンを使用して、テイク プロフィット ターゲット、価格反転、再テストを計画するのに最適です。
// 素晴らしいトレーディング ロボットとインジケーターは、こちらから入手できます: https://www.mql5.com/en/users/def1380/seller これは、この MQL5

MamchenkoTrend Complex - высокоточный индикатор, показывающий смену тенденций на рынке. Индикатор не перерисовывает сигнал после закрытия свечи. Дает вам уровень стопа для вашей сделки по его сигналам. Отлично подходит для ручной торговли и в разработке в АТС (автоматические торговые системы) Настройки можно использовать по умолчанию , а также подбирать самостоятельно . На скриншотах изображен один и тот же участок графика пары GBPUSD на тайме Н4 но с разными настройками . На первом рисунке зн
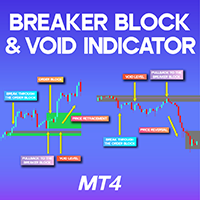
Breaker Block and Void Indicator MT4
The Breaker Block + Void Indicator is a valuable tool in MetaTrader 4, designed to pinpoint crucial price levels. A breaker block refers to a specific type of Order Block that initially gets breached by price action, later turning into a significant pullback zone. This indicator visually represents bullish breaker blocks in green and bearish breaker blocks in red , while those that have already been consumed are marked in gray for clarity. «Indicator Install
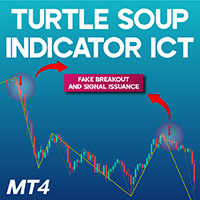
Turtle Soup Indicator ICT for MT4
The Turtle Soup Indicator for MetaTrader 4 is a well-known trading pattern within the ICT (Inner Circle Trader) methodology. It specializes in identifying false price breakouts , helping traders recognize situations where the price movement is deceptive. When market conditions align, the indicator provides an entry signal in the opposite direction of the breakout, making it highly effective for reversal trading strategies . This tool features a straightforward

Epsilon Trend computes a smoothed price line by first normalizing the price over a lookback period and then smoothing the result with a simple moving average. The smoothed normalized value is then re‑scaled to price so it appears as an overlay similar to a MA.
The color change is computed by comparing the current bar’s smoothed value with that of the previous bar and only switching trend if the difference exceeds a small threshold (epsilon) thus minimizing constant flickering.
Use on an
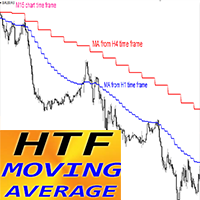
Crypto_Forex インジケーター HTF 移動平均 MT4 用。
- MT4 用のプロフェッショナル HTF MA インジケーターで取引方法をアップグレードします。HTF は - より高い時間枠を意味します。 - このインジケーターは、価格アクション エントリを使用するトレンド トレーダーに最適です。 - HTF MA インジケーターを使用すると、より高い時間枠からの移動平均を現在のチャートに添付できます。 - インジケーターはより高い時間枠からのトレンドを示します --> これは常に収益性の高い方法です。 - HTF MA インジケーターは、低リスクで大きな利益を得る機会を提供します。
使用方法: - D1 から H4 または H1 チャートに MA を添付します。 - H4 から H1、M30、または M15 チャートに MA を添付します。 - など (画像を参照)。
// 優れた取引ロボットとインジケーターは、こちらで入手できます: https://www.mql5.com/en/users/def1380/seller これは、この MQL5 Web サイトで

VWAP (Value Weighted Average Price) is an indicator of market makers and banks. It is used by professional traders for intraday, weekly and long-term trading. If you are not familiar with it yet, it is high time to figure it out. How does VWAP work? VWAP shows the volume-weighted average price over a certain period. Its calculation takes into account both the price change and the volume of transactions in each candle. Candles with a higher volume have a greater impact, which increases the ac
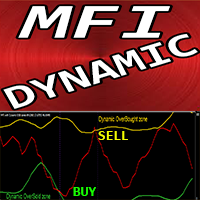
Crypto_Forex インジケーター「ダイナミックな売られ過ぎ/買われ過ぎゾーンを備えた MFI」MT4 用、リペイントなし。
- Money_Flow_Index (MFI) は、価格とボリュームのデータを使用して売られ過ぎと買われ過ぎのゾーンを識別するテクニカル オシレーターです。 - ダイナミックな買われ過ぎゾーンから売りトレードを行い、ダイナミックな売られ過ぎゾーンから買いトレードを行うのに最適です。 - MFI はダイバージェンスの検出に非常に役立ち、プライス アクションと組み合わせるのも最適です。 - ダイナミックな買われ過ぎゾーン - 黄色の線より上。 - ダイナミックな売られ過ぎゾーン - 緑の線より下。 - MFI オシレーターは、強気と弱気の価格モメンタムに関する情報を提供します。 - PC およびモバイル アラート付き。
// 優れたトレーディング ロボットとインジケーターは、こちらで入手できます: https://www.mql5.com/en/users/def1380/seller これは、この MQL5 Web サイトでのみ提供されるオリジナル製
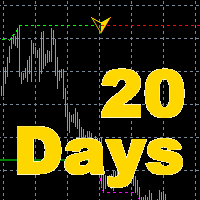
The indicator is the main part of Michael Huddleston's ICT (Inner Circle Trader) trading strategy. His legendary trading strategy is based on the concept of "Smart Money". To analyze the medium -term trend , the ICT offers an analysis based on twenty -day levels . The indicator builds levels , while showing the turning points with arrows . An important feature of the indicator is the automatic display of levels for different periods . You do not have to change the indicator settings when chang

Smart Key Levels Indicator for MT4 - Advanced Support & Resistance Tool The Smart Key Levels Indicator is a professional-grade tool for traders seeking precise support and resistance levels. Using advanced algorithms, it identifies key price levels with dynamic strength scoring, volume filtering, and higher timeframe confluence. Perfect for all trading styles and timeframes, this indicator provides clear visual signals with customizable settings. Available for both MT4 and MT5 platforms. Unl

ATR Navigator A professional-grade volatility analysis tool that combines Average True Range (ATR) channels with a real-time dashboard, providing traders with instant market volatility insights.
KEY FEATURES: Dynamic ATR Channels (80%, 100%, 130%) - Individually adjustable Real-time Volatility Dashboard Multi-timeframe Analysis Clear Visual Labels Customizable Settings
WHAT YOU GET: • Six ATR-based volatility channels showing potential support/resistance zones • Professional dashboa
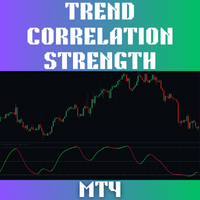
The Trend Correlation Strength (TCS) Indicator is a powerful new tool designed to measure trend strength in a unique and effective way, outperforming traditional indicators like the Average Directional Index (ADX). Instead of relying on directional movement (+DI and -DI), TCS calculates the correlation between closing prices and a linear time series, giving forex traders a distinctive method for identifying strong trends. Key Benefits of TCS Detect Trends Like a Pro : TCS doesn’t rely on lagging

「Binary Smart Eye」MT4インジケーターは、バイナリーオプションと外国為替市場の両方で取引シグナルを提供するために設計されており、M1からW1までの広範囲な時間枠で動作します。トレンドレベル、インテリジェントな移動平均、最適化された取引期間を組み合わせた独自の戦略を採用し、潜在的なエントリーポイントを特定します。 主な機能の内訳は以下のとおりです。 マルチタイムフレーム分析: インジケーターの多様性により、トレーダーはさまざまな時間枠で利用でき、M1でのスキャルピングからW1での長期トレンドフォローまで、さまざまな取引スタイルに対応します。 独自の戦略: 「Binary Smart Eye」の核となるのは、以下を利用する独自の戦略です。 トレンドレベル: これらのレベルは、優勢な市場トレンドと潜在的な反転ポイントを特定するのに役立ちます。 インテリジェントな移動平均: 市場のボラティリティに適応し、正確なトレンド方向を提供するカスタマイズされた移動平均です。 スマート取引期間: インジケーターは、特定の時間期間に基づいてシグナル生成を最適化し、最適な市場状況を捉えること
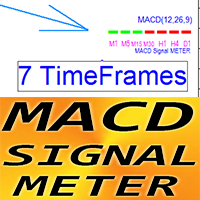
Crypto_Forex インジケーター MACD シグナル メーター (MT4 用)。
- 非常に便利な MACD シグナル メーター インジケーターは、7 つのタイムフレームの現在の MACD 値 (シグナルの上/下) を同時に表示します。 - 緑の四角形 - MACD はシグナルの上です。 - 赤い四角形 - MACD はシグナルの下です。 - Forex インジケーター MACD シグナル メーターは、マルチ タイム フレーム取引の取引エントリ フィルターとして使用できます。
// 優れた取引ロボットとインジケーターは、 https://www.mql5.com/en/users/def1380/seller から入手できます。 これは、この MQL5 Web サイトでのみ提供されるオリジナル製品です。
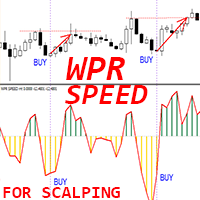
Crypto_Forex MT4 用インジケーター「WPR SPEED」 - 優れた予測ツール、リペイントなし。
- このインジケーターの計算は、物理学の方程式に基づいています。WPR SPEED は、WPR オシレーター自体の 1 次導関数です。 - WPR SPEED は、横ばいおよびフラット市場でのスキャルピング エントリに適しています。 - WPR SPEED インジケーターは、WPR 自体が方向を変える速度を示します。非常に敏感です。 - モメンタム スキャルピング トレーディング戦略には、WPR SPEED インジケーターの使用をお勧めします。インジケーターの大きなピークを見つけます - 反対方向にスキャルピング トレードを開始します (画像のように)。 - インジケーターには、モバイルおよび PC アラートが組み込まれています。
// 優れたトレーディング ロボットとインジケーターは、こちらで入手できます: https://www.mql5.com/en/users/def1380/seller これは、この MQL5 Web サイトでのみ提供されるオリジナル製品で
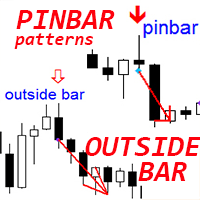
Crypto_Forex インジケーター「ピンバーとアウトサイドバーパターン」MT4用。
- インジケーター「ピンバーとアウトサイドバーパターン」は、プライスアクション取引に非常に強力です。 - インジケーターは、チャート上のピンバーとアウトサイドバーパターンを検出します: - 強気パターン - チャート上の青い矢印信号 (画像を参照)。 - 弱気パターン - チャート上の赤い矢印信号 (画像を参照)。 - 再描画なし、遅延なし。 - PC、モバイル、および電子メールアラート付き。 - インジケーター「ピンバーとアウトサイドバーパターン」は、サポート/レジスタンスレベルと組み合わせるのに最適です。
// 優れたトレーディングロボットとインジケーターは、 https://www.mql5.com/en/users/def1380/seller から入手できます。 これは、この MQL5 ウェブサイトでのみ提供されるオリジナル製品です。
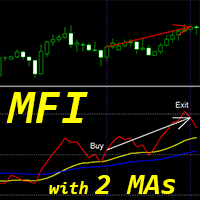
Crypto_Forex インジケーター「MFI と 2 つの移動平均」MT4 用、リペイントなし。
- マネーフローインデックス (MFI) は、価格とボリュームデータを使用して売られすぎと買われすぎのゾーンを識別するテクニカルオシレーターです。 - 「MFI と 2 つの移動平均」インジケーターを使用すると、MFI オシレーターの高速移動平均と低速移動平均を確認できます。 - このインジケーターを使用すると、トレンドの変化を非常に早く確認できます。 - パラメーターを使用してこのインジケーターを設定するのは非常に簡単で、どの時間枠でも使用できます。 - 画像で買いと売りのエントリー条件を確認できます。 - 買いシグナルの条件: (1)-高速 MA が低速 MA を上向きに交差、(2)-赤い MFI ラインが高速 MA を上回り、(3)-赤いラインが黄色のラインに接近、 (4)-赤いラインが黄色のラインから上向きに反発、(5)-買いフックがちょうど形成された - ここで取引を開始、(6)-重要: MA が交差した後は最初のフックのみを使用する。 (7)売り取引の場合はその逆 (画
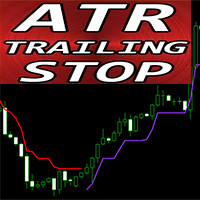
Crypto_Forex インジケーター「ATR トレーリング ストップ」、MT4 用、リペイントなし。
- MT4 用の優れた補助 ATR トレーリング ストップ インジケーターで取引方法をアップグレードします。 - このインジケーターはトレーリング ストップの目的に最適です。 - ATR トレーリング ストップは、市場のボラティリティに自動的に適応します。 - 遅延がなく、セットアップが簡単です。 - このインジケーターは、主要なトレンドの方向への価格アクション エントリと組み合わせるのに最適です。
// 優れたトレーディング ロボットとインジケーターは、こちらで入手できます: https://www.mql5.com/en/users/def1380/seller これは、この MQL5 Web サイトでのみ提供されるオリジナル製品です。
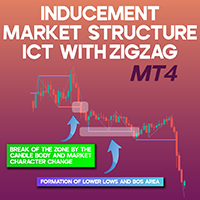
ICT Market Structure Indicator with Inducements MT4
The ICT-style Market Structure Indicator for MetaTrader 4 provides traders with a detailed analysis of Smart Money market dynamics. This tool integrates essential elements such as Change of Character (CHoCH), Break of Structure (BOS), and Inducement Detection (IDM) to give a precise representation of price movement. On the price chart, red lines highlight CHoCH levels, blue lines represent structural breaks, and gray lines indicate inducement

Secret Liquidity Zones Indicator User Manual Introduction Unlock the power of hidden market opportunities with the Secret Liquidity Zones Indicator . This cutting‐edge tool is designed to reveal critical price levels where market momentum may shift. With its dynamic adaptability and sleek gold visuals, it offers clear and elegant insights into key trading opportunities—making it the perfect secret weapon for traders who demand precision and clarity. Key Features Dynamic Timeframe Adaptation:
A
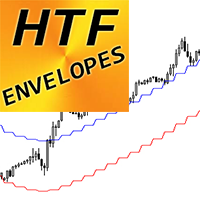
Crypto_Forex インジケーター「HTF エンベロープ」MT4 用。
- MT4 用のプロフェッショナル HTF エンベロープを使用して、取引方法をアップグレードします。HTF は、Higher Time Frame を意味します。 - エンベロープは、市場で最高のトレンド インジケーターの 1 つであり、取引に最適なツールです。 - トレーダーが極端な買われすぎや売られすぎの状態、および取引範囲を識別するのに役立ちます。 - HTF エンベロープ インジケーターは、プライス アクション エントリを使用するマルチタイムフレーム取引システム、または他のインジケーターとの組み合わせに最適です。 - このインジケーターを使用すると、Higher Timeframe のエンベロープを現在のチャートに添付できます。
// 優れた取引ロボットとインジケーターは、 https://www.mql5.com/en/users/def1380/seller から入手できます。 これは、この MQL5 Web サイトでのみ提供されるオリジナル製品です。
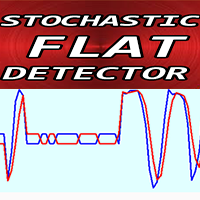
Crypto_Forex インジケーター STOCHASTIC FLAT Detector は、取引の効率的な補助ツールです。再描画はありません。 この MT4 用の優れたインジケーターを使用して、取引方法をアップグレードすることをお勧めします。
- インジケーターは、チャート上の価格のフラット領域を表示します。フラット検出を担当する「フラット感度」パラメーターがあります。 - STOCHASTIC FLAT Detector は、価格アクション エントリの確認、ダイバージェンス、または売られすぎ/買われすぎのシグナルに使用できます。 - トレンド フォロー システムで使用して、フラット ゾーンを検出し、そこでの取引を回避できます。 - リバーサル スキャルピングに使用して、フラット ボーダーからのリバーサルを取引できます。 - 標準の Stochastic の代わりに STOCHASTIC FLAT Detector を使用する機会はたくさんあります。 - Stochastic 自体は、市場で最高のオシレーターの 1 つであり、多くのトレーダーに最適なツールです。
// 素晴ら
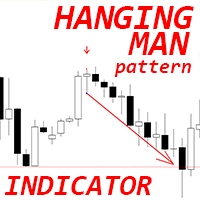
Crypto_Forex MT4 用インジケーター「ハンギングマンパターン」
- インジケーター「ハンギングマンパターン」は、プライスアクション取引に非常に強力なインジケーターです。再描画なし、遅延なし。 - インジケーターはチャート上で弱気なハンギングマンパターンを検出します。チャート上の赤い矢印信号 (画像を参照)。 - PC、モバイル、および電子メールアラート付き。 - インジケーター「ハンギングマンパターン」は、サポート/レジスタンスレベルと組み合わせるのに最適です。
// 優れたトレーディングロボットとインジケーターは、こちらで入手できます: https://www.mql5.com/en/users/def1380/seller これは、この MQL5 ウェブサイトでのみ提供されるオリジナル製品です。

同期クロスヘア & 極値ライン インジケーター シンプルな説明(すべてのトレーダー向け) このインジケーターは、 同じ銘柄の複数のチャートでクロスヘアを同期 し、異なる時間軸の価格動向を同時に追跡できる便利なツールです。 主な機能: 同期クロスヘア: 1つのチャートでクロスヘアを動かすと、 他の同じ銘柄のチャートでも自動的に更新 されます。
ショートカットキーで簡単操作: "F" – クロスヘアの表示/非表示を切り替え。 "R" – 最高値/最安値に極値ラインを追加・削除。 "T" – 選択したバーに垂直ラインを追加・削除。
完全カスタマイズ可能: カラー、ラインスタイル、幅などを自由に調整可能。 このツールは、 手動でチャートを調整する手間を省き、マルチタイムフレーム分析をスムーズに行うのに最適 です。 詳細な説明(経験豊富なトレーダー & プログラマー向け) 同期クロスヘア & 極値ライン インジケーター は、 複数のチャートを同期する高度なツール で、テクニカル分析の精度を向上させます。
このインジケーターを使うことで、異なる時間軸のチャートにおいて
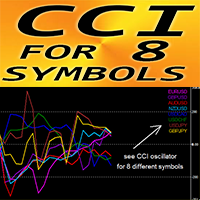
MT4 用 Forex インジケーター「8 シンボルの CCI」、リペイントなし。
- CCI は、取引で最も人気のあるオシレーターの 1 つです。 - コモディティ チャネル インデックス (CCI) は、現在の価格と過去の平均価格の差を測定します。 - 重要なレベル: +/-200。 - +200 ゾーンより上のゾーンから売りエントリーを取り、-200 より下のゾーンから買いエントリーを取るのに最適です。 - 「8 シンボルの CCI」を使用すると、1 つのチャートで最大 8 つの異なるシンボルの CCI 値を制御できます。 - このインジケーターは、プライス アクション エントリーと組み合わせるのにも最適です。
// 優れたトレーディング ロボットとインジケーターは、こちらで入手できます: https://www.mql5.com/en/users/def1380/seller これは、この MQL5 Web サイトでのみ提供されるオリジナル製品です。
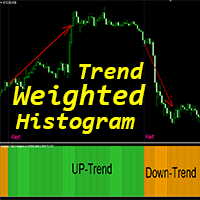
Crypto_Forex インジケーター「加重トレンドヒストグラム」MT4 用、再描画なし。
- 加重トレンドヒストグラムインジケーターは、標準的な移動平均クロスよりもはるかに効率的です。 - トレンド戦略を好むトレーダー向けです。 - インジケーターには 2 つの色があります。黄色は弱気下降トレンド、緑は強気上昇トレンドです (色は設定で変更できます)。 - モバイルおよび PC アラート付き。 - このインジケーターを他の取引方法と組み合わせるのは素晴らしいアイデアです。価格アクション、スキャルピング、モメンタム取引、その他のインジケーター。
// 優れた取引ロボットとインジケーターは、 https://www.mql5.com/en/users/def1380/seller から入手できます。 これは、この MQL5 Web サイトでのみ提供されるオリジナル製品です。

Aroon Cross Signal Indicator - Trading Companion V1.21 Important Note: This indicator is provided as a raw trading tool designed for traders who enjoy customization and optimization. It is NOT a plug-and-play solution and requires your personal trading expertise to maximize its potential. Indicator Overview: The Aroon Cross Signal Indicator is a sophisticated technical analysis tool built to identify potential trend reversals and momentum shifts in financial markets. Leveraging the powerful Aro
MetaTraderマーケットは、履歴データを使ったテストと最適化のための無料のデモ自動売買ロボットをダウンロードできる唯一のストアです。
アプリ概要と他のカスタマーからのレビューをご覧になり、ターミナルにダウンロードし、購入する前に自動売買ロボットをテストしてください。完全に無料でアプリをテストできるのはMetaTraderマーケットだけです。
取引の機会を逃しています。
- 無料取引アプリ
- 8千を超えるシグナルをコピー
- 金融ニュースで金融マーケットを探索
新規登録
ログイン