Kostenpflichtige technische Indikatoren für den MetaTrader 4 - 116

Mt support and resistance is an indicator that shows various levels to buy or sell based on prevailing market conditions. The main basis of the indicator is support levels and resistance levels. It consists of; Red buffer Blue buffer Purple buffer The blue buffer is resistance level where price is supposed to return back. The red buffer is the support level where price should bounce back.

Previous day levels is a mt4 indicator that shows various levels to buy or sell in the market based on prevailing market conditions. The main theory behind this indicator is support and resistance levels. The indicator uses previous day values in calculations to get the support and resistance levels for the next day period. This indicator consists of two purple buffers. The top buffer is the resistance level and the bottom buffer is the support level.
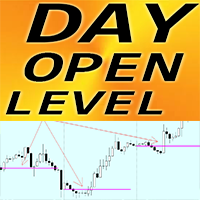
Crypto_Forex-Indikator DAY OPEN LEVEL für MT4.
- Der Indikator „Day Open Level“ ist ein sehr nützlicher Hilfsindikator. - Das OPEN-Day-Level ist so wichtig, weil der Preis im Tagesverlauf sehr oft in diesen Bereich zurückkehrt. - Der Indikator zeigt Ihnen die tägliche Eröffnungslinie für jeden Tag. - Er ist für Intraday-Händler nützlich, um Ziele festzulegen oder als Unterstützungs-/Widerstandsgebiet zu verwenden. - Der Day Open Level-Indikator kann für den Intraday-Handel mit Umkehrungen verw
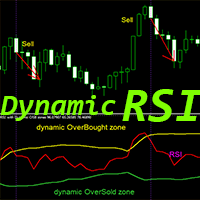
Crypto_Forex-Indikator „RSI mit dynamischen Überverkauft-/Überkauft-Zonen“ für MT4, kein Neuanstrich.
- RSI ist einer der beliebtesten Oszillatoren für den Handel – sehr gut für Scalping. - Er eignet sich hervorragend für Verkaufstransaktionen aus dynamischen Überkauft-Zonen und Kauftransaktionen aus dynamischen Überverkauft-Zonen. - Der RSI-Oszillator ist auch sehr nützlich für die Divergenzerkennung. - Dieser Indikator lässt sich auch hervorragend mit Price Action-Transaktionen aus Überverka
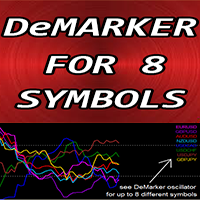
Forex-Indikator „DeMarker für 8 Symbole“ für MT4, kein Neuzeichnen.
- Die DeMarker-Oszillatorkurve zeigt die aktuelle Preisposition im Verhältnis zu vorherigen Hochs und Tiefs während des Indikatorberechnungszeitraums an. - DeMarker bietet die effizientesten regulären Divergenzsignale unter anderen Oszillatoren. - Er eignet sich hervorragend für Verkaufseinträge mit regulärer Divergenz im Überkaufbereich (über 0,7) und Kaufeinträge mit regulärer Divergenz im Überverkaufsbereich (unter 0,3). -

Inside Candle Indicator for MT4 The Inside Candle Indicator is a simple yet effective tool for identifying inside bar formations on the chart. Inside candles signal market consolidation , often leading to breakout opportunities. Features: Automatically detects inside bars and marks them with a small dot below the candle.
Helps traders spot potential breakout zones and areas of market compression.
Works on all timeframes and asset classes , making it versatile for different trading strategi
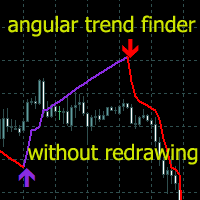
Trendindikatoren sind einer der Bereiche der technischen Analyse und werden im Handel an Finanzmärkten eingesetzt.
Angular Trend Lines -Indikator – bestimmt umfassend die Trendrichtung und generiert Einstiegssignale. Neben der Glättung der durchschnittlichen Richtung der Kerzen
Dabei wird auch der Neigungswinkel von Trendlinien genutzt. Für den Neigungswinkel wurde das Prinzip der Konstruktion von Gann-Winkeln zugrunde gelegt.
Der Indikator für die technische Analyse kombiniert Candlestick-Glätt
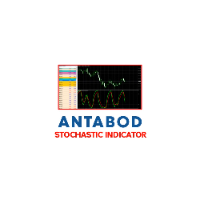
How Antabod Stochastic Works Antabod Stochastic is a cutting-edge technical indicator designed to analyze market momentum and identify overbought and oversold conditions with unparalleled precision. Here's a breakdown of how it works and what makes it a game-changer for traders: ________________________________________ 1. Core Concept At its heart, Antabod Stochastic is based on the stochastic oscillator principle, which measures the position of a current price relative to its range over a spec

Just Trade Indicator – Dein Verbündeter für präzises und stressfreies Trading!
Entdecke den Just Trade Indicator, den ultimativen Indikator für MetaTrader 5, der dir hilft, klare Ein- und Ausstiegspunkte im Markt zu identifizieren. Mit fortschrittlichen Algorithmen bietet dieses Tool intuitive visuelle Signale, die dein Trading vereinfachen. Warum Just Trade Indicator wählen?
Klare und präzise Signale – Kauf- und Verkaufssignale werden direkt auf dem Chart mit intuitiven Pfeilen angezeigt
This indicator overlays higher timeframe candles on the lower timeframe chart. You have option to make the candles Hollow (outline) or Solid (fill) for better visibility and analysis of your charts. You can easily change your chart timeframes ( to any lower timeframe than the indicator input) while using this indicator for true multi-timeframe analysis.
Features: Timeframes from 1 Min to 1 Month Minimal Inputs Customize candle body, color etc.
Inputs: Candles Period - Choose the timeframe f
Im Trading ist es wichtig zur richtigen Zeit zu handeln, deshalb ist es von Vorteil
sich mit diesem Indikator die Eröffnung der Devisenbörsen anzeigen zu lassen.
Definieren Sie sich ihre persönliche Handelszeiten indem Sie zusätzlich diese Zeiten mit einer einstellbaren Hintergrundfarbe hinterlegen.
Sie können diesen Indikator über einen Button auf dem Chart ein und ausschalten.
Dieser Indikator ist Teil der OH-Strategie, weitere Indikatoren dieser Strategie können Sie sich
anschauen wenn Sie a
Zwei modifizierte Triangular MA als oberes und unteres Band das durch Farbwechsel den Trend anzeigt.
Wenn beide MA die gleiche Farbe anzeigen liegt ein bestätigter Trend vor.
Der Indikator lässt sich über einen Button auf dem Chart an und ausschalten.
Dieser Indikator ist Teil der OH-Strategie, weitere Indikatoren dieser Strategie können Sie sich
anschauen wenn Sie auf meinen Namen als Verkäufer klicken.
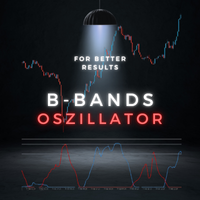
Ein Indikator nach dem Prinzip Bollinger Bands, modifiziert durch skalierte Berechnung von Standartabweichungen und
zusammengefasst zu Oszillatorbändern machen diesen Indikator besonders.
Deutlich und übersichtlich wird ein Up- und ein Downtrend angezeigt und zusätzlich mit den integrierten Leveln 70 und 90
das mögliche Ende des Trends bzw. die Möglichkeit einer Konsolidierung angezeigt.
Dieser Indikator ist Teil der OH-Strategie, weitere Indikatoren dieser Strategie können Sie sich
anschauen
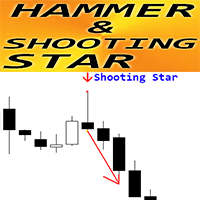
Crypto_Forex-Indikator „Hammer- und Shooting-Star-Muster“ für MT4.
- Der Indikator „Hammer- und Shooting-Star-Muster“ ist ein sehr leistungsstarker Indikator für den Price-Action-Handel: Kein Neuanstrich, keine Verzögerung. - Der Indikator erkennt bullische Hammer- und bärische Shooting-Star-Muster auf dem Chart: - Bullischer Hammer – Blaues Pfeilsignal auf dem Chart (siehe Bilder). - Bärischer Shooting Star – Rotes Pfeilsignal auf dem Chart (siehe Bilder). - Mit PC-, Handy- und E-Mail-Benachr
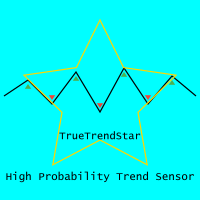
Advanced Detector of Trend Reversal and Continuance known as TrueTrendStar(TTS) is a sensitive and Predictive indicator of Price Trends for Professional traders. ( WEEKEND DISCOUNT 15% OFF !!! ) ( ATTENTION BUYERS:- PLEASE CONTACT ME FOR HOW BEST TO USE THE INDICATOR FOR MAXIMUM PROFITS )
This indicator detects advanced signals of high odds changes in Price Trend direction long before other indicator detects it. I have been working on it since 2019. This is possible due to fractal nat

Fair Value Gap (FVG) Indicator with Clear Trendlines Identify Fair Value Gaps (FVGs) like a pro! This powerful MQL4 indicator marks Bullish and Bearish FVGs with clear, precise trendlines , giving you a visual edge in spotting high-probability trading opportunities. Key Features: Two Trendlines per FVG : Clearly marks the top and bottom of each FVG zone for easy identification. No Rays : Trendlines are clean and concise, ensuring a clutter-free chart. Customizable Colors : Personal
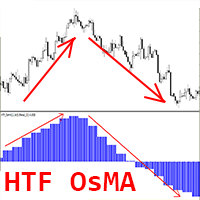
Crypto_Forex-Indikator HTF OsMA Oszillator für MT4.
- HTF OsMA ist einer der besten Trendindikatoren auf dem Markt. HTF steht für „Higher Time Frame“. - Dieser Indikator eignet sich hervorragend für Multi-Time-Frame-Handelssysteme mit Price-Action-Einträgen oder in Kombination mit anderen Indikatoren. - Mit dem HTF OsMA-Indikator können Sie OsMA aus einem höheren Zeitrahmen an Ihr aktuelles Diagramm anhängen --> dies ist ein professioneller Handelsansatz.
// Weitere großartige Expert Advisors
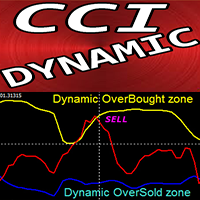
Crypto_Forex-Indikator „CCI mit dynamischen Überverkauft-/Überkauft-Zonen“ für MT4, kein Neuanstrich.
- Der Commodity Channel Index (CCI) eignet sich hervorragend für Momentum-Trading in Trendrichtung. - Er eignet sich hervorragend für Verkaufseinträge aus dynamischen Überkauft-Zonen und Kaufeinträge aus dynamischen Überverkauft-Zonen in Richtung des Haupttrends. - Dieser Indikator lässt sich auch hervorragend mit Price Action-Einträgen kombinieren. - Dynamische Überkauft-Zone – über der gelbe

This indicator looks at daily, weekly, and monthly data and tells you how often those levels get "tested" or touched. In other words, you can see how reliable a particular level has been historically and whether the price is likely to visit it. Easy Customization:
You can tweak the number of days, weeks, or months the indicator checks, as well as adjust the tolerance for what counts as a “touch.” Plus, you can easily turn the pivot lines or the labels on and off to keep your chart as busy—or as
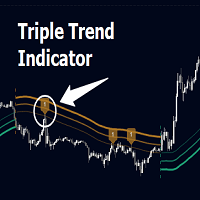
Triple Trend Indicator is a versatile trend-following tool designed to help traders identify trend strength and potential pullback levels using a three-band system. Each band represents a varying degree of price deviation from the mean, providing progressively stronger trend signals.
Key Features:
Three Adaptive Bands:
The indicator dynamically calculates three bands (1, 2, and 3) based on moving averages (SMA, EMA, WMA) and ATR multipliers.
Bands are positioned below the price in a

Presenting UMS Scanner – Your Ultimate Edge in the MT4 Marketplace! https://youtube.com/shorts/znUdz5PEBAY?feature=share Unlock the secrets of the market with the ground-breaking UMS Scanner (Universal Market Strategy) – a revolutionary tool designed to empower traders like you. Say goodbye to overwhelming market noise and hello to precision, insight, and unparalleled trading confidence. Cut Through the Clutter:
In today’s fast-paced trading world, deciphering valuable signals from market nois

Der DTM-Kanal-Indikator zeichnet interaktiv eine Ober- und Unterseite sowie eine schnelle Trendlinie und erstellt so einen Kanal oder ein Dreieck.
Wenn eine der Trendlinien von einer Seite durch den Preis berührt wird, wird gemäß den Einstellungen eine Warnung gesendet!
Sehr einfach, nur die Farben der Trendlinien und die Warnungen müssen eingestellt werden.
Dieser Indikator wird allen anderen Indikatoren, die Sie verwenden, zugute kommen!
Bereit zum Einsatz!
https://www.mql5.com/en/users/
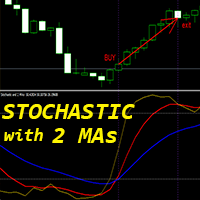
Crypto_Forex-Indikator „Stochastik und 2 gleitende Durchschnitte“ für MT4, kein Neuanstrich.
- Der stochastische Oszillator ist einer der besten Indikatoren auf dem Markt – das perfekte Werkzeug für viele Händler. - Der Indikator „Stochastik und 2 gleitende Durchschnitte“ ermöglicht es Ihnen, schnelle und langsame gleitende Durchschnitte des stochastischen Oszillators anzuzeigen. - Überkaufte Zone – über 80; überverkaufte Zone – unter 20. - Es ist großartig, Verkaufseinträge aus der Zone über
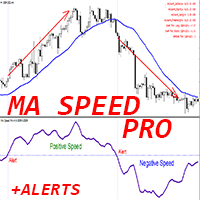
Crypto_Forex-Indikator „MA Speed Pro“ für MT4, kein Neuanstrich.
GESCHWINDIGKEIT des gleitenden Durchschnitts – ist ein einzigartiger Trendindikator.
– Die Berechnung dieses Indikators basiert auf Gleichungen aus der Physik. – Geschwindigkeit ist die 1. Ableitung des gleitenden Durchschnitts. – Der MA Speed Pro-Indikator zeigt, wie schnell der MA selbst seine Richtung ändert. – Es gibt viele Möglichkeiten, selbst Standardstrategien mit MA Speed Pro zu verbessern. Geeignet für SMA, EMA,

FX Sweeps is an indicator that gives non repaint arrows in liquidity sweep areas
It uses a combination of calculations including volume divergence, Average True Range and the average of previous high and lows
The indicator can be used for reversal trades or binary options - Please see screenshots
Symbol: Any Timeframe: 5m - 4H
Please test thoroughly in strategy tester before purchase!
Any questions - Send me a message
Enjoy! -----------------

FVG & iFVG Alert indicator for MT4
- it is coded to detect freshest untouched FVG, both bullish and bearish, it draws lines for the FVG making it clear - when price reaches these levels it will alert upon candle close that price is potentially breaking this FVG or retesting it - price might hold and will then be FVG or it might inverse and become an iFVG - good for alerting you when to look at chart, then execute depending on trading system

Easy Trade Indicator – Your Path to Profitable Trades! Work any Time Frame! Maximize your profits with precise and assertive trades!
️ Trade with comfort – the indicator does the analysis and you only open the order in the direction in which the indicator shows you!
Exclusive panel with past trade counter and accuracy tracking! Simplify your analysis, boost your performance, and trade with confidence! Get it now and take your trading to the next level

ICT Killzone Indicator – Master the Market’s Key Trading Sessions Unlock the true potential of Institutional Order Flow with the ICT Killzone Indicator , designed for serious traders who follow Inner Circle Trader (ICT) concepts. This tool highlights the most critical trading periods—the Asia, London, and New York Killzones —allowing you to align your trades with high-probability setups used by smart money traders. Key Features: Automated Killzone Markings – The indicator dynamically plots th

Arrow Indicator for Fast Scalping
Determines the direction of movement on almost every candle.
Allows timely opening of positions in accordance with changing market conditions.
Works on all timeframes, all currency pairs, metals, indices, and cryptocurrencies.
Can be used when trading binary options.
Key Features: No settings required; Accurately determines the direction of movement; Does not repaint after the candle closes; Works on all timeframes and all trading instruments; Suitable for
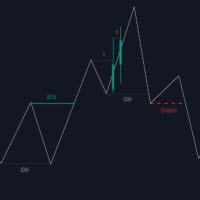
The Market Structure with Inducements & Sweeps indicator is a unique take on Smart Money Concepts related market structure labels that aims to give traders a more precise interpretation considering various factors.
Compared to traditional market structure scripts that include Change of Character (CHoCH) & Break of Structures (BOS) -- this script also includes the detection of Inducements (IDM) & Sweeps which are major components of determining other structures labeled on the chart.
SMC & pri

Arrow simulator gives buy and sell signals based on non repaint arrow logic
It also shows take profit and stop loss placement based on average true range
Also provided is a simulation panel in the corner to show how the signals performed over a set number of bars
When running in strategy tester or live lower the number of bars to reduce using pc resources and speed up back testing
Filter out arrows with the ma filter if needed and choose your trading time
Default settings is for 5m EUR/USD

*Antabod GameChanger Indicator – Transform Your Trading!*
Are you tired of chasing trends too late or second-guessing your trades? The *Antabod GameChanger Indicator* is here to *revolutionize your trading strategy* and give you the edge you need in the markets! Why Choose GameChanger?
*Accurate Trend Detection* – GameChanger identifies trend reversals with *pinpoint accuracy*, ensuring you enter and exit trades at the optimal time.
*Clear Buy & Sell Signals* – No more guesswork! T
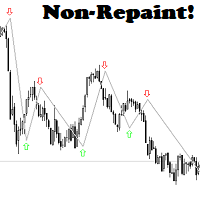
Scalper like a PRO! Trade like a PRO! Easy to use! Your profit and consistency is here! All TF and all Pairs! Just place it on the chart, select the chart and active time of your choice and follow the signals! Trade with comfort – the indicator does the analysis and you only open the order in the direction in which the indicator shows you!
finally start taking money from the market!
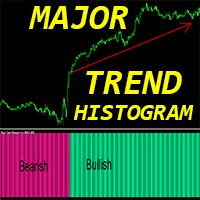
Crypto_forex -Anzeige "Major_trend_histogram" für MT4, kein Repaint.
- Major_trend_histogram -Indikator, das wirklich große Trends fangen soll. - Indikator kann in 2 Farben sein: Rosa für den bärischen Trend und grün für bullische (Farben können geändert werden). - Es erkennt Trends in den Anfangsphasen - weitaus effizienter als jedes Standard -MA -Kreuz. - Major_trend_histogram kann mit allen anderen Handelsmethoden kombiniert werden: Preisaktion, VSA, andere Indikatoren. - Indikator hat inte

Belladonna is an advanced custom technical indicator for MetaTrader 4 based on Hull Moving Average (HMA). It visualizes the trend direction using colored lines and arrows on the chart. The indicator is optimized to minimize lag and eliminate market noise, making it especially useful for short-term and medium-term trading.
Functions and Features: Moving Average Type: Hull Moving Average (based on two EMA/SMA lines).
Calculation Methods: Support for different types of moving average (SMA, EMA,

The Hodrick-Prescott filter is a well known filtering algorithm Perfect for offline jobs it lacks realtime capabilities that are necessary in trading This is a first time a causal Hodrick-Prescott filter has been made
I was able to successfully make a causal (realtime) version of the Hodrick-Prescott algorithm which keeps the lag to a minimum as you can see on the screenshots, it is really responsive to sharp changes while retaining a high smoothing ability, making it one of the best smoothers
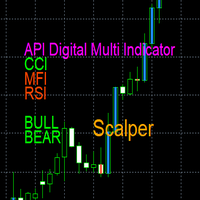
API Digital Multi Indicator Scalper – Clear Digital Display API Digital Multi Indicator Scalper , a tool that integrates RSI, MFI, CCI, Bulls and Bears into a digital display for market analysis . This indicator is designed for scalpers and short-term traders who demand clear data . Key Features: Digital Display – Monitor RSI, MFI, CCI, Bulls and Bears values in an easy-to-read digital format.
Color Changes – Visual cues help identify possible trend changes at a glance.
Adjustable
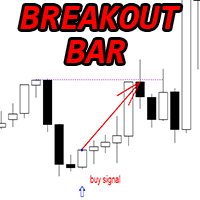
Crypto_Forex-Indikator „Breakout Bar-Muster“ für MT4.
- Der Indikator „Breakout Bar-Muster“ ist ein sehr leistungsstarker Indikator für Price Action-Trading: Kein Neuzeichnen, keine Verzögerungen. - Der Indikator erkennt Breakout Bar-Muster im Diagramm: - Bullisches Breakout Bar-Muster – Blaues Pfeilsignal im Diagramm (siehe Bilder). - Bearisches Breakout Bar-Muster – Rotes Pfeilsignal im Diagramm (siehe Bilder). - Mit PC-, Handy- und E-Mail-Benachrichtigungen. - Der Indikator „Breakout Bar-Mu
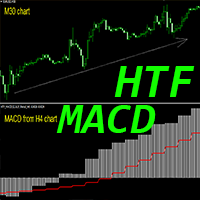
Crypto_Forex-Indikator HTF MACD-Oszillator für MT4.
- HTF steht für „Higher Time Frame“. - Der MACD-Indikator selbst ist einer der beliebtesten Indikatoren für Trendhandel. - Dieser Indikator eignet sich hervorragend für Multi-Time-Frame-Handelssysteme mit Price-Action-Einträgen oder in Kombination mit anderen Indikatoren. - Der HTF MACD-Indikator ermöglicht es Ihnen, MACD aus einem höheren Zeitrahmen an Ihr aktuelles Diagramm anzuhängen --> dies ist ein professioneller Handelsansatz. - Der In
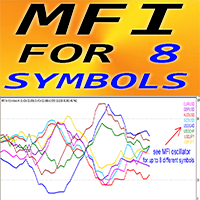
Forex-Indikator „MFI für 8 Symbole“ für MT4, kein Neuzeichnen.
- Der Money Flow Index (MFI) ist ein technischer Oszillator, der Preis- und Volumendaten zur Identifizierung überverkaufter und überkaufter Zonen verwendet. - Es ist großartig, Verkaufseinträge aus überkauften Bereichen zu nehmen, wenn der MFI über 80 liegt, und Kaufeinträge aus überverkauften Bereichen, wenn er unter 20 liegt. - Der MFI ist sehr nützlich zur Divergenzerkennung und lässt sich auch hervorragend mit Price Action komb
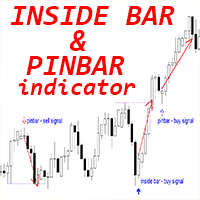
Crypto_Forex-Indikator „Inside Bar & PinBar Patterns“ für MT4.
- Der Indikator „Inside Bar & PinBar Patterns“ ist sehr leistungsstark für den Price Action-Handel – kein Neuzeichnen, keine Verzögerung. - Der Indikator erkennt Inside Bar- und PinBar-Muster auf dem Diagramm: - Bullisches Muster – Blaues Pfeilsignal auf dem Diagramm (siehe Bilder). - Bearisches Muster – Rotes Pfeilsignal auf dem Diagramm (siehe Bilder). - Inside Bar selbst hat ein hohes R/R-Verhältnis (Ertrag/Risiko). - Mit PC-, H
Trend NonLag Indicator is a professional and easy to use Forex, Crypto and CFDs trading system which is based on the best principles of trading using the Swing High and Swing Low and Price Action strategy. The indicator provides accurate BUY and SELL signals. You can trade even on the go using PUSH notifications. Probably you already heard about the Swing High and Swing Low trading methods before. Usually the Swing High/Low is a very complex thing not only for newbie traders but also for th

ORDER BLOCKS REVERSAL
Reversal Trading involves identifying points where an asset's price direction changes, capitalizing on potential profits from such shifts. Spotting reversals requires analyzing price patterns and volume indicators.
Key indicators include moving averages, RSI, and MACD, which help traders predict potential trend shifts. This indicator show us potential reversal points using ORDER BLOCKS.
While Reversal Trading offers potentially high reward opportunities by entering earl
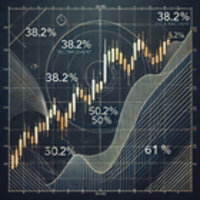
Indicador de Fibonacci Semanal para MT4 Maximize suas operações no mercado financeiro com o Indicador de Fibonacci Semanal para MetaTrader 4 (MT4) , a ferramenta essencial para traders que buscam identificar pontos estratégicos de suporte e resistência com base na ação do preço da última semana. Principais Recursos: Atualização Automática : O indicador recalcula os níveis de Fibonacci automaticamente a cada novo candle semanal. Níveis Personalizados : Traça apenas os níveis essenciais de Fibonac
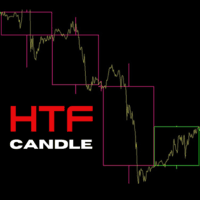
ICT Traders! Here's another cool Indicator that will allow to trade the HTF narrative while focus on price action on your entry timeframes. The following are the input for setup the indicator: Maximum Bar: The number of HTF bar you want to display High Timeframe: the Timeframe which narrative you want to base on and trade from the lower timeframe. Visual Timeframe: the largest Timeframe the indicator will print the HTF candles. Bullish Candle: The color of the bullish candle Bearish Candle: The
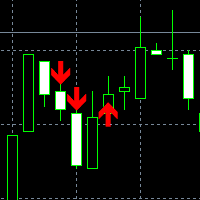
This is Binary option indicator mt4 for one candle expiry, also can be used for forex Higher Timeframes like H4,D1,W1, it is very accurate no lags no repaints, before you purchase you can ask me any question you may recon with feel free to contact me, Indicator Buffers are 0 for buy and 1 for sell, it Draws arows immidiate;
Alerts has been included; Push Notification has been included;
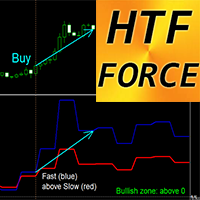
Crypto_Forex-Indikator HTF Force Oszillator für MT4.
- HTF Force ist ein leistungsstarker Indikator für Multi-Time-Frame-Handel. HTF steht für Higher Time Frame. - Force Index ist einer der Top-Indikatoren, der Preis- und Volumendaten in einem einzigen Wert kombiniert. - Werte aus einem Higher Time Frame können Ihnen die Trendrichtung anzeigen (Abwärtstrend – unter 0; Aufwärtstrend – über 0). - Fast Force_Indikator – Blaue Linie, Slow Force_Indikator – Rote Linie. - Kaufsignal – Schnelle Linie

ZigZag mod ko'rsatkichi - kuchli texnik tahlil vositasi ZigZag mod ko'rsatkichi nima? ZigZag Mod indikatori treyderlarga foreks, fond va kriptovalyuta bozorlarida narxlarning asosiy burilish nuqtalarini aniqlashga yordam berish uchun mo'ljallangan texnik tahlil vositasidir . Bozor shovqinini filtrlaydi va trend yo'nalishini aniq ingl . Asosiy xususiyatlar Trendning o'zgarishini aniqlaydi - bozor yo'nalishini ko'rsatish uchun asosiy yuqori va past darajalarni ta'kidlaydi.
Narxlarning keraksiz o
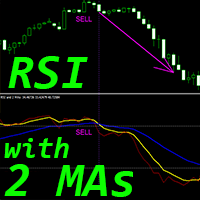
Crypto_Forex-Indikator „RSI und 2 gleitende Durchschnitte“ für MT4, kein Neuanstrich.
- Dieser Indikator eignet sich hervorragend für Momentum-Handelssysteme. - Der Indikator „RSI und 2 MAs“ ermöglicht es Ihnen, schnelle und langsame gleitende Durchschnitte des RSI selbst anzuzeigen. - Der Indikator bietet die Möglichkeit, Trendänderungen sehr früh zu erkennen. - „RSI und 2 MAs“ können verwendet werden, um den Impuls in die Trendrichtung aus überkauften/überverkauften Zonen zu erfassen. - Dies
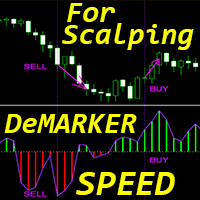
Crypto_Forex-Indikator „DeMarker Speed“ für MT4, kein Repaint.
- Die Berechnung dieses Indikators basiert auf Gleichungen aus der Physik. DeMarker Speed ist die 1. Ableitung von DeMarker selbst. - Die DeMarker-Oszillatorkurve zeigt die aktuelle Preisposition im Verhältnis zu vorherigen Hochs und Tiefs während des Indikatorberechnungszeitraums an. - Der DeMarker Speed-Indikator eignet sich gut für schnelle Scalping-Einträge (wie Sie auf den Bildern sehen können). - DeMarker Speed zeigt an,
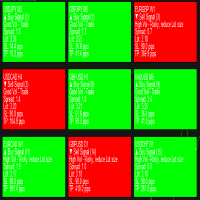
Introducing Telos Dashboard Indicator – Your Ultimate Trading Companion Optimized For Forex!
Note: This is a dashboard indicator and won't work on the strategy tester, demoing it there is a waste. Instead get the main indicator or, use the demo of DynamicCOG to see how it works with arrows, although Telos is a more refined and filtered version than the DynamicCOG indicator. Never Miss a Trading Opportunity Again!
Welcome to the future of trading with the Telos Dashboard Indicator ! Inspired b
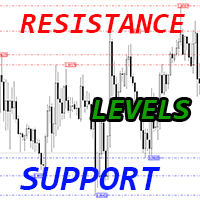
Crypto_Forex-Indikator „Support Resistance Levels“ für MT4.
- Der Indikator „Support Resistance Levels“ ist ein sehr nützlicher Hilfsindikator für den Handel. - „Support“ und „Resistance“ sind wichtige Zonen im Chart, die vom Preis beachtet werden. - Das Support-Level ist dort, wo der Preis regelmäßig aufhört zu fallen und wieder nach oben springt. - Das Resistance-Level ist dort, wo der Preis normalerweise aufhört zu steigen und wieder nach unten fällt. - Der Indikator „Support Resistance Lev

MamchenkoTrend Complex - высокоточный индикатор, показывающий смену тенденций на рынке. Индикатор не перерисовывает сигнал после закрытия свечи. Дает вам уровень стопа для вашей сделки по его сигналам. Отлично подходит для ручной торговли и в разработке в АТС (автоматические торговые системы) Настройки можно использовать по умолчанию , а также подбирать самостоятельно . На скриншотах изображен один и тот же участок графика пары GBPUSD на тайме Н4 но с разными настройками . На первом рисунке зн
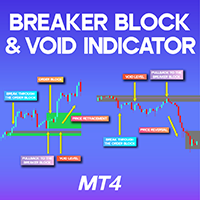
Breaker Block and Void Indicator MT4
The Breaker Block + Void Indicator is a valuable tool in MetaTrader 4, designed to pinpoint crucial price levels. A breaker block refers to a specific type of Order Block that initially gets breached by price action, later turning into a significant pullback zone. This indicator visually represents bullish breaker blocks in green and bearish breaker blocks in red , while those that have already been consumed are marked in gray for clarity. «Indicator Install
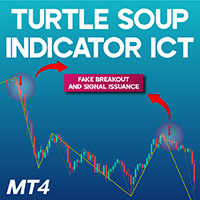
Turtle Soup Indicator ICT for MT4
The Turtle Soup Indicator for MetaTrader 4 is a well-known trading pattern within the ICT (Inner Circle Trader) methodology. It specializes in identifying false price breakouts , helping traders recognize situations where the price movement is deceptive. When market conditions align, the indicator provides an entry signal in the opposite direction of the breakout, making it highly effective for reversal trading strategies . This tool features a straightforward

Epsilon Trend computes a smoothed price line by first normalizing the price over a lookback period and then smoothing the result with a simple moving average. The smoothed normalized value is then re‑scaled to price so it appears as an overlay similar to a MA.
The color change is computed by comparing the current bar’s smoothed value with that of the previous bar and only switching trend if the difference exceeds a small threshold (epsilon) thus minimizing constant flickering.
Use on an
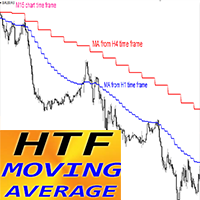
Crypto_Forex-Indikator HTF MOVING AVERAGE für MT4.
- Verbessern Sie Ihre Handelsmethoden mit dem professionellen HTF MA-Indikator für MT4. HTF steht für „Higher Time Frame“. - Dieser Indikator ist hervorragend für Trendhändler mit Price Action-Einträgen geeignet. - Der HTF MA-Indikator ermöglicht es Ihnen, den Moving Average aus einem höheren Zeitrahmen an Ihr aktuelles Diagramm anzuhängen. - Der Indikator zeigt den Trend aus einem höheren Zeitrahmen --> dies ist immer eine profitable Methode.
VWAP (Value Weighted Average Price) is an indicator of market makers and banks. It is used by professional traders for intraday, weekly and long-term trading. If you are not familiar with it yet, it is high time to figure it out. How does VWAP work? VWAP shows the volume-weighted average price over a certain period. Its calculation takes into account both the price change and the volume of transactions in each candle. Candles with a higher volume have a greater impact, which increases the ac
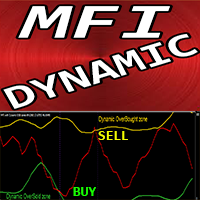
Crypto_Forex-Indikator „MFI mit dynamischen überverkauften/überkauften Zonen“ für MT4, kein Neuanstrich.
- Money_Flow_Index (MFI) ist ein technischer Oszillator, der Preis- und Volumendaten zur Identifizierung überverkaufter und überkaufter Zonen verwendet. - Er eignet sich hervorragend für Verkaufstransaktionen aus dynamischen überkauften Zonen und Kauftransaktionen aus dynamischen überverkauften Zonen. - MFI ist sehr nützlich für die Divergenzerkennung und lässt sich auch hervorragend mit Pr
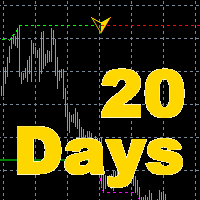
The indicator is the main part of Michael Huddleston's ICT (Inner Circle Trader) trading strategy. His legendary trading strategy is based on the concept of "Smart Money". To analyze the medium -term trend , the ICT offers an analysis based on twenty -day levels . The indicator builds levels , while showing the turning points with arrows . An important feature of the indicator is the automatic display of levels for different periods . You do not have to change the indicator settings when chang

Smart Key Levels Indicator for MT4 - Advanced Support & Resistance Tool The Smart Key Levels Indicator is a professional-grade tool for traders seeking precise support and resistance levels. Using advanced algorithms, it identifies key price levels with dynamic strength scoring, volume filtering, and higher timeframe confluence. Perfect for all trading styles and timeframes, this indicator provides clear visual signals with customizable settings. Available for both MT4 and MT5 platforms. Unl

ATR Navigator A professional-grade volatility analysis tool that combines Average True Range (ATR) channels with a real-time dashboard, providing traders with instant market volatility insights.
KEY FEATURES: Dynamic ATR Channels (80%, 100%, 130%) - Individually adjustable Real-time Volatility Dashboard Multi-timeframe Analysis Clear Visual Labels Customizable Settings
WHAT YOU GET: • Six ATR-based volatility channels showing potential support/resistance zones • Professional dashboa
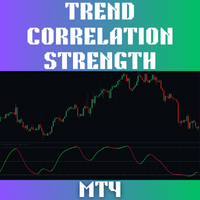
The Trend Correlation Strength (TCS) Indicator is a powerful new tool designed to measure trend strength in a unique and effective way, outperforming traditional indicators like the Average Directional Index (ADX). Instead of relying on directional movement (+DI and -DI), TCS calculates the correlation between closing prices and a linear time series, giving forex traders a distinctive method for identifying strong trends. Key Benefits of TCS Detect Trends Like a Pro : TCS doesn’t rely on lagging

Der MT4-Indikator "Binary Smart Eye" ist darauf ausgelegt, Handelssignale sowohl für binäre Optionen als auch für Forex-Märkte zu liefern, und zwar über eine breite Palette von Zeitrahmen von M1 bis W1. Er verwendet eine proprietäre Strategie, die Trendniveaus, einen intelligenten gleitenden Durchschnitt und optimierte Handelsperioden kombiniert, um potenzielle Einstiegspunkte zu identifizieren. Hier ist eine Aufschlüsselung seiner wichtigsten Funktionen: Multi-Timeframe-Analyse: Die Vielseitigk
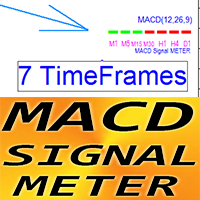
Crypto_Forex-Indikator MACD-Signal-METER für MT4.
- Der sehr nützliche MACD-Signal-METER-Indikator zeigt den aktuellen MACD-Wert (über/unter dem Signal) für 7 Zeitrahmen gleichzeitig an. - Grünes Rechteck – MACD liegt über dem Signal. - Rotes Rechteck – MACD liegt unter dem Signal. - Der Forex-Indikator MACD-Signal-METER kann als Handelseinstiegsfilter für den Multi-Time-Frame-Handel verwendet werden.
// Tolle Handelsroboter und Indikatoren sind hier verfügbar: https://www.mql5.com/en/users/d
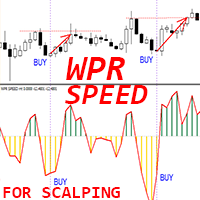
Crypto_Forex-Indikator „WPR SPEED“ für MT4 – großartiges Prognosetool, kein Repaint.
- Die Berechnung dieses Indikators basiert auf Gleichungen aus der Physik. WPR SPEED ist die 1. Ableitung des WPR-Oszillators selbst. - WPR SPEED eignet sich gut für Scalping-Einträge auf Seitwärts- und Seitwärtsmärkten. - Der WPR SPEED-Indikator zeigt, wie schnell WPR selbst seine Richtung ändert – er ist sehr empfindlich. - Es wird empfohlen, den WPR SPEED-Indikator für Momentum-Scalping-Handelsstrategien zu
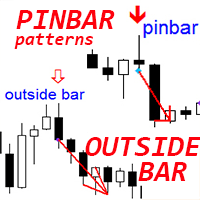
Crypto_Forex-Indikator „Pin Bar & Outside Bar Patterns“ für MT4.
- Der Indikator „Pin Bar & Outside Bar Patterns“ ist sehr leistungsstark für den Price Action-Handel. - Der Indikator erkennt Pin Bar- und Outside Bar-Muster im Diagramm: - Bullisches Muster – Blaues Pfeilsignal im Diagramm (siehe Bilder). - Bearisches Muster – Rotes Pfeilsignal im Diagramm (siehe Bilder). - Kein Neuanstrich, keine Verzögerung. - Mit PC-, Handy- und E-Mail-Benachrichtigungen. - Der Indikator „Pin Bar & Outside Ba
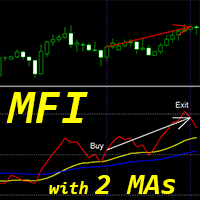
Crypto_Forex-Indikator „MFI und 2 gleitende Durchschnitte“ für MT4, kein Neuanstrich.
- Der Money Flow Index (MFI) ist ein technischer Oszillator, der Preis- und Volumendaten zur Identifizierung überverkaufter und überkaufter Zonen verwendet. - Der Indikator „MFI und 2 gleitende Durchschnitte“ ermöglicht es Ihnen, schnelle und langsame gleitende Durchschnitte des MFI-Oszillators anzuzeigen. - Der Indikator bietet die Möglichkeit, Trendänderungen sehr früh zu erkennen. - Dieser Indikator lässt
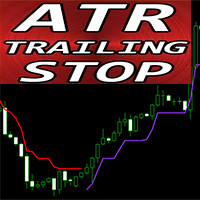
Crypto_Forex-Indikator „ATR Trailing Stop“ für MT4, kein Neuanstrich.
- Verbessern Sie Ihre Handelsmethoden mit dem großartigen zusätzlichen ATR Trailing Stop-Indikator für MT4. - Dieser Indikator ist perfekt für Trailing Stop-Zwecke. - ATR Trailing Stop passt sich automatisch der Marktvolatilität an. - Keine Verzögerungen und einfache Einrichtung. - Dieser Indikator lässt sich hervorragend mit Preisaktionseinträgen in Richtung des Haupttrends kombinieren.
// Tolle Handelsroboter und Indikato
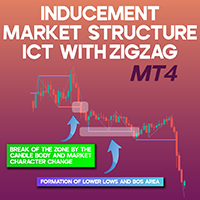
ICT Market Structure Indicator with Inducements MT4
The ICT-style Market Structure Indicator for MetaTrader 4 provides traders with a detailed analysis of Smart Money market dynamics. This tool integrates essential elements such as Change of Character (CHoCH), Break of Structure (BOS), and Inducement Detection (IDM) to give a precise representation of price movement. On the price chart, red lines highlight CHoCH levels, blue lines represent structural breaks, and gray lines indicate inducement
Der MetaTrader Market ist eine einzigartige Plattform für den Verkauf von Robotern und technischen Indikatoren.
Das Merkblatt für Nutzer der MQL5.community informiert Sie über weitere Möglichkeiten: nur bei uns können Trader Handelssignale kopieren, Programme bei Freiberuflern bestellen, Zahlungen über das Handelssystem automatisch tätigen sowie das MQL5 Cloud Network nutzen.
Sie verpassen Handelsmöglichkeiten:
- Freie Handelsapplikationen
- Über 8.000 Signale zum Kopieren
- Wirtschaftsnachrichten für die Lage an den Finanzmärkte
Registrierung
Einloggen
Wenn Sie kein Benutzerkonto haben, registrieren Sie sich
Erlauben Sie die Verwendung von Cookies, um sich auf der Website MQL5.com anzumelden.
Bitte aktivieren Sie die notwendige Einstellung in Ihrem Browser, da Sie sich sonst nicht einloggen können.