Guarda i video tutorial del Market su YouTube
Come acquistare un Robot di Trading o un indicatore
Esegui il tuo EA
hosting virtuale
hosting virtuale
Prova un indicatore/robot di trading prima di acquistarlo
Vuoi guadagnare nel Market?
Come presentare un prodotto per venderlo con successo
Indicatori tecnici per MetaTrader 4 - 6
The CAP Channel Trading is a volatility-based indicator that makes use of the “advanced envelope theory”. These envelopes consist of two outer lines. Envelope theory states that the market price will generally fall between the boundaries of the envelope (or channel). If prices move outside the envelope, it is a trading signal or trading opportunity.
Benefits of the Channel Trading Indicator
CAP Channel Trading works with any asset
It can be applied to any financial assets: forex, cryptocurren
FREE
L' indicatore di zona FVG è un potente strumento progettato per identificare i gap di fair value (FVG) nel mercato, evidenziando gli squilibri di prezzo tra fair value e prezzo di mercato. Questa precisa identificazione dei gap consente ai trader di individuare potenziali punti di entrata e uscita dal mercato, migliorando significativamente la loro capacità di prendere decisioni di trading informate. Con la sua interfaccia intuitiva e user-friendly, l'indicatore di zona FVG analizza automati

GOLDEN ARROW SCALPER! Caratteristiche Principali: Segnali di Ingresso Precisi : Identifica i momenti ideali per entrare sul mercato basandoti su calcoli matematici, ottimizzando così le tue decisioni di trading. Avvisi Istantanei : Ricevi notifiche sonore in tempo reale ogni volta che vengono generati segnali di trading. Impostazioni Personalizzabili : Regola i parametri delle EMA per adattare l'indicatore alla tua strategia e al tuo stile di trading. Visualizzazione Intuitiva : Utilizza colori

YOU CAN NOW DOWNLOAD FREE VERSIONS OF OUR PAID INDICATORS . IT'S OUR WAY OF GIVING BACK TO THE COMMUNITY ! >>> GO HERE TO DOWNLOAD
This system is an Heiken Ashi system based on RSI calculations . The system is a free open source script originally published on TradingView by JayRogers . We have taken the liberty of converting the pine script to Mq4 indicator . We have also added a new feature which enables to filter signals and reduces noise on the arrow signals.
Background
HEIKEN ASHI
Th
FREE

Introducing the Delta Volume Profile Indicator - Unleash the Power of Institutional Precision! https://youtube.com/shorts/znUdz5PEBAY Technical Indicator: Are you ready to trade like the pros? The Delta Volume Profile Indicator is no ordinary tool. It’s a high-precision, cutting-edge indicator that puts the power of institutional-grade trading in your hands. This unique indicator analyses delta volume distribution in real-time, revealing the market's hidden buy/sell imbalances that the biggest
Special offer : ALL TOOLS , just $35 each! New tools will be $30 for the first week or the first 3 purchases ! Trading Tools Channel on MQL5 : Join my MQL5 channel to update the latest news from me Trendlines with Breaks Scanner è uno strumento di trading all’avanguardia progettato per aiutare i trader a identificare tendenze critiche e rilevare rotture in tempo reale. Con linee di tendenza generate automaticamente basate su punti pivot, questo indicatore consente ai trader di cogl
テクニカル指標開発の第一人者であるトム・デマークが考案した TDシーケンシャルは、 トレンドの転換点を判断するのに有用なインディケータです。このインディケータは TDシーケンシャルを裁量およびEAで実際に利用してきた私自身の経験から、より手軽に、かつ効果的に活用できるよう作成された裁量トレード用サインツールです。
強いトレンドが生じている際に多くのだましが生じるのはTDシーケンシャルの弱点と思われますが、これを克服するために強力なフィルターを装備しています。また、最も有効と思われるセットアップ9に絞ってサインを発信します。
全通貨ペア、全タイムフレームで利用できます。勝敗判定機能により、このインディケータの直近の相場環境に対する有効性を確認できます。
設定項目は下記のとおりです。 Enable Protect Mode...強いトレンドが発生した際の連敗を回避します Box Filter...下で設定する3つのタイムフレームでの移動平均でパーフェクト・オーダーが発生していない状態をボックス相場と判定し、サインを限定します Moving Average Time Frame1 Mo

It predicts the most likely short-term price movement based on advanced mathematical calculations.
Features Estimation of immediate price movement; Calculation of the real market trend; Calculation of the most important support and resistance levels; Algorithms optimized for making complex mathematical calculations with a minimal drain of system resources; Self-adjusting for better performance, so it’s able to work properly at any symbol (no matter how exotic it is) and any timeframe; Compatibl

The indicator displays a matrix of indicators across multiple timeframes with a sum total and optional alert. Custom indicators can also be added to the matrix, in a highly configurable way. The alert threshold can be set to say what percentage of indicators need to be in agreement for an alert to happen. The alerts can turned on/off via on chart tick boxes and can be set to notify to mobile or sent to email, in addition to pop-up. The product offers a great way to create an alert when multiple
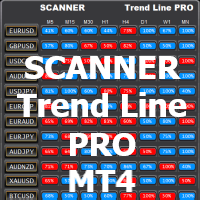
Works with Trend Line PRO indicator and set files made by Optimizer Utility You can download additional programs: here The scanner is developed to get new signals of the Trend Line PRO indicator on all pairs and timeframes from M5 to MN1
For the scanner to work, you should have an indicator. The main advantage of SCANNER Trend Line PRO is the possibility to use an individual set file for each pair and timeframe.
You can automatically set up, change and save settings for each pair in the
FREE
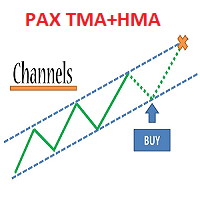
Trade system "PAX Multi TMA/HMA 8"
it is a ready-made trading system for trading on any instrument and any timeframe.
Completely ready for manual trading and use in robots.
Not redrawn.
It is convenient to work on timeframes M30, H1, H4.
Tested on metals, currency pairs, oil, international stocks, Russian stocks, cryptocurrencies, monetary and cryptocurrency indices.
What the trading system consists of:
1. The main channel of price movement named Medina. May be of 3 colors: red - downtr

The Block Master Pro indicator is designed to visually identify areas on the chart where significant volumes from major market participants are likely concentrated. These areas, known as order blocks, represent price ranges where large players place their orders, potentially signaling a price reversal and movement in the opposite direction. Key Features:
Order Block Identification: Block Master Pro effectively identifies order blocks by pinpointing price ranges where large orders are placed. Th

VISUALIZZAZIONE COMPLETA DEL MERCATO FOREX Indicatore del cruscotto
Questo è un indicatore personalizzato creato per offrire ai trader una visione completa di ciò che sta accadendo nel mercato. Utilizza dati in tempo reale per accedere al mercato e visualizzare tutte le informazioni necessarie per fare trading di successo.
INSTALLAZIONE:
Prima di allegare questo indicatore al grafico della finestra, vai al pannello Market Watch del tuo MT4 e NASCONDI tutte le coppie di valute che non ti servo

This scanner is for showing Cross of various TDI elements: PriceLine, Trade Signal Line and Market Base Line And for getting alerts, so you can be prepared for finding good trade setups before they happen. It also shows TDI signals, trend, volatility and different timeframe alignment.
Detailed blog post:
https://www.mql5.com/en/blogs/post/759050
Features: Show TDI Signal and Trend Show Volatility & Overbought/Oversold Show cross between: PriceLine & TSL PriceLine & MBL MBL & TSL PriceLine and

Benvenuti nel nostro modello di ondata di prezzo MT4 --(modello ABCD)-- Il modello ABCD è un modello di trading potente e ampiamente utilizzato nel mondo dell'analisi tecnica.
È un modello di prezzo armonico che i trader utilizzano per identificare potenziali opportunità di acquisto e vendita sul mercato.
Con il modello ABCD, i trader possono anticipare potenziali movimenti di prezzo e prendere decisioni informate su quando entrare e uscire dalle negoziazioni. Versione EA: Price Wave
FREE

Reversal Pattern AI is a groundbreaking advancement in indicator development, combining artificial intelligence algorithms, multi-level market analysis, and classical technical analysis methods. It not only detects reversal patterns but also evaluates market inefficiencies, generating highly accurate trading signals.Thanks to its hybrid model, which utilizes price action analysis, volume, volatility, VWAP, and Volume AVG %, the indicator easily adapts to any market conditions. Reversal Pattern A

Order Block Indicator for ICT and Smart Money Trading in MT4
The Order Block Indicator is an essential tool for traders using ICT (Inner Circle Trader) and Smart Money Concepts on the MetaTrader 4 (MT4) platform. This indicator helps identify crucial price zones where institutional orders are likely to be concentrated, allowing traders to pinpoint potential reversals or high-impact market levels. Bullish order blocks appear in green , while bearish order blocks are displayed in brown . When pri
FREE
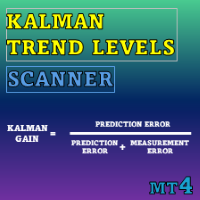
Special offer : ALL TOOLS , just $35 each! New tools will be $30 for the first week or the first 3 purchases ! Trading Tools Channel on MQL5 : Join my MQL5 channel to update the latest news from me Kalman Trend Levels è un indicatore avanzato di follow-up delle tendenze che utilizza la tecnologia all'avanguardia dei filtri di Kalman per fornire ai trader segnali analitici potenti. Progettato per precisione e adattabilità, questo strumento non solo identifica zone critiche di suppor
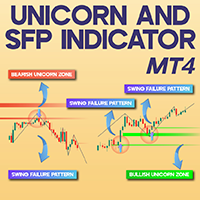
Unicorn + SFP Indicator for MT4 The Unicorn + SFP Indicator is an advanced trading tool integrating liquidity principles with ICT methodology. A Unicorn Zone emerges where a Breaker Block and a Fair Value Gap (FVG) overlap, marking areas with a high probability of price reversal. The Swing Failure Pattern (SFP) occurs when the price falsely breaches a level, indicating potential liquidity grabs and a possible market shift. Features of the Unicorn + SFP Indicator A summary of the indicator's spec
FREE
INDICATORE GRATUITO - CONTI ILLIMITATI - CLICCA QUI PER TUTTI I MIEI PRODOTTI GRATUITI
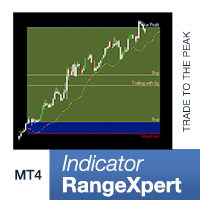
Quando si tratta di individuare l'opportunità perfetta nel mercato e seguire la forte tendenza attraverso un breakout, questo indicatore RangeXpert offre un supporto inestimabile. L'indicatore è stato sviluppato da me appositamente per principianti e semi-professionisti e offre eccezionali funzionalità di analisi che ti consentono di identificare con precisione le opportunità di mercato e o
FREE
MENA TREND INDICATOR & SCANNER Strumento completo per l'analisi delle tendenze su più timeframe ed esecuzione delle operazioni MENA TREND INDICATOR & SCANNER è una soluzione di trading progettata per semplificare l'analisi del mercato attraverso un approccio visivo e strutturato per identificare le tendenze e realizzare operazioni. Questo strumento integra il rilevamento in tempo reale delle tendenze, l'analisi multi-timeframe e il monitoraggio delle performance operative, rendendolo versatile s

Questo indicatore informativo sarà utile per coloro che vogliono essere sempre informati sulla situazione attuale del conto. L'indicatore mostra dati come profitto in punti, percentuale e valuta, nonché lo spread per la coppia corrente e il tempo fino alla chiusura della barra nell'intervallo di tempo corrente. VERSIONE MT5 - Indicatori più utili
Esistono diverse opzioni per posizionare la linea delle informazioni sulla carta: A destra del prezzo (corre dietro al prezzo); Come commento (nell'
FREE
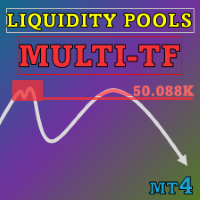
Special offer : ALL TOOLS , just $35 each! New tools will be $30 for the first week or the first 3 purchases ! Trading Tools Channel on MQL5 : Join my MQL5 channel to update the latest news from me L'indicatore Liquidity Pools è uno strumento avanzato che identifica e segna potenziali zone di liquidità sul grafico analizzando aree di massimo e minimo con frequenti tocchi di stoppino, insieme al numero di rivisitazioni e al volume scambiato all'interno di ciascuna zona. Questo strum
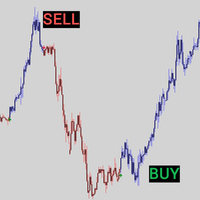
Special offer! Any 2 advisors of your choice for only 99$ Any 2 indicators of your choice for only 49$ -------------------------------------------- The offer is limited in time, don't miss this chance. Write in a private message or in telegram @AlexBotm5 Arrow Candle - These are colored candles that show the trend based on volume and trend slope. This indicator will show you the color change on the next bar of the confirmation candle. Blue candles = possible buy (volume is increasing), Red
FREE
Ultimate Volatility Insight is a highly professional tool for analyzing and fully understanding market activity based on an advanced ATR with improved algorithms and calculation formulas. The indicator helps traders accurately assess market dynamics, identify key support and resistance levels, and effectively manage risks. Ultimate Volatility Insight works only with real data using live statistics. The indicator has been developed for over two years, and its effectiveness has been proven through

Fair Value Gap (FVG) Indicator for MetaTrader 4 – Download and Guide
Traders rely on a variety of tools and strategies to discover profitable investment opportunities. Among these, the Fair Value Gap (FVG) indicator in MetaTrader 4 stands out as a highly effective tool. An FVG represents a price gap within the market structure where supply and demand are not balanced. These gaps emerge during sharp price movements. In simple terms, when three candlesticks form, the gap between the first and thi
FREE

Se stai cercando un indicatore affidabile per fare trading con il concetto ICT, la Struttura di Mercato ICT fornisce un manuale per i trader che usano strategie più avanzate. Questo indicatore tutto in uno si concentra sui concetti ICT (Smart Money Concepts). La Struttura di Mercato ICT cerca di capire come operano le istituzioni, aiutando a prevedere le loro mosse. Comprendendo e utilizzando questa strategia, i trader possono ottenere preziose informazioni sui movimenti del mercato e trovare in

The indicator automatically identifies the 1-2-3 pattern on the chart. The indicator is able to monitor the formation of pattern in real time. It informs the trader when the pattern is completely formed (when the price breaks the line in point 2) and displays the completed patterns in history. The patterns are never redrawn. The indicator can identify patterns on any instruments (currency pairs, stock market, gold, etc.) without the need to adjust to each instrument. Simple and clear visualizati

L'indicatore trova i livelli del volume di prezzo massimo e minimo (profilo di mercato) nell'istogramma di lavoro per il numero specificato di barre. Profilo composito. L'altezza dell'istogramma è completamente automatica e si adatta a qualsiasi strumento e periodo di tempo. Viene utilizzato l'algoritmo dell'autore e non ripete analoghi noti. L'altezza dei due istogrammi è approssimativamente uguale all'altezza media della candela. Smart alert (smart alert) ti aiuta a comunicare il prezzo rel
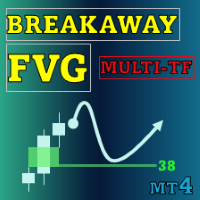
Special offer : ALL TOOLS , just $35 each! New tools will be $30 for the first week or the first 3 purchases ! Trading Tools Channel on MQL5 : Join my MQL5 channel to update the latest news from me Lo strumento Breakaway Fair Value Gaps (FVG) è una soluzione all'avanguardia progettata per aiutare i trader a identificare le aree in cui il prezzo si è discostato dall'equilibrio, offrendo approfondimenti dettagliati sulle probabilità di mitigazione. Questo strumento non solo evidenzia
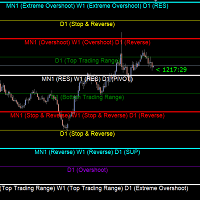
Gold Levels MTF - this is a fine stock technical indicator. The indicator algorithm analyzes the movement of the asset price, displays price levels of support and resistance from all time frames (TF) using the Murray method based on the Gann theory. The indicator indicates overbought and oversold fields, giving an idea of possible reversal points and at the same time giving some idea of the strength of the current trend. Description of levels: (Extreme Overshoot) - these levels are the ultimat
FREE

L'algoritmo trova le zone di volatilità ridotta in base all'indicatore UPD1 Trend Direction e traccia il volume orizzontale massimo in base all'indicatore UPD1 Volume Box . Di norma, un forte movimento di tendenza si verifica quando si esce dall'accumulo. Se il prezzo ha lasciato l'accumulo, può testare il suo volume orizzontale massimo (POC). Smart Alert sono disponibili nelle impostazioni.
Parametri di input.
Impostazioni di base. Bars Count – numero di barre della cronologia su cui verrà e
FREE

Bollinger Bands Breakout Strategy has an Arrows and Scanner Dashboard indicator set. It is for MT4 (Metatrader 4) platform.
When price breaks out of a Bollinger Outer Band in a powerful way, it becomes a great position for scalping. Because the next few bars will most likely keep going in the same direction. Especially if Middle band is also sloping towards that breakout. It's also great for Binary options when using 2-3 next few bars.
Strategy: BUY Bollinger Bands:
- Price breaks out of Bo

TrendCompass is a powerful indicator for trading in the currency and cryptocurrency markets on the MetaTrader 4 platform. This innovative tool is designed to simplify analysis and decision-making in trading. The indicator combines various technical indicators and algorithms to provide accurate and timely trading signals. Key Features:
Multilevel Strategy: TrendCompass is based on a comprehensive strategy that includes analyzing major trends, support and resistance levels, and various technical
CRAZY SALE! Was 250, NOW 50 USD till the end of MAY!!!
---> Check all the other products <---
The WTR Dynamic Range Indicator is a powerful and deeply customizable range indicator that takes in account the average upward and downward movement of the price in the past trading days. This fully customizable indicator can be setted for a lot of uses and cases:
• Trend trading on level breakouts
• Spotting high probability targets for Take Profits
• Setting a multiple targets for position scali

Anchored Volume Weighted Average Price (AVWAP, or Anchored VWAP). Tells you who is in control, the buyers or the sellers. Better than all other moving averages because it adds weight to the traded volume. This technique was made popular by Brian Shannon of Alphatrends. It is calculated by multiplying typical price by volume, and the dividing by total volume. It is very simple to use. 1. Press a number from 1 to 9 on the keyboard, then click the chart where you want to anchor the VWAP. 3. Hold C
FOREX FLIP ALERT - Show where the price will reverse with more than 95% probability. This information will help every trader to effectively open trades. The indicator on the chart draws arrows in which place and in which direction the price will reverse. The indicator does not redraw its arrows and shows price reversals for medium and long distances. This means that after the arrow appears, the price will go in the indicated direction for many points.
Benefits of the indicator: Gives sign
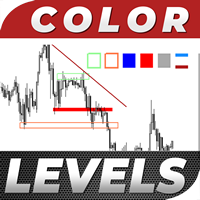
Color Levels is a convenient tool for traders using a Trendline and a Rectangle in their technical analysis. It allows setting two empty rectangles, three filled ones, and two tredlines. The indicator parameters are very simple and divided into numbered blocks: The ones beginning with 1 and 2 - empty rectangle (frame) parameters; 3, 4, and 5 - filled rectangle parameters; 6 and 7 - trendline parameters. Simply click a desired object and it will appear in the upper left corner. Main Adjustable Pa
FREE

This is professional fractals indicator able to work "on several screens" while on a single chart. The product has been developed for scalpers and those relying on "accurate" entries. The indicator shows fractals from six timeframes and displays the distance between the price and a new emerging fractal on lower timeframes showing the price behavior more clearly and making its analysis more accurate on reversal points. The indicator displays fractals from the D1, H4, H1, M15, M5 and M1 timeframes
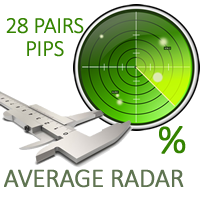
This indicator provides useful information for quantitative analysis. It compares the 28 pairs' pips of the current day with the average of pips made in the previous three days. When in the last three days the pips value is low and the value of today's pips is below, we are in the presence of a volatility compression that will explode soon. The "Range Today" is red if today's figure is less than the range of the previous three days, but turns green when the percentage exceeds 100%. When the rang
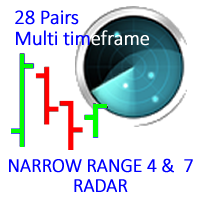
This indicator detects Inside Bar Narrow Range 4 and Inside Bar Narrow Range 7 two powerful patterns on 28 pairs on all timeframes. "Inside Bar Narrow Range 4" is an inside bar with the narrowest range out of the last 4 bars so "Inside Bar Narrow Range 7" an inside bar with the narrowest range out of the last 7 bars.
Hence, IBNR4 and better IBNR7 are an objective criterion for identifying decreased range and volatility. Once we find an IBNR4 or an IBNR7 pattern, we aim to trade the breakout

The Levels indicator has been created to simplify the process of plotting support and resistance levels and zones on selected timeframes. The indicator plots the nearest levels of the selected timeframes, which are highlighted in different colors. It significantly reduces the time needed to plot them on the chart and simplifies the market analysis process. Horizontal support and resistance levels are used to identify price zones where the market movement can slow down or a price reversal is lik
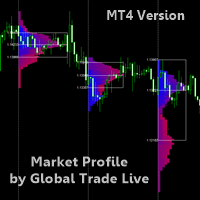
READ THE DESCRIPTION ITS IMPORTANT - ONLY TAKES 2 MINUTES - THIS IS A TOOL NOT A TRADING STRATEGY
Market Profile By Global Trade Live A Market Profile is a graphical representation that combines price and time information in the form of a distribution. A Market Profile is used to determine elapsed time, number of ticks and volumes traded at specific prices, or over a price interval, over a given period. A Market Profile also makes it possible to identify prices accepted or rejected by the mark
FREE

FREE Heiken Ashi Smoothed indicator is fully adjustable, easy to use and comes with possibility to access the indicator via iCustom function so you can use it in your own trading software. Indicator can also pop up alerts when signal changes or send push notifications. For Metatrader 5 version click here: https://www.mql5.com/en/market/product/70825 For detailed information click: >>HERE<< Features
Easy to use Accessible via iCustom Fully adjustable Alerts and Push notifications Possib
FREE

The Scalper Boss indicator is a cutting-edge analytical tool designed to assess market conditions and identify optimal entry and exit points using a multi-layered logic framework. It adapts to changing market environments, providing traders with clear visual signals and trend lines. Its primary value lies in its ability to enhance market analysis by filtering noise and capturing meaningful movements, making it especially beneficial for scalping and intraday trading. While Scalper Boss does not g

Smart Volume Box is designed to give MetaTrader users a powerful, analytical tool for uncovering the hidden dynamics in the market. This precision-built tool, complete with user-friendly settings, integrates essential volume insights and advanced features like Volume Profile, VWAP (Volume Weighted Average Price), and Point of Control (POC) levels. Unlike typical indicators, Smart Volume Box doesn’t provide specific trade signals but instead offers a clearer perspective on market trends, making
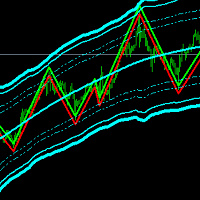
Channel Trend Bands – A Comprehensive Indicator for Market Analysis Simple to Use, Effective in Application User-Friendly and Suitable for All Traders This indicator stands out due to its straightforward functionality. Whether you're a beginner exploring the market or an experienced trader refining your strategy, this tool offers valuable insights. Using a Triangular Moving Average (TMA) with additional ATR-based bands , it provides structured market data to support well-informed decision-makin

MetaForecast predice e visualizza il futuro di qualsiasi mercato basandosi sull'armonia dei dati dei prezzi. Sebbene il mercato non sia sempre prevedibile, se esiste un modello nei prezzi, MetaForecast può prevedere il futuro con la massima precisione possibile. Rispetto ad altri prodotti simili, MetaForecast può generare risultati più accurati analizzando le tendenze di mercato.
Parametri di input Past size (Dimensione passata) Specifica il numero di barre che MetaForecast utilizza per creare
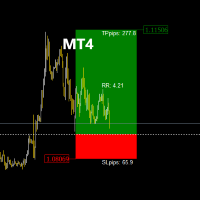
The RR_TradeManager Visualizer is a trade management indicator designed for traders who want to easily visualize their Take Profit (TP) and Stop Loss (SL) levels on a chart. This initial version provides a simple graphical representation that displays SL and TP zones as well as the entry price. Please note that this current version focuses solely on the graphical display of SL and TP zones as figures on the chart. Current Version Features: SL and TP Zones Display: Clear visualization of stop los
FREE
"IF YOU'RE LOOKING FOR A UNIQUE TRADING INDICATOR TO TRADING…AT AN AFFORDABLE PRICE…YOU'VE COME TO THE RIGHT PLACE!" Additional Bonus: You get the ProTrading Arrow indicator for FREE! Many adhere to the rule that if a system has losses, it is not profitable, In forex trading like any business, there are some rules that must be followed. You have to find the strategy that gives the best results. The proper money management and best indicator are the keys to successful trading. Using the adaptive
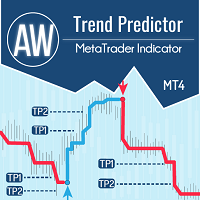
La combinazione di trend e livelli di rottura in un unico sistema. Un algoritmo di indicatore avanzato filtra il rumore del mercato, determina la tendenza, i punti di ingresso e i possibili livelli di uscita. I segnali indicatori sono registrati in un modulo statistico, che permette di selezionare gli strumenti più adatti, mostrando l'efficacia dello storico dei segnali. L'indicatore calcola i segni Take Profit e Stop Loss. Manuale e istruzioni -> Qui / Versione MT5 -> Qui Come fare tradi

How to use Pair Trading Station Pair Trading Station is recommended for H1 time frame and you can use it for any currency pairs. To generate buy and sell signal, follow few steps below to apply Pair Trading Station to your MetaTrader terminal. When you load Pair Trading Station on your chart, Pair Trading station will assess available historical data in your MetaTrader platforms for each currency pair. On your chart, the amount of historical data available will be displayed for each currency pai

Algo Trading Indicaor
With this indicator , you’ll have zones and trends that hight probability the price will reverse from it. so will gives you all the help that you need
Why should you join us !? 1-This indicator is logical since it’s working in previous days movement , to predict the future movements.
2-Algo trading indicator will help you to draw trends which is special and are too strong than the basics trend , trends will change with the frame time that you work on .
3-We can use
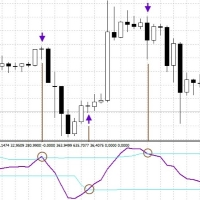
Cyclic Smoothed Relative Strength Indicator
The cyclic smoothed RSI indicator is an enhancement of the classic RSI, adding
additional smoothing according to the market vibration,
adaptive upper and lower bands according to the cyclic memory and
using the current dominant cycle length as input for the indicator. The cRSI is used like a standard indicator. The chart highlights trading signals where the signal line crosses above or below the adaptive lower/upper bands. It is much more responsive
FREE

L'indicatore mostra i livelli Alto/Basso/Apertura/Chiusura da altri intervalli di tempo (e non standard): Anno, 6 Mesi, 4 Mesi, 3 Mesi, 2 Mesi, Mese, Settimana, Giorno, H3-H6-H8-H12 Ore . Puoi anche impostare lo spostamento per l'apertura delle candele e costruire candele virtuali. I "separatori di periodo" per uno di questi intervalli di tempo sono disponibili sotto forma di linee verticali. Gli avvisi possono essere configurati per i breakout dei livelli attuali o precedenti (breakout della l

Questo è un prodotto gratuito che puoi utilizzare per le tue esigenze!
Inoltre apprezzo molto i tuoi feedback positivi! Grazie mille!
// ottimi robot e indicatori di trading sono disponibili qui: https://www.mql5.com/en/users/def1380/seller
Indicatore Crypto_Forex: candele Heiken Ashi per MT4. Nessuna riverniciatura. - Heiken_Ashi_Candles ha una grande combinazione con l'indicatore Trend Line MA come nell'immagine. - L'indicatore Heiken_Ashi_Candles è un indicatore ausiliario molto utile per
FREE

This is the best Support and Resistance Indicator on the market, and it shows both confirmed Support and Resistance as well as Retests. Support & Resistance: Support marks where buying demand halts price declines, acting as a safety net. Resistance caps price surges, driven by selling pressure. Traders leverage these levels to predict reversals, plan entries, exits, and manage risks, making them trading's fundamental guideposts. Join To Learn Market Depth - https://www.mql5.com/en/channels/suv
FREE
This is Multiple Timeframe of Malaysia SNR Levels and Storyline. The single timeframe version here Features: + Display level on multiple timeframe (higher or lower) + Turn on/off level on timeframe + Alert when price touch level 1. if high > resistance level but close of candle < resistance level , this level become unfresh - Name of level will have "(m)" meaning mitigated if close of candle > resistance level , this level become invalid and can be removed in chart (there is setting for keep
Indicatore di Spostamento della Struttura del Mercato e Gap di Valore Equo (FVG) per MT4 Questo indicatore per MT4 identifica spostamenti nella struttura del mercato e gap di valore equo (FVG), fornendo ai trader potenziali opportunità di trading. Avvisa gli utenti di questi eventi tramite notifiche mobili, consentendo loro di reagire rapidamente alle mutevoli condizioni di mercato. Caratteristiche principali: Rilevamento dello Spostamento della Struttura del Mercato: Identifica spostamenti ria
FREE

Multi Divergence Indicator for MT4 - User Guide Introduction Overview of the Multi Divergence Indicator and its capabilities in identifying divergences across multiple indicators.
Importance of divergence detection in enhancing trading strategies and decision-making.
List of Indicators RSI
CCI
MACD
STOCHASTIC
AWSOME
MFI
ACCELERATOR
OSMA
MOMENTUM
WPR( Williams %R)
RVI Indicator Features
Indicator Selection: How to enable/disable specific indicators (RSI, CCI, MACD, etc.) for divergence detectio
FREE
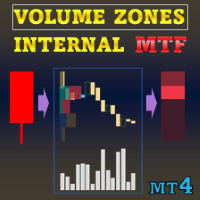
Offerta speciale : ALL TOOLS , solo $35 ciascuno! New tools will be $30 for the first week or the first 3 purchases ! Trading Tools Channel on MQL5 : Join my MQL5 channel to update the latest news from me Volume Zones Internal Visualizer Multi-Timeframe – La soluzione definitiva per ottenere una visione dettagliata dell’attività di volume nei timeframe inferiori mentre operi su un grafico di timeframe superiore. Se cerchi uno strumento di analisi del volume potente e intuitivo, che

Silver Bullet ICT Indicator for MetaTrader 4 The Silver Bullet ICT Indicator is a sophisticated trading tool developed based on the ICT Strategy , covering three specific time windows in New York local time : London Open Silver Bullet: 3 AM – 4 AM AM Session Silver Bullet: 10 AM – 11 AM PM Session Silver Bullet: 2 PM – 3 PM This indicator is optimized for scalping strategies and performs best on 1-minute, 5-minute, and 15-minute timeframes . «Indicator Installation & User Guide»
MT4 Indicator I
FREE
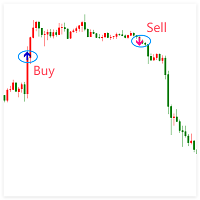
Extreme Breakout Signal is a trading strategy based on price breaking through key support or resistance levels. It indicates potential trend shifts, allowing traders to capture new upward or downward movements.
Parameter extreme radius: extreme radius(Different parameters can be set for different periods) Key Principles Support & Resistance : Prices often reverse near these levels; breaking them may signal a new trend. Confirmation : Use volume or other indicators to verify the breakout's valid
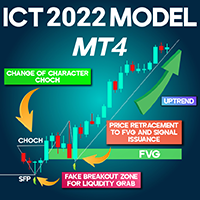
ICT 2022 Model Indicator for MT4 The ICT 2022 Model Indicator is specifically developed based on the principles of ICT trading strategies. It emphasizes critical market behaviors such as liquidity grabs (Sweep), Change of Character (CHoCH), false breakouts (SFP), and fair value gaps (FVG), displaying these elements directly on the price chart.
Once the necessary confirmations are met, the indicator generates a buy signal with a green arrow and a sell signal with a red arrow to assist traders in
FREE

Se ti piace questo progetto, lascia una recensione a 5 stelle. Questo indicatore disegna i prezzi aperti, alti, bassi e di chiusura per i
specificati
periodo e può essere regolato per un determinato fuso orario. Questi sono livelli importanti guardati da molti istituzionali e professionali
commercianti e può essere utile per voi per conoscere i luoghi dove potrebbero
essere più
attivo. I periodi disponibili sono: Giorno precedente. Settimana precedente. Mese precedente. Precedente trimestre. A
FREE

This is a mini version(One pair) of Advanced Detector of Trend Reversal and Continuance known as TrueTrendStarM(TTSm25). It is a sensitive and Predictive indicator of Price Trends for Professional traders. ( WEEKEND DISCOUNT OFF ! )( ATTENTION BUYERS:- PLEASE CONTACT ME FOR HOW BEST TO USE THE INDICATOR FOR MAXIMUM PROFITS )
It detects high odds changes in Price Trend direction long before other indicator detects it. I have been working on it since 2019. This is possible due to fractal

SuperTrend Starter - Yes Trading (over 100 Downloads in 10 days)
The SuperTrend Starter - Yes Trading indicator is a powerful, user-friendly tool designed to simplify market trend detection and provide clear trading signals. By combining the Commodity Channel Index (CCI) with a Moving Average (MA) filter, this indicator helps traders make informed decisions with precision and confidence. Key Features & Benefits Trend Detection: Easily identifies uptrends (price above the SuperTrend) and dow

MASTER MA è un indicatore basato su cross average mobile, che utilizza 3 medie mobili con periodi diversi incrociati per generare segnali, la strategia è molto semplice, ma l'indicatore ha un cruscotto di statistiche che mostra utili risultati di test retrospettivi istantanei come tasso di vincita / profitti totali vinti... ecc., questo indicatore ha input TP e SL in punti in modo da poter avere il tuo TP e SL desiderati visibili sul grafico sotto forma di punto verde per TP e x rossa per SL, l
Indicatore Big Candle Scanner Dashboard MT4 Panoramica Il Big Candle Scanner Dashboard MT4 è un potente strumento progettato per analizzare più coppie di valute e intervalli di tempo al fine di rilevare grandi candele rialziste e ribassiste. Questo indicatore aiuta i trader a identificare rapidamente potenziali punti di breakout o inversione. Lo scanner supporta tutte le principali coppie di valute, minori ed esotiche, inclusi asset popolari come BTCUSD e XAUUSD. Funziona su tutti i timeframe, d
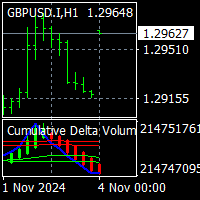
To get access to MT5 version please click here . This is the exact conversion from TradingView: "Cumulative Delta Volume" by "LonesomeTheBlue". The screenshot shows similar results from tradingview and Metatrader when tested on ICMarkets on both platforms. This is a light-load processing and non-repaint indicator. All input options are available. Buffers are available for processing in EAs. You can message in private chat for further changes you need. Thanks for downloading
Il MetaTrader Market è un sito semplice e pratico dove gli sviluppatori possono vendere le loro applicazioni di trading.
Ti aiuteremo a pubblicare il tuo prodotto e ti spiegheremo come prepararne la descrizione per il Market. Tutte le applicazioni sul Market sono protette da crittografia e possono essere eseguite solo sul computer dell'acquirente. La copia illegale è impossibile.
Ti stai perdendo delle opportunità di trading:
- App di trading gratuite
- Oltre 8.000 segnali per il copy trading
- Notizie economiche per esplorare i mercati finanziari
Registrazione
Accedi
Se non hai un account, registrati
Consenti l'uso dei cookie per accedere al sito MQL5.com.
Abilita le impostazioni necessarie nel browser, altrimenti non sarà possibile accedere.