Смотри обучающее видео по маркету на YouTube
Как купить торгового робота или индикатор
Запусти робота на
виртуальном хостинге
виртуальном хостинге
Протестируй индикатор/робота перед покупкой
Хочешь зарабатывать в Маркете?
Как подать продукт, чтобы его покупали
Торговые роботы и индикаторы для MetaTrader 5 - 39
El indicador trabaja con patrones funcionales y divergentes obteniendo del mercado las mejores señales para compra y venta, ha sido testeado por 2 años mediante la estrategias personalizada. El indicador envia la señal para la compra y venta de acuerdo al analisis desarrollado en el mercado. Solo ha sido comprobado en el mercado de indice sintetico (CRASH, BOOM VOLATILITY, STEP)
FREE

Are you a trend surfer like us? Do you use Moving Averages too? Ever wanted the are between them to be painted? Yeah, we solved this problem with the Filled MAs indicator! It is very simple, just puts two fully customizable Moving Averages on chart and fill the space between them, changing the color as they intersect. Thanks to gmbraz for the version 1.1 idea. Any questions os suggestions please contact me! Enjoy!
This is a free indicator, but it took hours to develop. If you want to pay me a
FREE

Description This is an indicator for MT5 which has enhanced the "Fractals" indicator. "Fractals" indicator is included in MT5 by default but the draw line period is fixed at "5" and it cannot be modified. Thus I have reinvented the Fractals indicator with some useful function added. This tool will be useful especially for those who are learning how to draw good horizontal lines and wants to get some reference. Of course, those who are considering Fractals as an important horizontal line wil
FREE

AliSession Highlight is an indicator that highlights a specific period of time according to your preferences. It can help you gain a clear vision of price movements into a specific session, the range of a session, and also to easily identify the high and low of the session. You can use it on any currency pairs, indices, and any timeframes. Settings: Start Hour: Set the hour to initiate the session highlight. Start Min: Set the minute for the start of the session highlight. End Hour: Specify the
FREE

The utility places a grid of pending orders . You can select the number of orders in the grid, the step between orders, multiplier for the order size, SL and TP levels and the magic number. MT4 version of the utility is avaliable by the link - https://www.mql5.com/en/market/product/73490 If you like this utility, take a look at my other products - https://www.mql5.com/en/users/nina_yermolenko/seller
FREE

Этот индикатор изучает ценовое действие как совокупность ценовых и временных векторов, и использует средний вектор для определения направления и силы рынка. Этот индикатор выделяет краткосрочную направленность и силу рынка, он может быть использован для получения выгоды от краткосрочных колебаний цен при помощи торговли по пробоям или бинарных опционов.
С легкостью находит направление рынка Подтверждается пробоями или другими индикаторами Красный осциллятор означает медвежье движение Синий осц
FREE

Whether you are a scalper or daily trader, you will always look for bullish / bearish engulfing candles. This can be a bit tricky and stressful when you try to visually identify the engulfing candles on the chart. Not only that, you might be trading on the M15 time frame but the engulfing candle is forming or has already formed in the H4 time frame. This indicator is made to do that on your behalf. You can trade on any time frame and see Engulfing candles of another time frame, this means that
FREE

DONCHIAN CHANNEL DC Это индикатор тренда, разработанный “ Richard Donchian”, состоящий из 3 слоев: верхнего канала, нижнего канала и среднего канала. Он создается на канале Donchian путем нанесения на ценовой график самой высокой и самой низкой цены, достигнутой за прошедший период. Он также используется для измерения волатильности рынка, поскольку это расширяющийся/сокращающийся канал в зависимости от увеличения/уменьшения волатильности цен. Method 0; Чертеж индикатора канала Donchian. BUY/SELL
FREE

The Buyside & Sellside Liquidity indicator aims to detect & highlight the first and arguably most important concept within the ICT trading methodology, Liquidity levels. SETTINGS
Liquidity Levels
Detection Length: Lookback period
Margin: Sets margin/sensitivity for a liquidity level detection
Liquidity Zones
Buyside Liquidity Zones: Enables display of the buyside liquidity zones.
Margin: Sets margin/sensitivity for the liquidity zone boundaries.
Color: Color option

The "YK-LOT-SIZE" is a custom indicator for MetaTrader 5 (MT5) that displays the total lot sizes and profits for both buy and sell positions on the current chart. Key features of the indicator: It calculates the total lot sizes for all open buy and sell positions of the current symbol. It calculates the total profits (including commissions and swaps) for all open buy and sell positions. The indicator displays the information on the chart using two lines of text: "BUY Lots: [total buy lots] | BUY
FREE

PipTick Session — это очень простой индикатор, помогающий выделять торговые сессии. Например, его можно использовать для разделения европейской, американской и азиатской сессии.
Основные характеристики Индикатор показывает пользовательские торговые сессии Оповещения о начале и окончании сессии Пользовательское время сессии Работает на всех таймфреймах (M1, M5, M15, M30, H1, H4, D1, W1, MN) Настраиваемые параметры (цвет, оповещение...) Может использоваться для создания советников Предназначен д
FREE

El indicador "Time Broker Deriv" está diseñado específicamente para su uso en los índices sintéticos Boom y Crash, así como en otros pares de trading disponibles en la plataforma MT5. Su función principal es proporcionar la hora del broker en comparación con nuestra hora local. Es importante destacar que el indicador "Time Broker Deriv" solo muestra la hora del broker.
FREE

Trade Copy is an EA-shaped tool that replicates the trades done on a Meta Trader 5 to all Meta Traders 5 opened on same computer. Is useful if you want to trade more than once account yours or if you want to work with third party account management. Demo version: https://www.mql5.com/pt/market/product/40906 MT4 version: https://www.mql5.com/pt/market/product/40902/ Configurations: MAIN OPTIONS Idiom - change to English or Portuguese. Copy trades from - specify if the trades will be copied fro

ONLY 3 COPIES OUT OF 10 LEFT AT $50! After that, the price will be raised to $200. EA with the idea of using the "High Risk - High Reward" strategy. You should use the EA with the same capital as my trading signal, withdraw profits regularly and only use lot size 0.01 no matter the capital. The strategy was Back-tested Stable from 2016 to 2021 using every tick based on real ticks in MT5 using Dukascopy Real Ticks 100% tick quality. Live trading is going well on many different brokers - REAL S
The Big Mac B MQL5 expert advisor is a based off a Bollinger breakout strategy. The MACD indicator is used to confirm either a buy or sell trend. The MFI indicator to act as a trading range to ensure that the buy or sell is not activated when the price is in an overbought or oversold condition.
Trades will only be entered if the current price is within the trading range of the MFI indicator. Default settings are for the USDJPY on the 5 minute time-frame.
To work with the news server, you must
FREE

Time and Price Fractal Studies is an indicator that will help you identify certain patterns that tend to repeat themseleves at certail times of the day or at certain prices. It is used to study Fractal Highs ad Lows in relation to time and price. You will get to answer certail questions like: At what time of day does this market usually turn around. At what price does the market turn. Is it at round numbers etc.
FREE

Candle High Low
Indicator showing High and Low of X candles across a line.
Settings Candle number for calculation (>= 1 ) - Define the number of candles for the indicator to find the maximum and minimum of that period of candles. Continuation of the line's display to the right - If you want the High and Low line to extend to the right edge of the graph Line High Color - Set line color Line High Style - Set line style Line Low Color - Set line color Line Low Style - Set line style
FREE

Данный советник - это результат многолетних разработок. Я специализируюсь в основном на сеточных и хеджирующих стратегиях, весь свой опыт и знания я передал в данном эксперте. В результате мы имеем гибко настраиваемый шаблон эксперта и несколько хороших стратегий на выбор трейдера, стратегии торговли будут постоянно добавляться, и эксперт останется актуальным и будет в топе даже через 10 лет. Иными словами, приобретая данный продукт, Вы получаете гибко настраиваемый советник с постоянной поддер

Если вам нравится этот проект, оставьте 5-звездочный обзор. Следуйте на instagram: borelatech Как институционалы торгуют большими объемами, для них не должно пытаться
защищать свою позицию на определенных процентных уровнях. Эти уровни будут служить естественной поддержкой и устойчивостью, которую вы
можете использовать
либо войти в торговлю или быть в курсе возможных опасностей против вашей
позиции. Этот осциллятор покажет вам вариацию процент для: День. Неделя. Месяц. Квартал. Год. В под
FREE

With Break Even Trader placed onto your chart, it will automatically place the stop loss and take profit levels when you open a buy or sell order. And when you are in profit by the amount defined in user settings, it will automatically move your stop loss to that break even level, thereby protecting your trade from a loss. Features :
Simple to trade with you just enter your trade it will place the stop loss and take profit as input in user inputs. Sends you an alert when your trade is in profi
FREE

This indicator demonstrates the probable dynamic support and resistance levels of EMA, Ichimoku lines, and Key OHLC levels for different timeframes on one chart. This can drastically reduce the time and effort needed for switching between different timeframes.
EMA and Ichimoku Levels are drawn for the M1, M5, M15, M30, H1, H4, and D1 timeframes, and the Key OHLC levels of the last periods are drawn for the H4, D1, W1, and MN1 timeframes.
FREE
This indicator monitors the vital constants of your trading account to keep it healthy and away from excessive risks. It monitors all trades, absolute exposure, account floating point and leverage currently in use, using different color codes for your interpretation. [ Installation Guide | Update Guide | Troubleshooting | FAQ | All Products ] Amazingly easy to understand The indicator is clean and simple It calculates exposure by pairs and currencies Keep your used leverage controlled at all t
FREE

This indicator is an automated version of the Fibonacci retracement (Fib) indicator. Deciding the best areas to use when drawing the fib can be tricky and this indicator was made with that in mind. When you drop it on the chart it will automatically choose the best points to draw the fib with, but in case you aren't satisfied with those regions, you can adjust it as you wish.
FREE

Ever wanted to use StochRSI on MetaTrader5 Terminal which you see and use on TradingView? Now you can use same StochRSI indicator in your MetaTrader5 and enjoy more time in Trading.. You can change StochRSI settings if you want to change and it will be ready to use for you... Now you will not go anywhere to use only indicator there... Open charts , load Indicator this Indicator and you are ready to do analysis in MetaTrader5 and Put Trades when you feel okay with your analysis.
FREE

TransitGhost Signal indicator, this is one of my best forex trading strategy. The strategy is based on the simple moving average cross, 5 SMA AND 200 SMA of which take a longer time to cross. Whenever the is a cross between the 5 SMA and 200 SMA a signal will be given, when the 5 SMA cross the 200 SMA to the upside ,a buying arrow will appear on chart, and push notification(alert) "Buy now, use proper risk management" will be sent on both the MT5 PC and mobile app, and when the 5 SMA cross the 2
FREE

Фрактальный индикатор показывает последние уровни поддержки и сопротивления. Если цена пробивает уровень и закрепляется то индикатор рисует ромб желтого или малинового цвета сигнализирующий о возможном продолжении движения в сторону пробоя. Настройки индикатора: - BarCount: задает минимальное количество баров необходимых для построения фрактала. Индикатор лучше использовать в совокупности с другими индикаторами.
FREE

CANDLESTICK_MT5
Очень интересный индикатор свечных паттернов, конвертированный из бесплатной версии индикатора CANDLESTICK для терминала MetaTrader4 в версию для терминала MetaTrader5. Помимо свечных паттернов, он рисует линии поддержки и сопротивления, которые отлично отрабатываются ценой на графике. Может работать на любом таймфрейме. Имеет простые настройки. При конвертировании были максимально сохранены логика работы и дизайн оригинального индикатора CANDLESTICK для терминала МТ4.
FREE
SignalDeMarker - стабильный в своей работе автоматический советник. Алгоритм работы советника основан на определении рыночных зон перекупленности/перепроданности, выстраиваемых на основе оценки текущего спроса и уровня риска. Индикатор устанавливается обычным образом, на график с временным периодом D1 и работает с любым торговым инструментом. Параметры Expert_MagicNumber =1234 - магик номер
Signal_StopLevel =50.0 - уровень стоп-лосса (в пунктах)
Signal_TakeLevel
FREE

Promo price: 179.99 (first 10 purchases)
J# (Jay Sharp) is an EA that has been a result of careful analysis of the cross pair behaviors which results into a strong performing EA with the risk tailored to your appetite. J# uses Grid in its strategy: primarily to escape bad entries which are not frequent, however happen along with the 2 level grid mechanism for a better protection. J# is a fully testable and reproducible advisor where the real trades fully matching historical ones so it can be
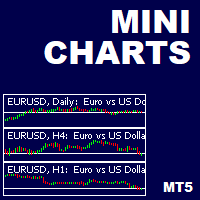
This is a utility indicator that creates mini charts on left side of the chart you are looking at.
It is very useful to watch many timeframes simultaneously, without having to change between multiple charts. Its configuration is very simple. You can have up to 4 mini charts opened. They automatically load the template of the "parent" chart. If you have any doubt please contact me. Enjoy!
This is a free indicator, but it took hours to develop. If you want to pay me a coffee, I appreciate a lot
FREE

Данный индикатор отображает график крестики-нолики (графики PnF) в окне индикатора. Такие графики показывают только те изменения цены, что больше указанной величины порога (размера клетки). Это позволяет скрыть шум и сконцентрироваться на основных трендах. Время здесь не берется в расчет. Учитывается только движение цены. Вот почему график крестики-нолики не синхронизируются с основным графиком, к которому он прикреплен. Более подробную информацию о графиках крестики-нолики можно узнать в Википе
FREE

Moving Average 4 TimeFrames
Display 4 moving averages of 4 different timeframes on the same chart. In order not to pollute the chart, the indicator will plot the complete average only in the current timeframe of one of the 4 registered averages, for the other timeframes of registered averages the indicator only displays a part of the average so that you know where it is at that time graphic.
Example:
Display on the 5-minute chart where the 200-period arithmetic moving average of the 5 min
FREE

40% off. Original price: $50 Support and Resistance Dashboard for MT5 is a multi-timeframe and multi-symbol scanner and alert system that finds S/R zones and pivot points for all timeframes and symbols and alerts when price has interaction with them. If you are using support and resistance (or supply and demand) zones in your trading strategy, this dashboard and its alert and filtering system is a big time saver for you. Download demo version (works on M4,M5,M6,M12,H3,H8 timeframes) Full desc

This EA is a robot based on two EMAs and an standard MACD. No martingale or grid strategies. All positions have their own stop-losses. Trading strategy: This robot uses fast and slow EMAs to check the trend of the currency, once the trend is known, the standard MACD will trigger the correct order. Placing the best take profit and stop loss depending on the strengh of the trend. The Expert Advisor is designed for best performance in EURUSD currency pair at a 15m timeframe. Both slow EMA and fast
FREE
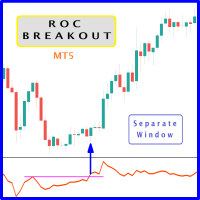
When prices breakout resistance levels are combined with Rate of Change oscillator "ROC" breaks out its historical resistance levels then higher chances emerges to record farther prices. It's strongly encouraged to confirm price breakout with oscillator breakout since they have comparable effects to price breaking support and resistance levels; certainly short trades will have the same perception. Concept is based on find swing levels which based on number of bars by each side to confirm peak or
FREE

This product contains following indicators: (Lines + LineSAR + Channels + BTL + Ladder) Phi Lines - special EMAs, similar to MIMAs from Phicube; Phi LineSAR - erase and highlight Phi Lines in support or resistance. Similart to MIMASAR from Phicube; Phi Channels - show support and resistance, similar to Phibo from Phicube (Green and Read Lines); Phi BTL - candles color following Phi Lines alignment; Phi LADDER - Indicator that allow you to visualize possible targets.
FUTURO Tool Future to

Отображает дивергенцию для любого индикатора пользователя. Достаточно указать имя индикатора, по умолчанию используется DeMarker . Дополнительно можно задать сглаживание показаний выбранного индикатора и уровни, при пересечении которых можно получать оповещение. Пользовательский индикатор должен быть скомпилирован (файл с расширением EX5) и находиться в директории MQL5/Indicators клиентского терминала или вложенной поддиректории. Используется нулевой буфер заданного индикатора с параметрами по у
FREE

Sync Cursor MT5 | MT4 Sync Cursor MT4 https://www.mql5.com/en/market/product/118067 MT5 Tool will It make the Horizontal Line + Vertical Line in the Screen That it is always present on the screen and that it moves along with the candle (with the price). I am sure that something so simple will be a Treasure in the hands of many people.
Some of my personal trades are posted voluntary and free of charge in this Public channel https://t.me/FXScalpingPro
Contact: https://t.me/TuanNguyenTrader
FREE

Сеточный эксперт с обученной нейросетью для валютной пары GBPUSD, т аймфрейм H1. Полностью готов к работе. Эксперт определяет тренд и открывает серию ордеров на каждой коррекции цены. Есть возможность ограничения количества ордеров в каждой сетке ордеров. Для работы вы можете использовать стандартный лот или процент от свободных средств. Эксперт тестировался на счёте с плечом 1:100, при другом плече, измените параметр Percent.
Параметры PlusB - минимальная прибыль

Strategy on Nasdaq with 5-minute candles. It executes frequent trades on a daily basis. Profitable since 2018, it is a solid strategy, not based on martingale or Grid, its core is a combination of price action and indicators optimized for buying or selling. It operates with pending orders executed during moments of volatility. Its quality-price ratio is amazing By default, the robot opens one lot; be careful with the drawdown. One lot for an account of $100,000 generates an annual drawdown of 13

Auto Levels is a technical analysis indicator designed to automatically identify and draw support and resistance levels on price charts. The robot is capable of automatically identifying support and resistance levels based on historical price patterns, eliminating the need for manual analysis. You can set the maximum number of lines that the indicator plots as a parameter
FREE
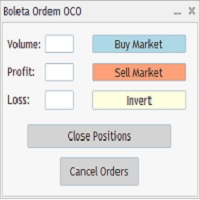
The "OCO Order Boleta" ("Boleta Ordem OCO") allows you to trade using OCO orders in Meta Trader 5 simply and quickly.
To use it, just inform which market you are trading in, whether B3 or Forex, in the initial parameters and fill in the Lot size (or volume) and the distance, in points, from the takeprofit and stoploss. Then, if you want to buy or sell to the market, just click on the respective button ("Sell Market" or "Buy Market") and the order will be sent and executed to market with t

up down v6 for mt5 is no repaint all timeframe and all pairs indicator. red histogram cros trigger that is up point,and put a red point on histogram. and blue histogram cros trigger that is deep point.and put blue point on histogram. this indicator need to sometimes zoom out .for thise pres + button. if newly comes signal is too high makes before invisible.red and blue points are there.to see the signals. indicator is no repaint and can use all time frame and all pairs. only need minimum 500 bar

Our Spike Detector is specifically engineered to cater to the unique needs of traders in the Boom and Crash indices markets. This tool is optimized for M1 (1-minute) and M5 (5-minute) timeframes, ensuring you receive timely and actionable insights.
Key Features:
1. **Non-Repainting**: Our detector guarantees accuracy with non-repainting signals, ensuring your data remains consistent and reliable. 2. **Push Notifications**: Stay updated with real-time push notifications, so you never miss a

The indicator show Higher timeframe candles for ICT technical analisys Higher time frames reduce the 'noise' inherent in lower time frames, providing a clearer, more accurate picture of the market's movements.
By examining higher time frames, you can better identify trends, reversals, and key areas of support and resistance.
The Higher Time Frame Candles indicator overlays higher time frame data directly onto your current chart.
You can easily specify the higher time frame candles yo

The KT Knoxville Divergence is a powerful tool that reveals unique price divergences in a financial instrument by employing a carefully crafted combination of the Relative Strength Index (RSI) and a momentum oscillator. This indicator effectively captures subtle variations in market dynamics and assists traders in identifying potentially profitable trading opportunities with greater precision. Knoxville Divergences is a type of divergence in trading developed by Rob Booker. Divergence in tradin
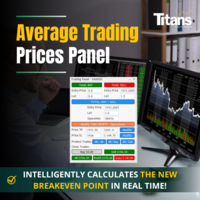
️ Вы ищете способ более эффективно и прибыльно торговать на рынке Форекс? У нас есть решение, которое вы ищете! Представляем наш инновационный советник Entry Price Averages, революционный инструмент, предназначенный для максимизации вашей прибыли и минимизации рисков. Что выделяет наш советник из толпы? Ответ прост: автоматический расчет средних цен. Представьте себе, что у вас есть возможность управлять несколькими открытыми сделками с разными лотами и уровнями цен, а ваш советник сделае

Версия " Стохастического осциллятора " с применением алгоритмов Сингулярного Спектрального Анализа SSA является эффективной методикой обработки нестационарных временных рядов с неизвестной внутренней структурой. Он используется для определения основных составляющих (тренд, сезонные и волновые колебания), сглаживания и подавления шума. Метод позволяет находить заранее неизвестные периодичности ряда и строить прогноз исходя из обнаруженных периодических закономерностей. Сигналы индикатора идентичн
FREE

Introducing the Order Block Indicator , the pinnacle of trading technology. Order blocks, the large cluster of buy or sell orders placed by institutional traders, significantly influence market direction. They form at critical price levels and can act as robust support and resistance zones. Our cutting-edge indicator allows you to harness the full potential of these influential market dynamics, providing a never-before-seen level of precision and customization. Here's why this tool stands apart:

The DR IDR Range Indicator PRO plots ADR, ODR and RDR ranges for a given amount of days in the past. A key feature that appears is that it calculates the success rate of the ranges for the shown days. This indicator is perfect for backtest since it shows ranges for all of the calculated days, not just the most recent sessions. In the PRO version you can now: use fully customizable advanced statistics to base your trades on get an edge via calculating statistics on up to 3 different day period

An indicator based on candlestick patterns
To catch short-term and long-term trends
If it gives a signal in the direction of the trend, it is long term
And if it gives a signal in the opposite direction of the trend, it is short term
Too many signals
Can be used in all symbols
Can be used in all time frames
Attributes: Too many signals Can be used in all symbols Can be used in all time frames Simple settings Simple and fast usage With author lifetime support
Settings: Candle back: Th

KT Momentum Arrows Indicator is based on a momentary breakout which is calculated using the bands deviation and emerging volatility in a certain direction. A buy signal is generated when the price closes above the upper band and a sell signal is generated when the price closes below the lower band. A magnitude coefficient is used as the input which affects the band deviation and volatility at the same time. The coefficient value should be carefully selected and analyzed based on the instrument a

Утилита для автоматического закрытия сделок по уровням трейлинг-стоп. Позволяет взять максимум с прибыли. Создан профессиональным трейдером для трейдеров. Утилита работает с любыми рыночными ордерами, открытыми трейдером вручную или при помощи советников. Может фильтровать сделки по магическому номеру. Одновременно утилита может работать с любым количеством ордеров. MT4 version https://www.mql5.com/ru/market/product/56487 ЧТО МОЖЕТ УТИЛИТА: устанавливать виртульные уровни трейлинг-стоп

KT Supply and Demand indicator identifies and plots key supply and demand zones. It achieves this by analyzing swing points and integrating them with a multi-timeframe analysis, ensuring that only the most crucial supply-demand zones are highlighted. This advanced method highlights the regions where prices are likely to reverse, stemming from significant supply-demand zones established by recent price movements.
Features
Precision Analysis: Our refined algorithm is designed to accurately pi
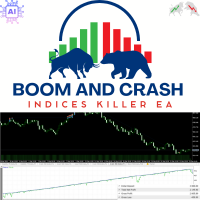
Introducing the Boom and Crash Indices Killer EA for MT5 Welcome to the next evolution in trading with the Boom and Crash Indices Killer EA, specifically designed for MetaTrader 5 (MT5). This expert advisor (EA) is engineered to trade Boom and Crash indices with unparalleled precision, leveraging advanced price action strategies. Here’s a comprehensive overview of what makes this EA a must-have tool for traders looking for consistent profitability and robust performance. Key Features and Benefi

ЭТО БЕСПЛАТНАЯ ВЕРСИЯ РАСШИРЕННЫХ УРОВНЕЙ PRICE ACTION
бесплатно на месяц, но на демо-счете.
полный продукт: https://www.mql5.com/en/market/product/94338 Точные горизонтальные уровни поддержки и сопротивления Точно для анализа ценового действия. Все рынки: форекс, акции, индексы, металлы, товары и криптовалюта Доступно для метатрейдера 5 Регулируемые параметры я думаю это все
Поговорите со мной в телеграмме: @ https://t.me/Userrrrrrrrrname
Прямые продажи находятся на уровне 19 долларов.
FREE

Please check the " What's new " tab regularly for a complete and up-to-date list of all improvements + parameters. FREE indicator for my trading utility Take a Break . This indicator allows you to manage multiple other EAs with just one Take a Break EA instance. Simply specify the corresponding Chart Group in the indicator(s) and Take a Break EA settings and you are good to go.
Setup examples (Indicator + EA)
As a prerequisite, add the URL https://trading.custom-solutions.it to the list of
FREE

Советник для скальпирования фьючерса BR на ММВБ. Внутридневный, в 23=45 закроет позицию. Работает на 15-ти минутках. По появлению отфильтрованного индикаторами сигнала на покупку/продажу выставляет отложенный ордер. Более короткий вариант таймфрейма выбирать не рекомендую из-за введенных ограничений для переменных в примененных индикаторов. Мартингейл не применён, EA тестирован на ММВБ на срочном рынке и только на фьючерсах BR. Для демонстрации результатов на склейке, параметры дооптимизи
FREE

Several assets in several markets have the behavior of using specific numbers as Force Numbers, where support, resistance and price thrust is created. Let this indicator draw those levels of support and resistance for you. You can also stack it to show different level of Prices! This technique is being used by Tape Readers and Order Flow traders all over the world for a long time. Give it a try. Challenge yourself to study new ways of Price Action!
SETTINGS
What Price reference to use in th
FREE

Индикатор Custom Panel позволяет вам собрать всю необходимую информацию в одной таблице.
Содержимое таблицы можно настроить самостоятельно. В каждой из строк отображается состояние выполнения заданных условий или значения. Столбцы таблицы соответствуют таймфреймам. Панель может содержать до 10 строк и до 8 столбцов. Примеры использования:
Строка(Row) : Price > EMA(30)
Режим(Mode) : YES_NO
Значение : проверка условия: Price > EMA(30)
Строка : Ask < Bands[L]
Режим : YES_NO
Значение : пров
FREE
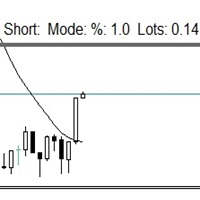
Этот небольшой инструмент поможет вам определить управление рисками с помощью простого перетаскивания линии на графике. Он показывает фактический размер лота, рассчитанный на основе % счета или фиксированной суммы денег непосредственно на линии.
Все, что вам нужно сделать, это активировать линию, нажав клавишу «t» на клавиатуре, и перетащить линию к точке стоп-лосса. Вот и все.
В настройках вы можете определить цвет и толщину линии и текста, а также расстояние от текста до строки и справа,
FREE

FRB Trader - Our mission is to provide the best support for our clients through content and tools, so they can achieve their expected result. - If you have any questions or suggestions, please contact us. Your feedback is very important to us.
FRB Buy Agression
The indicator displays the Buy Aggression Balance of the selected TIMEFRAME through a histogram in a new window. This indicator can only be used if the broker provides data on volumes. In the forex market, most brokers do not provide
FREE

This is my version of the famous VWAP indicator.
Channel Group: Click Here
You get: - Default VWAP Line - First and second deviation zones - Previous day levels Very simple to use, one of the best tools for day trading. Can be used on any TF and on any symbol. Don't use for entries, use as a trend filter. Add supporting indicators
I would recommend to use the indicator on either 15M or 5M chart.
FREE

Более года реального мониторинга! ПРОМО ЦЕНА - 99$ (обычная цена 499$)
Версия для МТ4
ENS FX SCALPER – АВТОМАТИЧЕСКИЙ РОБОТ ДЛЯ ТОРГОВЛИ НА FOREX
ПРЕИМУЩЕСТВА Скальпинговая стратегия без сеток и мартингейла Вход лимитными ордерами и выход по TakeProfit для наилучшего исполнения без проскальзываний Реальный и виртуальный уровень StopLoss Модифицированные индикаторы для точного входа в рынок и выхода, не дожидаясь просадок Оптимизация на реальной тиковой истории разных брокеров с 2015 го

Легендарный скальпер теперь на маркете! ПРОМО ЦЕНА - 99$ (обычная цена 499$)
EURONIS SCALPER – АВТОМАТИЧЕСКИЙ РОБОТ ДЛЯ ТОРГОВЛИ НА FOREX
Версия для МТ4 здесь!
ПРЕИМУЩЕСТВА Скальпинговая стратегия без сеток и мартингейла Вход лимитными ордерами и выход по TakeProfit для исполнения без проскальзываний Реальный и виртуальный StopLoss Хеджинг и неттинг (рыночное исполнение) Модифицированные индикаторы для более точного входа в рынок и выхода, не дожидаясь просадок Оптимизация на реальной
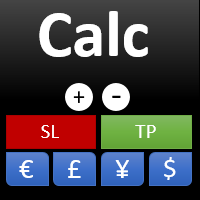
Данный индикатор предоставляет все полезную информацию о символе, счете, позициях и прибыли. Он разработан, чтобы улучшить управление капиталом трейдеров.
Параметры Calc можно условно разделить на несколько блоков. Каждый блок можно скрыть, настроить его цвет и другие свойства. Блок информации о символе: В этом блоке отображается информация о текущем спреде (SPREAD), стоимости пункта (POINT VALUE - в валюте депозита на 1 лот), своп для длинных (SWAP LONG) и коротких сделок (SWAP SHORT). Show s
FREE

Flag Pattern pro is a Price Action (PA) analytical tool that scans the continuation patterns known as "Flag and Pennant Patterns" .
Flag and Pennant patterns are continuation patterns characterized by a move in a previous trend direction after a shallow retracement usually below 50% of the original move . Deep retracements can however be sometimes found at the 61.8 % levels. The original move is know as the flag pole and the retracement is called the flag.
Indicator Fun

Baby ADX (BBADX ADXBB) Lo he diseñado con el propósito de operar automáticamente desde y para cuentas muy pequeñas (recomendable para cuentas de tan solo 100 USD ) y un apalancamiento de 1:30 aunque un apalancamiento mayor es preferible, con mayor capital no se obtiene un beneficio mayor proporcional, si no una reducción proporcionalmente menor. Con objetivo de alcanzar el punto de equilibrio a corto, medio plazo para retirar el capital y seguir operando tan solo con el beneficio obtenido en rie
FREE

Indicator developed in order to notify the user when the RSI enters and leaves the overbought and oversold regions, the information is shown in the form of audible and text alerts. Notifications can be disabled at any time. The indicator period can be changed by the user, and it is possible to insert the RSI indicator in the graph through the alerts. Aurélio Machado
FREE

This indicator can help you clearly identify trend changes in both bullish and bearish markets. The indicator compares the closing price of the last candle with the closing price of the candle "X" periods ago (input parameter). In an uptrend, an initial number '1' is plotted if a candle closes higher than the closing of a candle "X" periods ago. In a downtrend, an initial number '1' is plotted if a candle closes below the closing of a candle "X" periods ago. Subsequent numbers are plotted when e
FREE
MetaTrader Маркет - лучшее место для продажи торговых роботов и технических индикаторов.
Вам необходимо только написать востребованную программу для платформы MetaTrader, красиво оформить и добавить хорошее описание. Мы поможем вам опубликовать продукт в сервисе Маркет, где его могут купить миллионы пользователей MetaTrader. Так что занимайтесь только непосредственно своим делом - пишите программы для автотрейдинга.
Вы упускаете торговые возможности:
- Бесплатные приложения для трейдинга
- 8 000+ сигналов для копирования
- Экономические новости для анализа финансовых рынков
Регистрация
Вход
Если у вас нет учетной записи, зарегистрируйтесь
Для авторизации и пользования сайтом MQL5.com необходимо разрешить использование файлов Сookie.
Пожалуйста, включите в вашем браузере данную настройку, иначе вы не сможете авторизоваться.