YouTube'dan Mağaza ile ilgili eğitici videoları izleyin
Bir alım-satım robotu veya gösterge nasıl satın alınır?
Uzman Danışmanınızı
sanal sunucuda çalıştırın
sanal sunucuda çalıştırın
Satın almadan önce göstergeyi/alım-satım robotunu test edin
Mağazada kazanç sağlamak ister misiniz?
Satış için bir ürün nasıl sunulur?
MetaTrader 5 için Uzman Danışmanlar ve göstergeler - 39

Farklı brokerlerin ve farklı hesap türlerinde farklı yayılma değerlerine sahip olabileceği bir sır değildir (Teklif ve Fiyat Sorma arasındaki fark). Bu koşullar altında, aynı danışman tamamen farklı sonuçlarla ticaret yapacaktır. Sembolün yayılımı ne kadar büyükse, işlemde o kadar az kar elde edersiniz ve komisyoncu sizden o kadar çok kar alır. Bu nedenle, spread'in ölçülmesi, özellikle scalping, midnight ve ıntraday stratejileri için komisyoncu seçimi ve hesap türü için çok önemlidir.
Infin
FREE

Did you ever feel irritated by manually adjusting Fibonacci retracement levels? Do you ever want to have a tool that was automatically adjust to certain Fibonacci levels with your trading? Well here is a tool for you: Fast Fibonacci indicator and Grid trader allows you to quickly adjust Fibonacci retracement levels or construct Fibonacci extension grid! You can also quickly setup your grid trading based on these levels - only with few clicks. Adjustable graphics, font sizes and graphics panels m
FREE

Key Price Levels Indicator Indicator that shows the highs and lows for the significant price levels for past periods that could be potentially considered as reaction levels. The indicator displays the following price levels: Yesterday high and low The day before yesterday high and low Two days back high and low Last week high and low Last month high and low Last three month high and low (Quarter) Last year high and low
FREE

CMTX EA , sinyalleri oluşturmak ve işlemleri yönetmek için Hareketli Ortalamaları (MA) kullanan çok yönlü bir ticaret aracıdır. Bu uzman danışman, iki MA kesiştiğinde pozisyon açarak ve bu pozisyonları stratejik olarak yöneterek hem trend hem de yatay piyasalara uygun sonuçlar elde eder. Ana Özellikler: Ticaret Yönü Seçenekleri : EA'yı tek yönde veya aynı anda hem alım hem de satım yapacak şekilde yapılandırabilirsiniz. Lot ve Risk Yönetimi : Sabit veya dinamik lot büyüklüğü arasında seçim yapın

TRON is the result of several months of development. Featuring an advanced algorithm and a combination of custom indicators, this EA is a blend of profitability, security and simplicity. With its intelligent real-time technology and proven trading strategy for several years now, it offers reliable long-term trading and knows how to adapt to the situations it encounters over time. *** Compatible with Prop Firm *** (see backtest) Please check your Prop Firm's terms and rules for consistency and

Inputs Available
Lotsizes
Partial Close %
You can change lotsizes as you require
On an open chart click once to select chart to be able to use hotkeys on specific chart.
All Pairs can be used with this expert
We created this expert to be able to still trade C300 with a 0.06 Lotsize
If you enter a 0.6 lot and close 0.90% you can trade with 0.06 Lot
Keys to be used:
B -Buy S -Sell C -Close Profitable D -Breakeven (Note if stoploss is set it won't break even) P -Partial close X -Close all
Forex Hesaplayıcı her tüccar için olmazsa olmaz bir programdır. Bu komut dosyası, pip cinsinden ayarlanmış Zarar Durdur'a bağlı olarak bir mevduatın yüzde riskini yüzde olarak hesaplamanıza olanak tanır. Komut dosyasının avantajları: Her ticarette neyi riske attığınızı her zaman tam olarak bilirsiniz Hesaplayıcı, sözleşme özelliklerini dikkate alır Pip cinsinden veri girişi riski ve Stop Loss boyutu için sadece 2 sütun Önerilen Robot Scalper - https://www.mql5.com/en/market/product/
FREE

MetaTrader에서의 자동 트레이딩: 초보자를 위한 투자 로봇과 간단한 전략 자동 트레이딩은 고급 지식 없이도 편리하게 거래할 수 있는 방법을 제공하기 때문에 금융 시장에서 점점 더 많은 공간을 차지하고 있습니다. 기술의 발전과 투자 로봇 의 대중화로 인해 모든 수준의 투자자들이 MetaTrader 와 같은 플랫폼을 통해 자동 트레이딩 의 혜택을 누릴 수 있습니다. 이 글에서는 전문가 어드바이저(expert advisor) 의 작동 방식, 백테스트(backtests) 의 중요성, 그리고 자동 트레이딩을 시작하려는 사람들에게 훌륭한 출발점이 될 수 있는 간단한 트레이딩 전략 에 대해 알아보겠습니다. 소개 트레이딩 세계는 거래를 자동으로 실행하는 로봇의 도입으로 크게 발전했습니다. 이러한 프로그램은 전문가 어드바이저(expert advisor) 로 알려져 있으며, 미리 정의된 매개변수를 기반으로 시장에서의 진입 및 퇴출 기회를 식별하도록 개발되었습니다. 이러한 자동화된 접근 방식은

Do you want to see the most relevant supports and resistances at a glance? Tired of tracing the levels by hand? Multi Levels Detector is an indicator for MetaTrader that will draw supports and resistances according to the parameters entered, and also offers the possibility of executing an alert every time the price reaches any of its levels.
SETTINGS UsePercentage: Allows you to configure whether the distances between levels will be measured in points, or by a percentage of the asset.
TimeFram
FREE

The Forex Breakout Scalping EA follows a scalping breakout strategy. It trades the breakouts from relative highs and lows. For the entry stop orders are used for the fastest possible execution. Profits can be secured by the adjustable trailing stop .This is also a high frequency breakout trading system. It produces high return if compounded properly with high speen internet and low commission. Since the strategy works with small average profits it is highly suggested to trade with a low spread a
FREE

Default Settings Optimized for USDJPY F or accurate results, choose real tick data when backtesting. To use the EA for other currency pairs or backtest on different pairs, contact the developer or download the appropriate set files .
Amber Waves Scalper Candle Pattern EA is an automated trading system designed for the MetaTrader 5 platform that combines advanced trading features with the power to evoke a range of emotions in traders. This robot is optimized for current market conditions and ha

After years of observation on Grid strategy, I found lots of function that easy blown the account away. Such as, Market Execution(Instant open BUY/SELL), no OFF/ON for initial and sequence trade, no Loss Accepted function, etc So Perfect Grid EA was develop to the next level for all trader to be more useful than the old era of Grid Trading.
(The back test based on previous event from 01-01-2022 to 31-12-2022 only)
Please note that, !!EVERY INVESTMENT ALWAYS HAVE RISK!! !!USE WISELY WITH YOUR O

Bu ücretsiz bir işlem botudur! Tick-Bot, karı maksimize etmek için kullanıcıdan girdi alır.
Tek yapmanız gereken, aşağıdakiler arasında mükemmel bir kombinasyon bulmaktır (geriye dönük testlerde deneme yanılma yoluyla):
1. Spread - Mevcut Piyasa Fiyatı ile Alım/Satım Limit Emirleri arasındaki mesafe.
2. Kar Al - Açık pozisyonlarınız için TP. (TP gerekmiyorsa 0 girin)
3. Stop Loss - Açık pozisyonlarınızın SL'si. (SL gerekmiyorsa 0 girin)
4. Bekleme Süresi - Algoritmanızın iptal edip yeni li
FREE

40% OFF for 2 DAYS
Join the Out of the Box Telegram Group
search for "Out of the Box" on Telegram or contact me
Source code also available for sale (serious offers only).
Please note:
This EA (Expert Advisor) trades continuously. It’s normal for backtesting to show occasional issues; if it didn’t, the EA would be worth far more. You’ll need to monitor it closely. To help manage this, I use an input called “stop opening in general” set to -500. This lets me pause trading if drawdown (DD) i

TradeCopier allows you to locally copy transactions between different MetaTrader 5 accounts on the same computer or vps with very little input from the user. Find out more: Her e Features One Chart Setup you only need one chart to trade all available symbols Multiple currency pairs support Very easy to use - minimal input from the user is required Has a very high refresh rate - it can refresh every 1 millisecond and in doing so reduce the lag between the transmitter account and receiver accoun
FREE
The FVG scanner scans the Daily timeframe, the 4-Hour Timeframe and the 1-Hour Timeframe for FVGs and iFVGs in real time and on the strategy Tester. FVG stands for Fair value Gaps, This are said to be areas of market ineffieciency where price would have to return to in the near future Different colors are available for different FVGs. It highlights both the FVG and iFVG
FREE
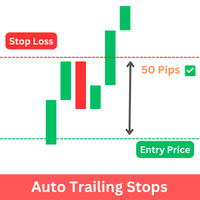
The Expert Advisor (EA) developed is specifically designed for scalping trading strategies . It's functions as a trailing stop manager for any positions opened by the user. The EA continuously monitors open positions and dynamically adjusts the stop-loss level as the price moves in favor of the trade. This trailing stop mechanism helps traders by managing ongoing trades that have taken by the trader by automatically tightening the stop-loss level as the trade progresses, thereby reducing poten
FREE

Overview
The Volume SuperTrend AI is an advanced technical indicator used to predict trends in price movements by utilizing a combination of traditional SuperTrend calculation and AI techniques, particularly the k-nearest neighbors (KNN) algorithm.
The Volume SuperTrend AI is designed to provide traders with insights into potential market trends, using both volume-weighted moving averages (VWMA) and the k-nearest neighbors (KNN) algorithm. By combining these approaches, the indicator

MaRSI Scalper & Trader The combination of moving averages and RSI This setting is flexible so it can be set with regards to user test uses 1. For scalping 2. For long time trading
features 1. Sends push notifications 2. Sends alerts on computers 3. Draws Arrows 4. Draws respective indicators (this feature will be edited in the future)
Have feedback https://t.me/Tz_Trade_Logics or just call +255766988200 (telegram/whatsApp) Head to discussion page to leave your comments Improvement are on the
FREE

"Spotting emerging trends, defining correction periods, and anticipating reversals can benefit your trading in many ways..." So be it: Higher Highs & Lower Lows indicator. This is an indicator created by Vitali Apirine and presented to the public through the article "Time To Buy. Time to Sell - It's a Stochastic, Higher Highs & Lower Lows" in the Stocks & Commodities magazine . This is a Momentum indicator that helps determine the direction of a trend. Higher Highs and Lower Lows are two indicat
FREE

Swing Detector — When You Think You Know Swings, Think Again
One of the key reasons many traders fail is their inattention to seemingly simple details they believe they’ve mastered. One such critical detail is the accurate identification of market swings (Swing Highs / Lows) on the chart. If you ask a group of traders to manually and consistently mark swing points on a chart, you'll find that more than half struggle to do it correctly . Not due to lack of knowledge, but because of mental fatigu
FREE

FVG Breakout Indicator The FVG Breakout Indicator is an advanced tool designed for traders who want to track key price levels and detect breakout zones while identifying Fair Value Gaps (FVG) on their charts. This indicator automatically plots the previous day’s high and low (PDH/PDL), tracks support and resistance levels, and signals breakouts. Additionally, it highlights bullish and bearish Fair Value Gaps, helping traders capitalize on premium and discount zones in the market. Key Features: P
FREE

AC Pivot Panel – Your Ultimate Pivot Trading Tool The AC Pivot Panel is a powerful yet user-friendly pivot point indicator designed to help traders identify key support and resistance levels with ease. Whether you’re a beginner or an experienced trader, this indicator simplifies pivot trading and enhances your decision-making process. Key Features : Interactive Selection Panel : Easily adjust pivot settings directly on the chart with a compact and intuitive panel. Multiple Pivot Methods : C
FREE
Higher Timeframe Levels — MT5 Indicator
This indicator displays key price levels from a higher timeframe directly on the current chart. It helps traders maintain a broader market context while trading lower timeframes. Description The indicator automatically synchronizes with the selected higher timeframe and plots key levels for each completed bar: Two dynamic lines: one for the open and one for the close of each bar. Green color is used for bullish bars (close > open). Red color is used for b
FREE
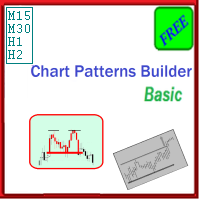
The Chart Patterns Builder Basic expert advisor is a new addition to the automated trading strategies product family, which already contains the Price Action Builder Basic and the Bollinger Bands Builder Basic . While sharing general functionality with the other experts, this expert relies on the detection of some well-known trading chart patterns for identifying its buy/sell signals.
Technical details:
The following chart patterns are currently supported:
- double top and double bottom patter
FREE
A Renko Tick chart based on continuously adjusting percentage.
Live Renko bricks formed by tick data
Adjustable brick width expert for indicator attached Scalp with a Renko, get weird.
The settings can and will break the script if you turn them up too high. Turning off outline mode will not look as nice, but can potentially allow for a larger number of bricks.
FREE

ПОСМОТРИТЕ НАШ НОВЫЙ СОВЕТНИК : : https://www.mql5.com/ru/market/product/95095?source=Unknown#description
Индикатор показывает время до закрытия свечи, а также время сервера на текущем графике. Очень прост в использовании, всего четыре настройки:
Lable Location- расположение таймера на графике; Display server time- показывать время сервера или нет; Sound alert when the candle is closed- использовать звуковой сигнал при закрытии свечи или нет; Colour -цвет цифр таймера. Другие полезные беспла
FREE
This is the automatic realization of multi single and open position EA, welcome to use. It has passed many historical data tests before it was put on the shelves. The following is EA's principle of multiple orders and closing positions: 1. Through the golden fork generated by the two moving averages, multiple orders can be automatically bought. The cycles of the two moving averages can be set by themselves. The default value of the small cycle moving average is 5, and the default value of the l
FREE

The Stochastic Momentum Index (SMI), developed by William Blau and featured in the January 1993 edition of Technical Analysis of Stocks & Commodities magazine, introduces a unique perspective to trading analysis. Distinguished from the conventional Stochastic Oscillator, which evaluates the current close in relation to the recent x-period high/low range, the SMI assesses the close's position relative to the midpoint of this range. This innovation yields an oscillator with a range of +/- 100, re
FREE
The Kalires Channel Indicator is a technical indicator used to evaluate trend direction and potential trading opportunities. This is a hybrid indicator that combines Kauffman Adaptive Moving Average (KAMA), linear regression and smoothing. The Kalires Channel Indicator consists of two lines: one central and two outer bands. The central line is a smoothed KAMA modified according to the direction of the trend. The outer bars represent two linear regression lines drawn above and below the center l
FREE
Attention - the indicator was initially developed for trading futures and the nuances of the Sunday session. This modification does not take into account the Sunday premarket, but is strictly tied to the time on the chart for correct operation on the spot market. Standard ATR indicator, you can enable ignoring abnormally large candles. It is possible to change the location of the displayed text in 4 corners of the chart. You can change the calculation period (days ago). Bonus - the indicator ha
FREE

The Fair Value Gap Detector is a MetaTrader 5 indicator designed to identify and draw rectangles on the chart wherever fair value gaps (FVGs) are detected. Fair value gaps occur when there is a significant disparity between the current price and the fair value of an asset. These gaps can provide valuable insights into potential trading opportunities, as they often indicate overbought or oversold conditions in the market. Key Features: FVG Detection: The indicator utilizes a proprietary algorith
FREE
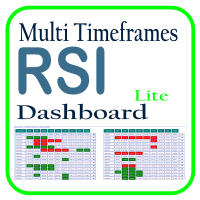
Optimize your trading analysis with the RSI Multitimeframe Dashboard, a powerful tool designed to streamline RSI monitoring across all timeframes and symbols listed in your Market Watch. This dashboard delivers real-time insights and alerts, making it essential for traders who rely on RSI to identify potential market entries and exits. Key features include: Comprehensive RSI Overview : Instantly view RSI values for every timeframe across all Market Watch symbols, making multi-timeframe analysis
FREE
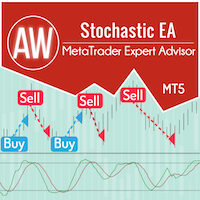
Otomatik gelişmiş ticaret sistemi. EA, klasik Stokastik göstergenin sinyalleri üzerinde işlem yapar. Pozisyonlardan çıkmak için akıllı bir takip sistemi kullanır ve bekleyen emirleri kullanarak ortalama alır. Avantajlar: Tam otomatik ticaret sistemi Robot çalışması için özelleştirilebilir osilatör sinyalleri Giriş değişkenlerinin sezgisel olarak kolay ayarlanması Her tür enstrüman ve her zaman dilimi için uygundur Dahili ayarlanabilir takip sistemi Not! Gösterge çizgileri EA'da görüntülenmiyor P

The principle of this indicator is very simple: detecting the trend with Moving Average, then monitoring the return point of graph by using the crossing of Stochastic Oscillator and finally predicting BUY and SELL signal with arrows, alerts and notifications. The parameters are fixed and automatically calculated on each time frame. Example: If you install indicator on EURUSD, timeframe M5: the indicator will detect the main trend with the Moving Average on this timeframe (for example the Moving

The principle of this indicator is very simple: detecting the trend with Moving Average, then monitoring the return point of graph by using the crossing of Stochastic Oscillator and finally predicting BUY and SELL signal with arrows, alerts and notifications. The parameters are fixed and automatically calculated on each time frame. Example: If you install indicator on EURUSD, timeframe M5: the indicator will detect the main trend with the Moving Average on this timeframe (for example the Moving
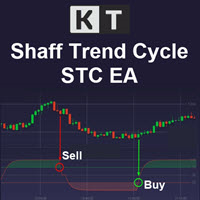
KT Schaff Trend Cycle Robot, STC göstergesiyle belirlenen aşırı alım/aşırı satım döngüleri ile hızlı ve yavaş üstel hareketli ortalamaların (EMA) birleşimini kullanarak oldukça etkili bir işlem stratejisi uygular. Tanımlanmış giriş kuralları sağlandığında, son 10 mumun analizine dayanarak yüksek veya düşük noktalara bekleyen emirler verir. Ayar dosyalarını indir.
Alış Girişi:
STC göstergesi aşırı satım bölgesinden çıkarak yukarı yönlü bir dönüşü işaret eder. Hızlı EMA, yavaş EMA'nın üzerindedi
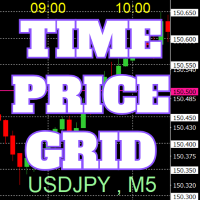
Grafikte, referansı kolaylaştırmak için tam sayılar üzerinde fiyat ve zaman çizelgeleri çizilir.
"Parametre Girişi" ile her periyot için fiyat aralıklarını ayarlamak mümkündür. Önemli sayılar için (yuvarlak sayılar) çizgiler diğer çizgilerden daha kalın ve daha belirgin olduğundan, bunları kolayca ayırt etmek mümkündür. Önemli sayılar için (yuvarlak sayılar) çizgiler diğer çizgilerden farklı bir renge ayarlanabilir. Çeşitli noktalardaki renkler bireysel olarak yapılandırılabilir. Simgeler ve zam
FREE
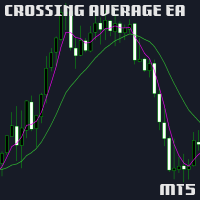
This is the classic strategy of moving average crossover. There is plenty useful configurations like trailing stops, trend detection, position protection and much more. If you want a user manual I can send you one, just DM me and I will provide. This is a free EA that works in any market and any timeframe is very simple but can be very profitable with the right configuration and market!
FREE

This Expert Advisor (EA) is a fully autonomous trading solution designed for major market reversals with integrated self-learning algorithms. Using neural network analysis of historical trades and recent price action over the past month, the EA continuously adapts to changing market conditions, optimizing its approach in real-time. User Configuration: To enhance ease of use, input parameters are minimized and structured as follows: Symbols: Comma-separated list of symbols the EA should operate

The Color Candles Indicator uses custom colors to highlight candles that follow the main market trend, based on the Moving Average. This simplifies the analysis of price movements, making it clearer and more direct. When the price is above the rising Moving Average, candles are highlighted indicating a BUY opportunity. When the price is below the declining Moving Average, candles are highlighted indicating a SELL opportunity.
Input Parameters : Period Method Applied Price
The moving averages
FREE

Demand and supply zones Support and Resistance areas Show broken zones Show tested and untested zones Show weak zones Fractal factors Notifications when price reaches point of Interest with Push notifications and pop ups Customizable History Clickable Works on all Timeframes Works on all pairs.
Free for a while till further notice and changes. The demand and supply bot coming soon
FREE

Trade Copier Pro MT5 is a tool to copy trade remotely to multiple MT4, MT5 and cTradfer accounts at different computers/locations over internet. This is an ideal solution for you if you are a signal provider and want to copy your trades to other receivers globally on your own rules. One provider can copy trades to multiple receivers and one receiver can get trade from multiple providers as well. The provider can even set the subscription expiry for each receiver, so that receiver will not be abl

Extremum Scalper is a fully automated Expert Advisor, that uses a dynamic MM, probabilistic analysis and also strategy of breakout/rebound from the levels of daily and local extremes, and the candlestick Highs. The price Highs and the tick volume serve as the analyzed parameters. Works in different markets with all trade execution modes. Does not use martingale or hidden methods of increasing the position volume. The EA has 9 different extremum calculation algorithms. Uses a drawdown protection,
FREE

News Scalper EA is an Expert Advisor for trading EURUSD - GBPUSD - XAUUSD pairs, positioning your positions during the news. Developed by an experienced trader with over 17 years of trading experience. News Scalper EA uses a news calendar from MQL5 and trades according to them. With sophisticated strategy and risk management, the EA protects your positions from larger losses! News Scalper EA lets you close the SL after the set time (1 minute, planned) when the position is in minus, which proves
FREE

This indicator displays MTF (Multi-Time Frame) Candles on your Chart. It helps to see the overall Trend of Market. You can specify 2ndLast, Last or Current Candle of any timeframe to show to get a better picture of Trend.. You get 4TF Bars/Candles on your current chart ..
Customizable Settings are : 1. Where to place MTF Candles.. 2. Show or Hide for each Candle 2. Time-Frame for each Candle 3. Current/ Last / 2nd Last of Each Candle
FREE

Ultron Candle Timer
Used for any timeframe to keep track of time remaining on current candle. User can change inputs and colors. Never wonder again about the time remaining until the next candle. Will work on any market and any chart. Adjust the color to blend in with any of your current chart template. Its a very simple and easy to use indicator but it comes in handy
FREE

The Zero Lag Least Squares Moving Average (ZLSMA) is an advanced moving average indicator designed to provide fast and smooth trend analysis while eliminating lag. It is based on the Least Squares Moving Average (LSMA) but incorporates a zero-lag calculation, making it highly responsive to price changes. This indicator helps traders identify trend direction with minimal delay, making it ideal for both short-term and long-term trading strategies.
Key Features: • Zero-Lag Calculation – Red
FREE

Overview: Ravenok Gold MT5 is a highly effective trading robot specifically designed for nighttime trading in financial markets. It utilizes sophisticated algorithms to analyze market data and make decisions based on thoroughly tested strategies. The robot primarily operates during the night when market volatility may be lower, allowing it to generate profits with minimal risk. Key Features: Low Drawdown:
NightProfit Trader employs a unique risk management system that helps maintain a low dra
FREE

El indicador técnico Trend Magic es una herramienta de análisis de tendencias que combina el Índice de Canal de Mercancía (CCI) y el Rango Verdadero Medio (ATR) para identificar la dirección de la tendencia del mercado. Aquí tienes un resumen de sus pros y contras, así como las mejores condiciones del mercado para su uso:
Pros: - Identificación clara de la tendencia: Cambia de color para indicar tendencias alcistas (azul) y bajistas (rojo), lo que facilita la visualización de la dirección del
FREE

Bu çoklu zaman çerçevesi ve çoklu sembol göstergesi, ikili üst/alt, baş ve omuz, flama/üçgen ve bayrak desenlerini tanımlar. Uyarıları yalnızca bir boyun çizgisi/üçgen/bayrak direği kopması meydana geldiğinde ayarlamak da mümkündür (boyun çizgisi kırılması = üst/alt ve baş ve omuzlar için onaylanmış sinyal). Gösterge, tekli grafik modunda da kullanılabilir. Lütfen bu seçenek hakkında daha fazla bilgiyi ürünün blog Kendi kurallarınız ve tekniklerinizle birlikte bu gösterge, kendi gü

Bu güçlü araç, trend çizgilerini otomatik olarak tanımlar, ticaret stratejinizi kolaylaştırmanıza ve daha bilinçli kararlar vermenize yardımcı olur. mt4 sürümü
Temel özellikler Otomatik Trend Hattı Algılama : "Temel Trendline" göstergesi, potansiyel trend çizgileri için pazarı tarar ve bunları anında gösteriyor.Bu size değerli zaman kazandırır ve asla önemli bir eğilimi kaçırmanızı sağlar. Kullanıcı dostu panel : Göstergemiz, çeşitli trend çizgileri kolayca çizmenizi sağlayan güzel, sezgisel
The indicator is a line right at yesterday's closing price. With the indicator, there is no need for adding or deleting previous day close lines each new day. T he line gives you an instant visual reference point for support, resistance, and market sentiment. Whether you are day trading or swing trading, this line helps you quickly gauge where the market closed last session and how current price action relates to that level. It works seamlessly across all timeframes - from 1-minute charts to d
FREE

ET1 for MT5 is new and completely free!! ET1 for MT5 v4.20 Updated!! Now use on XAUUSD(Gold) !! The success rate is more than 75% !!!
important update: Merge ET9 's breakout strategy
Warning!! You can use ET1 completely free, but we do not guarantee ET1 stability, It is recommended that the more powerful ET9 for MT5 version includes the ET1 strategy and guarantees complete and stable returns.
The Best Expert Advisor on XAUUSD any timeframes ET9 for MT5 Updated v4.70 !! https://www
FREE

Introduction To Time Box Indicator Time Box Indicator is a must have indicator for any trader. It will display daily, weekly and Monthly box according to your preferences. Yet, you can extend any important price levels in your chart automatically. You can use them as the significant support and resistance levels. It is very simple but effective tool for your trading.
Graphic Setting Use White Chart Line Style for Current Open price
Daily Setting Update Timeframe for daily box Number of days to
FREE
MT4 Version
Advanced Range Breakout
Advanced Range Breakout allows you to trade breakouts in an impossible way for any human being. This EA focuses on entering breakouts as soon as the price moves over them, keeping a tight trailing stop loss (TSL) to catch as much as possible of breakouts' characteristic explosive price movements while protecting the trade if it turns out to be a fakeout. Feel free to get in touch we me to find out how I successfully managed to passed a prop firm challenge
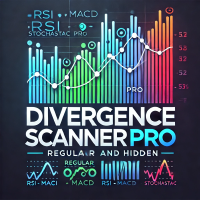
Divergence Scanner Pro is an advanced utility designed to detect both regular and hidden divergences across three powerful indicators: RSI , MACD , and Stochastic . With its robust algorithm and user-friendly interface, this tool is perfect for traders seeking an edge in the market. Key Features: Comprehensive Divergence Detection : Identifies regular and hidden divergences to highlight potential trend reversals or continuation opportunities. Multi-Indicator Support : Scans for divergences on RS
FREE
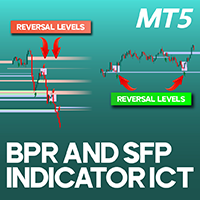
BPR + SFP Indicator in ICT MT5 The BPR + SFP Oscillation Breakout Indicator merges BPR and SFP patterns within technical analysis to detect market trends and highlight optimal trade entry points. This synergy relies on market dynamics and trader responses to significant price zones such as support and resistance levels, liquidity accumulation areas, breakout and pullback zones, and market highs and lows . This indicator assesses oscillation breakouts, verifies breakout and pullback movements at
FREE

The indicator is intended for determining the spread and swap size, the distance for setting stop orders and stop losses from the current price allowed and the risk per 1 point in the deposit currency. The indicator informs a trader about possible additional expenses and profits connected with transferring a position to the next trade session of the financial instrument. It also informs about the spread size and the distance of pending orders, stop loss and trailing from the current price. In ad
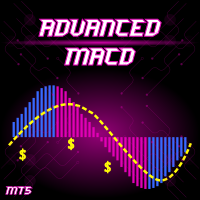
Advanced MACD is a safe and fully automated EA. This EA uses MACD indicator with double confirmation set and filtering by range of latest price movements. Every order has stop-loss and the EA has implemented advanced filtering functions together with spread and slippage protections. This EA does NOT use the dangerous strategies like Martingale, etc. Advanced MACD is NOT a tick scalper that produces high number of trades per day and it is NOT dependent on every point of price. This EA is

MultiVision Dashboard – Monitor Multiple Markets at a Glance.
The MultiVision Dashboard is an advanced, user-friendly MQL5 indicator that allows traders to monitor multiple symbols and timeframes simultaneously in a single, intuitive dashboard. It's designed to simplify market analysis by presenting essential data clearly, helping traders quickly identify opportunities and make better trading decisions.
Key Features
Flexible Symbol & Timeframe Selection
Customize the dashboard with your prefe
FREE
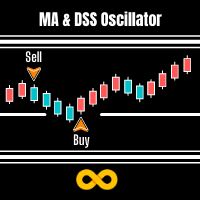
MA & DSS Oscillator is a simple system that overcomes all the market confusion by looking at the Moving Average and Double Smoothed Stochastic Oscillator. A Signal is made when the Oscillator is under 50 (A default value) and heading in same direction as the Moving Average.
The moving average is arguably the simplest but most effective tool when trading larger timeframes. We use this and the Double Smoothed Stochastic Oscillator to time our market entry.
Double Smoothed Stochastic is similar
FREE

Free version of the TickScalper indicator. The Tick Scalp indicator is a trading assistant for a scalping trader. Works in a separate window. Tracks the momentary activity of the market, shows the graph of the movement of ticks and the strength of bulls or bears. Sometimes it can anticipate the beginning of a strong movement before any other indicators. Helps the trader to make a decision to open the desired order. Designed to work on any instrument. Used timeframes from M1 to M15. Has simple a
FREE

Trendy Stock is a price following indicator that uses Stochastic to show when the price is out of the oversold or overbought areas. The algorithm allows you to stay longer in a trend where the bulls or bears are in control. The indicator changes color immediately the price exits oversold/overbought state. In short, the downtrend [red] bars start to paint when the buying pressure decreases while the uptrend [green] bars form as the buy pressure kicks in. For MT4 version, follow :: https://www
FREE

The Pure Price Action ICT Tools indicator is designed for pure price action analysis, automatically identifying real-time market structures, liquidity levels, order & breaker blocks, and liquidity voids. Its unique feature lies in its exclusive reliance on price patterns, without being constrained by any user-defined inputs, ensuring a robust and objective analysis of market dynamics. Key Features Market Structures A Market Structure Shift, also known as a Change of Character (CHoCH), is a pivot

Easy Market makes the market easier to trade. It allows you to see an "eternally" side (no trend) market, making it extremely easy to see when the price is overbought or oversold. Both trend and consolidation traders will like Easy Market. You can use it as an auxiliary window (below chart) or in full screen mode. See the screenshots and note how it gives you accurate entries! If you have any doubt or suggestion, please, contact us! Ejoy!
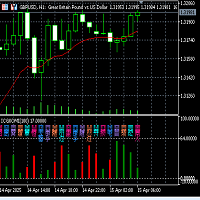
Fuxi Guaxiang Dual-color Oscillation Indicator Function and Usage Instructions (V2.1)
Fuxi Guaxiang Dual-color Oscillation Indicator Instructions: (1) This Guaxiang change indicator is based on the Yin-Yang transformation thought of the "Book of Changes" philosophy in ancient Chinese culture, integrating the results of the long-short game in each candlestick K-line period of the financial trading K-line chart, using China's oldest predictive coding method, in the form of the 64 Guaxiang of the
FREE

Здравствуйте. После долгого пути разработки остановился на виртуальном сеточнике. У робота всего два режима автоматический и ручной. Автоматическая торговля, а также для тестера: M15, Н1 настройка Virtual_Grid_default рекомендуется true. Автомат без замечаний работает на форексе золоте и ByBit эфириум. На других инструментах, пока недостаточно статистики Ручная торговля на всех таймфреймах меньше часовика Обязательно посмотрите видео по последнему обновлению. Вся информация по работе советника

Bu araç iki ana avantaj sunar: MT5 ekonomik göstergelerinin kullanım kolaylığını artırır ve MT4 ile verilerin sorunsuz paylaşılmasını sağlar. Örneğin, 10 yıldan daha eski ekonomik gösterge verilerini etkili bir şekilde eğitim ve geri testlerde kullanmanıza olanak tanır. Ayrıca, MT4'ün PracticeSimulator aracıyla uyumludur, bu da geçmiş verilerle yapılan alıştırmalardan MT4 üzerindeki canlı işlemlere kadar her şey için değerli bir araç haline getirir. MT4 ile ekonomik göstergeleri sorunsuz bir şek
FREE
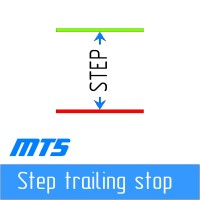
Adım adım "Trailing Stop"
Yardımcı program, "Trailing Stop" aracını kullanırken fiyatı takip eden "Zararı Durdur" hareket adımını ayarlamanıza olanak tanır. "MetaTrader" terminalinde bulunan ve "Kaybı Durdur" hareketini 1 pip'lik artışlarla ayarlamanıza izin veren "normal" "İzleyen Durdurma"nın aksine, bu "İzleyen Durdurma" herhangi bir artışla yapılandırılır. Bu ayar, fiyat bir yönde uzun bir hareketten sonra küçük bir düzeltme için tersine döndüğünde ve ardından tekrar aynı yönde hareket etme
FREE
MetaTrader platformunun uygulama mağazası olan MetaTrader mağazasından bir alım-satım robotunun nasıl satın alınacağını öğrenin.
MQL5.community ödeme sistemi, PayPal, banka kartları ve popüler ödeme sistemleri aracılığıyla yapılan işlemleri destekler. Daha iyi bir müşteri deneyimi için satın almadan önce alım-satım robotunu test etmenizi şiddetle tavsiye ederiz.
Alım-satım fırsatlarını kaçırıyorsunuz:
- Ücretsiz alım-satım uygulamaları
- İşlem kopyalama için 8.000'den fazla sinyal
- Finansal piyasaları keşfetmek için ekonomik haberler
Kayıt
Giriş yap
Gizlilik ve Veri Koruma Politikasını ve MQL5.com Kullanım Şartlarını kabul edersiniz
Hesabınız yoksa, lütfen kaydolun
MQL5.com web sitesine giriş yapmak için çerezlerin kullanımına izin vermelisiniz.
Lütfen tarayıcınızda gerekli ayarı etkinleştirin, aksi takdirde giriş yapamazsınız.