Смотри обучающее видео по маркету на YouTube
Как купить торгового робота или индикатор
Запусти робота на
виртуальном хостинге
виртуальном хостинге
Протестируй индикатор/робота перед покупкой
Хочешь зарабатывать в Маркете?
Как подать продукт, чтобы его покупали
Торговые роботы и индикаторы для MetaTrader 5 - 36

Volume Horizon - это индикатор горизонтальных объёмов, предоставляющий возможность наблюдать за плотностью объёмов участников рынка в различных ценовых и временных интервалах. Гистограммы объёмов могут быть построены на основе восходящих или нисходящих волн рынка, а также по отдельным барам. Этот инструмент позволяет более точно определять моменты для открытия или закрытия позиций, опираясь на уровни максимальных объёмов или средневзвешенные цены по объёму.
Что делает Volume Horizon уникальны

Golden Buzzer is a two-in-one MT5 Gold-based (XAUUSD) expert advisor that executes trades using two strategies. These strategies, simply named Strategy 1 and Strategy 2 , although built on the same principles, operate slightly differently from one another. For this reason, there is a setting to choose whether to use either one or both as the engine of the expert advisor. ONLY 8 out of 10 copies left going at 100$ . NEXT PRICE : 170$ SETUP The general settings or setup for this robot is intuiti

Definition : VPO is a Volume Price Opportunity. Instead of using bars or candles with an Open, High, Low, and Close price, each "bar" in a Market Profile is represented by horizontal bars against the price It is called Market Profile terminology.
In other words volume-price-opportunity (VPO) profiles are histograms of how many volumes were traded at each price within the span of the profile.
By using a VPO chart, you are able to analyze the amount of trading activity, based on volume, for eac

Эксперт торгует при открытии рынка после выходных, ориентируясь на возникший разрыв цены (ГЭП). Уже разработанные сеты лежат в комментариях. При этом доступны разнообразные параметры в настройках эксперта, позволяющие создать свои уникальные сеты самостоятельно. С качать настройки (сеты): https://www.mql5.com/en/blogs/post/747929 Валютные пары для которых разработаны сеты: GBPUSD, AUDUSD, NZDUSD, USDCAD, EURGBP, EURCHF, GBPCAD, GBPAUD, AUDCHF, AUDJPY, AUDNZD, CHFJPY, CADJPY, NZDJPY, NZDCHF,

User Grid MT5 – многофункциональный сеточный советник, разработанный для полной или частичной автоматизации различных идей, связанных с сеточной торговлей (на счету типа хеджинг). Советник может торговать на любом таймфрейме, на любой валютной паре, на нескольких валютных парах, на любом количестве знаков. Не мешает ни ручной торговле, ни торговле других советников, ни работе каких-либо индикаторов.
Позволяет корректировать свои настройки на лету, работает только со своими позициями и орд

Ace Supply Demand Zone Indicator The concept of supply demand relies on the quantity mismatching between buying and selling volumes in the financial market. Supply and demand zone can provide the good entry and exit. A zone is easier to trade than a line. The supply demand zone can provide the detailed trading plan and the risk management. Its ability to predict market direction is high. There are two distinctive points about Ace Supply Demand Zone Indicator. Ace Supply Demand Zone indicator was

This EA trades using the CCI Indicator. It offers many trading scenarios and flexible position management settings, plus many useful features like customizable trading sessions, a martingale and inverse martingale mode. [ Installation Guide | Update Guide | Troubleshooting | FAQ | All Products ] Easy to use and supervise It implements three different entry strategies Customizable break-even, SL, TP and trailing-stop Works for ECN/Non-ECN brokers Works for 2-3-4-5 digit symbols Trading can be NF
FREE

Esse indicador é a combinação do RSI (IFR) com Média Móvel Simples aplicada o RSI em um único indicador para facilitar a criação de alguma estratégia. Fiz esse indicador para que um único indicador contenha os buffer necessários para implementar alguma EA.
Descrição dos Buffers para o EA,
Buffer 0 -> Valor do RSI Buffer 1 -> Valor da média móvel aplicada ao RSI
FREE

Description : Rainbow MT5 is a technical indicator based on Moving Average with period 34 and very easy to use. When price crosses above MA and MA changes color to green, then this is a signal to buy. When price crosses below MA and MA changes color to red, then this is a signal to sell. The Expert advisor ( Rainbow EA MT5 ) based on Rainbow MT5 indicator is now available here .
MT4 version is available here .
FREE

Welcome to the Minions Labs' reinterpretation of the Classic Bulls & Bears Power , developed by Alexander Elder a long ago. Since the 2 indicators: Bull Power and Bear Power were histogram-based indicators and having 2 indicators in the same chart and occupy too much screen, we decided to mix them into ONE Line and Color-based indicator, which give us all the information we need. The Bull & Bear Power indicators help you determine the strength of BUYERS (Bulls) vs. SELLERS (Bears). Basically, it
FREE

Easy Market makes the market easier to trade. It allows you to see an "eternally" side (no trend) market, making it extremely easy to see when the price is overbought or oversold. Both trend and consolidation traders will like Easy Market. You can use it as an auxiliary window (below chart) or in full screen mode. See the screenshots and note how it gives you accurate entries! If you have any doubt or suggestion, please, contact us! Ejoy!

Simple Calendar Events is an indicator that will mark important Important Economy Events on your chart. For example, if you are trading something that is USD based, you would like to know when some important events are coming, you can expect some volatility or some different Price action, so you can base your strategy on it. If you trade something that is country based you can also choose that, and it will show you when the event is, so you can be prepared for it. When you hover with the mouse
FREE

Consolidation Finder Индикатор, позволяющий находить консолидации. Для работы на пробой канала. Прост в использовании, имеется всего три параметра настройки: Минимальное количество баров для анализа Туннель консолидации Цвет индикатора Работает на всех таймфреймах , по умолчанию установлены примерные настройки для таймфрейма H1. Работает на всех валютных парах. Индикатор не перерисовывается и не пересчитывается. Все скриншоты реальные!

Value Chart indicator presents the Price evolution in a new form. This indicator, Price Momentum , was developed taking all the calculations presented in the book " Dynamic Trading Indicators " by Mark W. Helweg and David Stendahl (2002). The technique involves de-trended Prices from a user-defined Period of analysis and the addition of a Volatility index correction. The result is an Oscillator with 3 zones: Fair Price Value, Overbought/Oversold and Extremely Overbought/Oversold zones. Adding th
FREE

Neuron Net DAX40 is an integration of the Python programming language, deep learning machine and mql5 code to be able to predict Germany 40 Index(DAX40) price movements so as to produce entries and exits based on artificial intelligence.
Why Neuron Net DAX40 ? + Neuron Net DAX40 has been through the research and development stage for almost 1 year, and has passed the testing phase on demo accounts and real accounts. + Neuron Net DAX40 d oes not use martingale
SET UP
Symbol :

With Fixed Range Volume Profile,The traces left by the big players will not go unnoticed by you.
Professional Volume Profile Indicator reveals Institutional order flow. This advanced market indicator will teach you to spot the buying and selling. Dont want to say more because its well known by most professionals trader. This Indicator : - Quickly Identify the Strongest Institutional S/R Zones. - W orks with all Trading Instruments (Forex, Futures, Indexes, Commodities, Stocks, Cryptocur

What Is Market Imbalance? Market Imbalance, also known as "IPA" or Improper Price Action, is when price moves so quick in one direction with no orders on the other side of the market to mitigate the price movement. We all know Big Banks, or "Smart Money", can move the market by placing huge orders which in turn can move price significantly. They can do this because Big Banks are the top 10 Forex traders in the world . But unfortunately, the Big Banks cannot leave these orders in drawdown and mu

Индикатор PivotPointSuperTrend отлично показывает данные Тренд на основе мат данных от Pivot и ATR и очень удобен для входа в сделку и выставления стопов. Если кто то сможет добавить в код мултитаймфрем, я и многие пользователи будут очень Благодарны, то есть чтобы ондикатор показывал значение старшего таймафрема на графике младшего таймфрема, Заранее Спасибо!
FREE

Утилита рисует pivot уровни на основании выбора из day week month Берется предыдущая свеча выбранного таймфрейма и расчитываются значения для уровней по следующим формулам: Pivot = (high + close + low)/ 3 R1 = ( 2 * Pivot) - low S1 = ( 2 * Pivot) - high R2 = Pivot + (R1 -S1) R3 = high + ( 2 * (Pivot - low)) S2 = Pivot - (R1 - S1) S3 = low - ( 2 *(high - Pivot)); Настраиваются стиль и толщина для всех линий. Цвета для линий R, Pivot и S настраиваются по отдельности. При удалении утилиты с графика
FREE

Этот индикатор изучает ценовое действие как совокупность ценовых и временных векторов, и использует средний вектор для определения направления и силы рынка. Этот индикатор выделяет краткосрочную направленность и силу рынка, он может быть использован для получения выгоды от краткосрочных колебаний цен при помощи торговли по пробоям или бинарных опционов.
С легкостью находит направление рынка Подтверждается пробоями или другими индикаторами Красный осциллятор означает медвежье движение Синий осц
FREE

If you want to be successful in Trading you must be extremely disciplined. Without discipline you won't get far.
To help traders build and maintain discipline in the long run I have create the Risk Manager EA that comes with two huge benefits:
1. Equity and Balance protection
2. Risk and Money Management automatic tracking rules
How?
The EA has 6 customizable Conditions that, if triggered, will use at least one of 3 available Actions. All the tracking activity is displayed
in a sim

Camarilla Swing Trade Indicator is an Indicator. Support and resistance points are calculated from the High Low Close of the previous TF Week's price.
What are Camarilla Pivot Points?
1.Camarilla Pivot Points is a modified version of the classic Pivot Point. 2.Camarilla Pivot Points was launched in 1989 by Nick Scott, a successful bond trader. 3.The basic idea behind Camarilla Pivot Points is that price tends to revert to its mean until it doesn't. 4.Camarilla Pivot Points is a mathematical
FREE
Exponential Moving Average indicators are widely used by Forex traders all around.
This EA uses a simple Scalping Strategy using 4 exponential moving averages and have lots of config parameters. EMA1: 9 | EMA2: 13 | EMA3: 21 | EMA4: 200 Basically the EA Strategy place an order when it detects that the last candle touched the 3ª EMA line and the last 5 candles do not touch it.
In order to know more about the strategy, we presented it in our youtube channel: Video with EA Strategy Details:
FREE
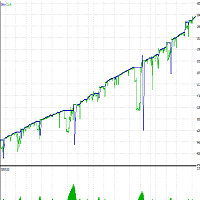
Please backtest with the exact balance of your live account before applying to real money. ==> If account balance is too low it may not trade at all! For MT4 version please contact via private message. Strategy description - Detect trend based on GoldTrader rules. - Enter in both direction as much as needed to achieve acceptable amount of profit. - Although this is a martingale bot it is very unlikely to loose your money, because: ==> the money management rules are safe and low risk. ==> entries
FREE

Easy Trend , as the name implies, is an indicator that easily shows the prevailing trend by bringing several indicators into one. The strategy is: when all indicators point in the same direction a signal is triggered. When red, is a signal to sell, when blue, signal to buy. It is that simple :) There are a total of 9 indicators: Moving Average, RSI, CCI, Parabolic SAR, William's Range, Stochastic, MACD, ADX and Heiken Ashi. It is possible to configure each of these indicators to suit your way of

TRADECOPY CLIENT MT5 Over the years I developed TradeCopy MT4/MT5 for that purposes: I'm running several experts on one and/or different terminals and accounts. The trades opened by those experts, usually will not move straight away into profit zone. Very often they use to pullback more or less before end up in profit (or in loss finally...). To improve the profits and avoid possible drawdowns of trades that have been opened by the accounts that are running the TradeCopy Master MT4/MT5 was

HighQualityMap是一个很好的中长线交易指示器,这个指标可以单独使用,尤其是用在M30或者大于M30的时间框架下,它能很好的体现出趋势的走向,以及转折点,你可以很快的从这个指示器上寻找到最佳的buy和sell位置,同时也能很好根据指示器去坚守自己的持仓定订单。指标不含有未来函数,不会重新绘制,不仅能够应用到自己的手动交易过程中,还能完全可以写入到自己的EA中。(如果你感觉到这个指标能够帮助你进行更准确的交易,请帮忙给个好评,希望我的作品能够帮助更多有需要的人) ===================参数列表===================== 所有参数均采用默认参数即可,无需更改,若为激进型交易者,可以根据自己的需要来调整参数。 =================参考使用方法=================== 此指标可以适用于任何交易品种,使用周期框架大于M30相对更准确。
One of the most helpful information a trader can look at is sentiment data. Not to follow the crowd, but to fade it. Retail sentiment is the best contrarian indicator for you trading. If 95% of people are always wrong and losing money in the markets, you don't want to be bullish when the majority of people are bearish, and you don't wanna be bearish when the majority of people are bullish. You want to be a contrarian.
It does NOT mean simply buy or sell according to sentiment numbers BUT conf

Советник для скальпирования фьючерса BR на ММВБ. Внутридневный, в 23=45 закроет позицию. Работает на 15-ти минутках. По появлению отфильтрованного индикаторами сигнала на покупку/продажу выставляет отложенный ордер. Более короткий вариант таймфрейма выбирать не рекомендую из-за введенных ограничений для переменных в примененных индикаторов. Мартингейл не применён, EA тестирован на ММВБ на срочном рынке и только на фьючерсах BR. Для демонстрации результатов на склейке, параметры дооптимизи
FREE

The Real Ticks Recording Indicator for MetaTrader 5 backtesting is a powerful tool designed to enable traders to simulate their trading strategies with utmost accuracy and realism. This indicator captures and stores real market ticks, allowing you to replay past market conditions with extreme fidelity, thereby enhancing the precision and reliability of strategy tests. Key Features: Real-Time Tick Capture: The indicator records each market price movement in real-time, ensuring an accurate represe

XAUUSD USDJPY GPBUSD M1 HEDGE Реальный мониторинг аккаунта **Analytico - Ваш Новый Союзник в Автоматизированной Торговле на MQL5!** Вы когда-нибудь представляли себе торгового ассистента, который не только выявляет лучшие возможности на рынке, но и адаптируется и защищает ваш капитал как никто другой? Это Analytico, Эксперт-Советник, который улучшит ваш опыт торговли!
**3 Столпа Успеха: Направление, Объем и Скорость** Analytico не оставляет ничего на волю случая. Он работает на ос
FREE

Get ALERTS for break of your TRENDLINES, SUPPORT LINES, RESISTANCE LINE, ANY LINE!!
1. Draw a line on the chart (Trend, support, resistance, whatever you like) and give it a name (e.g. MY EURUSD line) 2. Load the Indicator and input the Line Name the same name in Indicator INPUT so system knows the name of your line (= MY EURUSD line) 3. Get Alerts when Price breaks the line and closes Works on All Time frames and charts LEAVE A COMMENT AND IF THERE IS ENOUGH INTEREST I WILL WRITE AN EA WHICH
FREE

Scalp Strategy Builder for MT5 is a flexible MT-5 Expert Advisor that can be configured for different scalp trading systems. This EA is an open toolbox that allows transparent development, testing and automated execution of market-specific trading strategies. The advanced settings for Money Management, news handling and trading hours allow the configuration of trading rules for prop trading qualification. Benefits: Transparent strategy, no black box Time saving as trading strategies can be ver

TradeCopier allows you to locally copy transactions between different MetaTrader 5 accounts on the same computer or vps with very little input from the user. Features One Chart Setup you only need one chart to trade all available symbols Multiple currency pairs support Very easy to use - minimal input from the user is required Has a very high refresh rate - it can refresh every 1 millisecond and in doing so reduce the lag between the transmitter account and receiver account Inputs Mode :
FREE

Мультивалютный сеточный советник, в большинстве случаев получает довольно точные входы. Если вход оказывается недостаточно точным, позиции управляются с использованием тщательно продуманной стратегии мартингейла. Вход осуществляется по сигналам индикаторов RSI и Stochastic, в зонах перекупленности/перепроданности, плюс дополнительное условия входа по авторскому алгоритму. Рекомендуемый таймфрейм - М15 Входные параметры SetName - имя текущих настроек MagicNumber – маджик номер, идентификационный

The strategy is based on finding top and bottoms during the night flat range. The night flat range usually lasts during the Pacific and Asian trading session and is characterized by low volatility. Most night scalpers have one weakness, that is, small gains and few big losses which wipe all the small gains. This Scalper is using Neutral network to avoid days that can potentially have high volatility and result in big loses, Neutral network does this accurately . The Neutral network has currently
FREE

Maximum Minimum Candle indicator is a basic indicator (but useful) that shows the highest and lowest candle in a period of time .
The indicator shows the maximum candle and the minimum candle for a defined period of time. You can choose the number of candles that make up the period The indicator will show with color points the maximum and minimum values. A message tells you when the price reaches the maximum or minimum.
Parameters number_of_candles: It is the number of candles that will b
FREE

Highly configurable Williams %R indicator. Features: Highly customizable alert functions (at levels, crosses, direction changes via email, push, sound, popup) Multi timeframe ability Color customization (at levels, crosses, direction changes) Linear interpolation and histogram mode options Works on strategy tester in multi timeframe mode (at weekend without ticks also) Adjustable Levels Parameters:
Williams %R Timeframe: You can set the current or a higher timeframes for Williams %R. Williams
FREE

This is my version of the famous VWAP indicator.
Channel Group: Click Here
You get: - Default VWAP Line - First and second deviation zones - Previous day levels Very simple to use, one of the best tools for day trading. Can be used on any TF and on any symbol. Don't use for entries, use as a trend filter. Add supporting indicators
I would recommend to use the indicator on either 15M or 5M chart.
FREE

Mostra a média móvel quando ADX > 20 e pinta de verde ou vermelho quando os valores de ADX estão subindo indicando tendência. Quando o ADX é menor que 20 indica movimento lateral consolidado. O indicador não define pontos de entrada, somente mostra a média colorida quando a tendência está se fortalecendo. Faz parte do grupo de indicadores do Indicador Tavim.
FREE

VolumeFlow is a Volume Accumulation / Distribution tracking indicator. It works in a similar way to OBV, but it is much more refined and includes the options to use: Classical Approach = OBV; Useful Volume Approach; Gail Mercer's approach; Input Parameters: Input Parameters: Approach Type: Explained above; Volume Type: Real or Ticks; Recommendations: Remember: The TOPs or BOTTONS left by the indicator are good Trade Location points. This is because the players who were "stuck" in these regions w
FREE

Relative Volume or RVOL is an indicator that averages the volume of X amount of days, making it easy to compare sessions volumes.
The histogram only has 3 colors:
Green - Above average volume
Yellow - Average volume
Red - Below average volume
The default setting is 20 days, which corresponds more or less to a month of trading.
In this version is possible to choose between tick and real volumes (if you are using a broker which offers future contracts)
With the data obtaine
FREE

Tops & Bottoms Indicator FREE Tops abd Bottoms: An effective indicator for your trades
The tops and bottoms indicator helps you to find ascending and descending channel formations with indications of ascending and/or descending tops and bottoms. In addition, it show possibles opportunities with a small yellow circle when the indicator encounters an impulse formation.
This indicator provide to you more security and speed in making entry decisions. Also test our FREE advisor indicator:
FREE
The RFOC Candle Timer 2x was created for the trader to locate himself in time, having access to the pending time for the formation of a new candle. Additionally, it is possible to include in the chart a second timer that shows the pending time for the formation of a new candle in a time period different from the current one. The user will have the option to select up to 4 different positions for the timer display ("No candle", lower left corner, lower right corner or upper right corner). In ad
FREE

Renko is a well-known Japanese charting technique that removes time from the chart. Instead of drawing bars in constant intervals (time) as a normal chart would, a Renko chart does so only when price moves beyond a predefined amount.
In a Renko chart, a bar is created when price exceeds the previous bar’s high or low by a predefined amount or what we call the Box Size. The result is a chart with equally sized bars running up or down in 45 degree angles. Such a chart offers the following advant
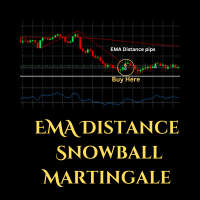
Expert Advisor (EA) that utilizes the basic EMA Distance strategy along with RSI for take profit, and employs support and resistance levels from the Zigzag indicator as stop-loss and take-profit points, you can follow these guidelines: Dow Theory Strategy : This involves analyzing trends using the Dow Theory principles, mainly focusing on identifying primary trends (bullish or bearish) and secondary trends (corrections). You'll need to implement rules for identifying these trends based on price
FREE

Trading the currency markets is a complex business, not least since we are dealing with pairs of currencies, and by inference, pairs of economies. All economies around the world are interlinked, and reflected in the constant ebb and flow of currency strength and weakness. The problem for us as traders is monitoring so many pairs simultaneously, since every pair does not move independently, but reflects the interrelated nature of this market.
The Quantum Currency Heatmap delivers the informatio

Embrace the Power With Ultimate Trend Trader Indicator. Facing the reality of individual traders, we are far from harnessing the capabilities of AI and high-frequency trading algorithms that dominate today's markets. Without access to massive data centers or infrastructure to compete on microseconds, the battle seems skewed. Yet, the true advantage lies not in technological arms but in leveraging human intellect to outsmart the competition. The Ultimate Trend Trader Indicator embodies this appr

In this indicator, Heiken Ashi candles are calculated with the most optimal method. You can also customize the results by adjusting the amount of period and method input. But the most important advantage of this indicator is the adjustment of the time frame value. You can use this to calculate the Heiken Ashi chandels to See in time frames with lottery in the lower time chart. In this case, you get the best signal to buy or sell using two or more Heiken Ashi indicators with different timeframes
FREE

The indicator shows when there are overpricing and divergences over a normalized MACD Plus, it displays signals with configurable alerts, self-regulating dynamic overprice levels, and a simple setup and interface. This indicator automatically calculates markup ranges. MACDmaxmin is an indicator based on the MACD oscillator that effectively identifies trend changes in price, as it is a momentum indicator that captures the trend and shows the relationship between two moving averages of the price.
FREE

In the world of finance, correlation is a statistical measure of how two securities move in relation to each other. Correlations are used in advanced portfolio management. This indicator measures how different securities move in relation to a reference one, thus making portfolio management easier. [ Installation Guide | Update Guide | Troubleshooting | FAQ | All Products ] Avoid concurrent trades in highly correlated instruments Find trading opportunities among highly correlated instruments Cor
FREE
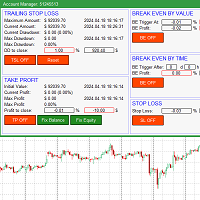
Менеджер торгового счёта имеет набор необходимых в торговле функций, которые учитывают результаты всего счёта в сумме, а не по каждой отдельной открытой позиции: Скользящий стоп лосс. Тейк профит. Точка безубыточности по сумме прибыли. Точка безубыточности по времени. Стоп лосс. Обычно каждый из этих параметров может применяться к каждой отдельной позиции. В итоге общая прибыль по счёту может продолжать наращиваться, а отдельные позиции будут закрыты. Это не позволяет получить максимальную приб

Apply to the 5 minute timeframe against the major USD forex pairs. AUDUSD EURUSD GBPUSD USDCAD USDCHF USDJPY Highlights the PropSense Book Levels Turn on/off for Sydney, Asia, London and New York Sessions Shows the Tokyo and London Fixes Turn on/off for Tokyo and London Configure how many historical fixes to show Shows the Sessions Turn on/off visible indication for sessions (supports 4 sessions) Visibly shows the sessions (out of the box configuration for Sydney, Tokyo, London and New York) Hig
FREE

3 Bulls and 3 Bears EA is an expert advisor that uses candlestick patterns and EMA indicator to trade the forex and crypto market with a grid system. The trading strategy of this expert advisor is based on the following logic: this expert buys or sells when a certain number of bear and bull candles with a specific body are formed. The expert advisor also uses a grid system to increase the profitability and reduce the risk of each trade. The grid system works by placing multiple orders at differ
FREE

VWAP RSJ is an indicator that plots the Hourly, Daily, Weekly and Monthly VWAP Lines.
Large institutional buyers and mutual funds use the VWAP ratio to help move into or out of stocks with as small of a market impact as possible. Therefore, when possible, institutions will try to buy below the VWAP, or sell above it. This way their actions push the price back toward the average, instead of away from it. Based on this information I developed this indicator that combines 4 types of VWAP T
FREE
Представляем советник SMC Range Breakout — ваш путь к использованию невероятного потенциала концепции Smart Money. Попрощайтесь с неопределенностью и приветствуйте подход, основанный на данных, который поднимет вашу торговлю на новую высоту.
Протестировано на GBP/JPY с универсальными таймфреймами. Обширное тестирование в основном проводилось на паре GBP/JPY, и советник Range Breakout продемонстрировал положительную производительность на различных таймфреймах. Хотя основное внимание уделялось

Sync Cursor MT5 | MT4 Sync Cursor MT4 https://www.mql5.com/en/market/product/118067 MT5 Tool will It make the Horizontal Line + Vertical Line in the Screen That it is always present on the screen and that it moves along with the candle (with the price). I am sure that something so simple will be a Treasure in the hands of many people.
Some of my personal trades are posted voluntary and free of charge in this Public channel https://t.me/FXScalpingPro
Contact: https://t.me/TuanNguyenTrader
FREE

This indicator is especially for the binary trading. Time frame is 1 minutes and exp time 5 or 3 minutes only. You must be use martingale 3 step. So you must put lots size is 10 % at most. You should use Mt2 trading platform to connect with my indicator to get more signal without human working. This indicator wining rate is over 80% but you may get 100% of profit by using martingale 3 step. You should use MT2 Trading Platform to connect meta trader platform and binary platform . You can get mt2
FREE

MT5toTLGGRM EA отправляет текстовые сообщения только на группу телеграмм или канал по Вашему выбору. Сообщения настраиваются для отображения информации о любой торговой деятельности на счете. Также отображается ежедневный отчет PnL. В одном и том же терминале МТ5 можно использовать несколько экземпляров данного советника для отправки сообщений на разные группы/канал телеграмм, но при этом следить за тем, чтобы каждый из них имел свой номер в настройках [B13].
Ниже перечислены особенности отпра
FREE

Moving Average 4 TimeFrames
Display 4 moving averages of 4 different timeframes on the same chart. In order not to pollute the chart, the indicator will plot the complete average only in the current timeframe of one of the 4 registered averages, for the other timeframes of registered averages the indicator only displays a part of the average so that you know where it is at that time graphic.
Example:
Display on the 5-minute chart where the 200-period arithmetic moving average of the 5 min
FREE
Active Symbol is a tool that works together with our Trade Panel. Since version 1.2 our panel can manage multiple symbols without having to open it in all of them, just one. This tool make this possible, because with it the actual or remote symbol information are saved for our Trade Panel to use. Remember to enable the panel control mode in the all symbols function. If you have some problemas with the shortcut buttons on chart on unpinned mode of Trade Panel try change the tickets digits option.
FREE

Логика работы
Утилита Stop Out простой но весьма удобный индикатор показывающий сколько пунктов осталось до уровня Stop Out. Его польза заключается в том, что многие трейдеры заведомо завышают риск в торговле в погоне за прибылью используют доступную маржу по максиму и вот для этого случая весьма важно знать где брокер может принудительно закрыть ваши позиции. Просто установите индикатор на график и в зависимости от открытой позиции в Buy или Sell, вы увидите граничную отметку цены для данно
FREE

The Keltner Channel is a volatility-based technical indicator composed of three separate lines. The middle line is an exponential moving average (EMA) of the price. Additional lines are placed above and below the EMA. The upper band is typically set two times the Average True Range (ATR) above the EMA, and the lower band is typically set two times the ATR below the EMA. The bands expand and contract as volatility (measured by ATR) expands and contracts. Since most price action will be encompasse
FREE

Kindly rate and comment about the product for upgradation & Support
The 5 EMA is plotted in green color ( Lime ).
The 14 EMA is plotted in red color ( Red ).
The 20 EMA is plotted in blue color ( Blue ).
The 200 EMA is plotted in yellow color ( Yellow ).
The Quarter EMA that provided calculates and plots four Exponential Moving Averages (EMAs) on the chart using different periods: 5, 14, 20, and 200. Each EMA is represented by a different color on the chart. Here's a description of each
FREE

If you like this project, leave a 5 star review. Often times we are using brokers that are outside of the GMT-0 timezone, this
not only complicates things, but, it can make seeing when a trading session starts
a bit more difficult than it should. This indicator allows you to set a timezone offset it will draw a vertical line for the: Day. Week. Month. Quarter. year.
FREE

(Графики криптовалюты)
Он приносит историю столько, сколько вы указали столбцов, и начинает напрямую отображать мгновенные данные.
Дает возможность работать на любых таймфреймах.
Позволяет работать с несколькими символами.
Это приложение является фоновой службой.
Он загружает историю всех символов, начинающихся с буквы "S", на экране обзора рынка и показывает данные по тикам.
Автоматически передает торговые данные Binance Spot в MT5 в реальном времени.
Запустите скрипт

Гармонические паттерны наилучшим образом используются для прогнозирования точек разворота рынка. Они обеспечивают высокую вероятность успешных сделок и множество возможностей для торговли в течение одного торгового дня. Наш индикатор идентифицирует наиболее популярные гармонические паттерны, основываясь на книгах о Гармоническом трейдинге. ВАЖНЫЕ ЗАМЕЧАНИЯ: Индикатор не перерисовывается, не отстает (он обнаруживает паттерн в точке D) и не изменяется (паттерн либо действителен, либо отменен). КАК

Volume Weighted Average Price or VWAP is an indicator wich shows different average prices on chart. This is very useful to find strong negotiation price areas and as trend following.
Configurations: Day, Week and Month - Show different VWAPs according to the period. You can change each line style on "colors" tab.
Any doubt or suggestion please contact us. Enjoy! This is a free indicator, but it took hours to develop. If you want to pay me a coffee, I appreciate a lot <3 PayPal, Skrill, Ne
FREE

Bar Countdown is a simple indicator for MetaTrader 5 that shows the time remaining of the each candle. It can be placed in any corner of the chart or near of the price close and it'll help you to know
if the current candle is ending. Choose the counter format between HR:MIN:SEC and MIN:SEC It is so easy to use, configure the color, size and counter position on the chart and that's it!!! The Countdown starts now!
Updates: 2021/02/28; v1.0: Initial release 2021/03/16; v1.1: Minor code changes
FREE
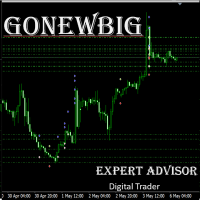
GoNewBig 是根據信號產生器做出交易決定後再根據現有的資金量調整下單的單量 設計目的希望所有參與交易的交易者,都能夠獲取合理的利潤
值得注意的是,過去的歷史回測匯或許會有相當大的利潤發生.但是將來的行情型態是不可知的.所以不要盲目地相信EA會創造出絕對的利潤,但也不要一昧地認為自動交易就是不可取的
特點
自適應的交易信號: 根據市場狀況自動調節信號產生的條件 簡單的設定方式: 只需簡單的設定即可. 單品種交易: 根據信號產生器做EURUSD單品種的交易 無華麗顯示面板: 將算力完全用在交易程序的計算 可以更高效續的執行工作 短期交易策略: 開單頻率及持倉時間一週 安全的風險控制: 在當前行情不例於持倉狀況時安全認損 不會早造成爆倉或是大量虧損
環境
使用時間框 H1 交易品種 EURUSD (品種必須列在報價清單上) 啟動資金使用1500美金即可運行 免費版只能交易EURUSD 正式版可以交易多品種 購買或是測試可以聯繫我取得適當的參數
運行淨值保持在2500美金以上 能更加確保交易帳戶的安全
參數
Magic : 自訂義EA持倉的辨
FREE
MetaTrader Маркет предлагает каждому разработчику торговых программ простую и удобную площадку для их продажи.
Мы поможем вам с оформлением и подскажем, как подготовить описание продукта для Маркета. Все продаваемые через Маркет программы защищаются дополнительным шифрованием и могут запускаться только на компьютере покупателя. Незаконное копирование исключено.
Вы упускаете торговые возможности:
- Бесплатные приложения для трейдинга
- 8 000+ сигналов для копирования
- Экономические новости для анализа финансовых рынков
Регистрация
Вход
Если у вас нет учетной записи, зарегистрируйтесь
Для авторизации и пользования сайтом MQL5.com необходимо разрешить использование файлов Сookie.
Пожалуйста, включите в вашем браузере данную настройку, иначе вы не сможете авторизоваться.