Conheça o Mercado MQL5 no YouTube, assista aos vídeos tutoriais
Como comprar um robô de negociação ou indicador?
Execute seu EA na
hospedagem virtual
hospedagem virtual
Teste indicadores/robôs de negociação antes de comprá-los
Quer ganhar dinheiro no Mercado?
Como apresentar um produto para o consumidor final?
Expert Advisors e Indicadores para MetaTrader 5 - 39

Prompt Firm Ready! Limited Free Version ZenithPulse é um poderoso consultor de trading de precisão que combina uma estratégia de alta frequência com uma gestão de risco rigorosa para operar exclusivamente EUR/USD durante a divulgação de notícias, reagindo à volatilidade instantânea que ocorre. Principais Características: Simplicidade e Facilidade de Uso: O ZenithPulse destaca-se pela facilidade de configuração e compreensão, permitindo que qualquer trader, independentemente do nível de
FREE

Minimalist style BB indicator fully filled with a single color. Indicator type: Technical Indicator You are too confused with the complicated zigzag lines in the BB indicator, especially when your strategy has many indicators combined, it looks like a mess and we will no longer see any candlesticks on the chart for technical analysis s. This indicator was born to solve that. See more: New tradingview indicator: Order Block TV | Minimalist Price Action Strategy | Subscribe It is designed
FREE

White label available. contact us for more info. dushshantharajkumar@gmail.com TradeGuard by Chart Walker TradeGuard is a MT5 Expert Advisor (EA) designed to enhance your trading experience by automating key aspects of trade management. This EA excels in efficiently managing Take Profit (TP) and Stop Loss (SL) levels, offering a seamless and intelligent approach to trailing stops. One of TradeGuard's standout features is its Smart Trailing Stop, which dynamically adjusts the trailing distanc
FREE
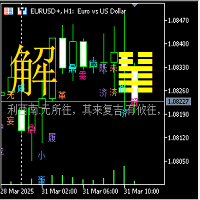
I Ching 64 Hexagram Change Indicator
1. Hexagram Indicator Description: (1) This 64 Hexagram Change Indicator is based on the Yin-Yang transformation thought of the "I Ching" philosophy in ancient Chinese culture, integrating the results of the long and short game of each candlestick K-line period of the financial trading K-line chart, using China's oldest prediction coding method, in the form of the I Ching 64 hexagrams, combining the Yin-Yang of each line of the hexagram with the Yin-Yang of
FREE

The Pivot Indicator is a vital tool for technical analysis used by traders in the financial markets. Designed to assist in identifying potential reversal points or trend changes, this indicator provides valuable insights into key levels in the market. Key features of the Pivot Indicator include: Automatic Calculations: The Pivot Indicator automatically calculates Pivot Point, Support, and Resistance levels based on the previous period's high, low, and close prices. This eliminates the complexity
FREE

This indicator draws regular bullish and bearish divergences in real-time onto the charts. The algorithm to detect those divergences is based on my 10+ years experience of detecting divergences visually. The divergences are drawn as green and red rectangles on the charts. You can even do forward testing in the visual mode of the strategy tester. This FREE Version is restricted to EURUSD and GBPUSD. The full version without restrictions is here: https://www.mql5.com/en/market/product/42758
Para
FREE

Market Cycle and Trading Sessions Indicator
Introducing our Market Cycle and Trading Sessions Indicator, a tool designed to provide you with a comprehensive view of the financial market like never before. Observe the market's pulse with our exclusive indicator. Gain a deep understanding of market phases, from accumulation to distribution, to make informed, strategic decisions with a high probability.
What makes our indicator?
1. Date Range for Calculations: Customize the start and end dates
FREE

One of the best tools for analyzing volume,
Weis Wave was idelized by David Weis, to facilitate the reading of directional flow. For the VSA method disciples it is an evolution of the practices created by Richard Wycoff, facilitating a predictive reading of the market, always seeking an accumulation and distribution of the negotiated contracts.
Cumulative wave volume Range of wave ( removed) Average Wave volume Ref "Tim Ord lectures" ( removed)
FREE

Explorador de padrões para padrão de triângulo, como triângulo simétrico, triângulo assimétrico ou triângulo de ângulo reto, padrão de cunha, como cunha ascendente ou cunha descendente, padrão de expansão e canal de tendência
Este indicador explora o padrão histórico, bem como os padrões atuais, é o melhor indicador para quem está tentando economizar tempo desenhando manualmente uma linha de tendência ou triângulo e deseja usá-lo para análise automatizada de plotagem de melhores padrões no grá
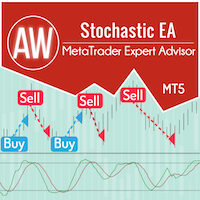
Sistema de negociação avançado automatizado. O EA negocia nos sinais do indicador estocástico clássico. Para sair das posições, ele usa um sistema inteligente de rastreamento e média usando ordens pendentes. Vantagens: Sistema de negociação totalmente automatizado Sinais de oscilador personalizáveis para operação do robô Configuração intuitivamente fácil de variáveis de entrada Adequado para todos os tipos de instrumentos e quaisquer prazos Sistema de arrasto ajustável embutido Observação! As li

The principle of this indicator is very simple: detecting the trend with Moving Average, then monitoring the return point of graph by using the crossing of Stochastic Oscillator and finally predicting BUY and SELL signal with arrows, alerts and notifications. The parameters are fixed and automatically calculated on each time frame. Example: If you install indicator on EURUSD, timeframe M5: the indicator will detect the main trend with the Moving Average on this timeframe (for example the Moving

The principle of this indicator is very simple: detecting the trend with Moving Average, then monitoring the return point of graph by using the crossing of Stochastic Oscillator and finally predicting BUY and SELL signal with arrows, alerts and notifications. The parameters are fixed and automatically calculated on each time frame. Example: If you install indicator on EURUSD, timeframe M5: the indicator will detect the main trend with the Moving Average on this timeframe (for example the Moving

Probability emerges to record higher prices when MACD breaks out oscillator historical resistance level. It's strongly encouraged to confirm price breakout with oscillator breakout since they have comparable effects to price breaking support and resistance levels; surely, short trades will have the same perception. As advantage, many times oscillator breakout precedes price breakout as early alert to upcoming event as illustrated by 2nd & 3rd screenshot. Furthermore, divergence is confirmed
FREE
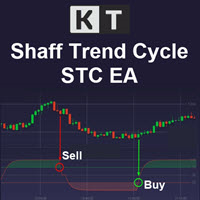
O KT Schaff Trend Cycle Robot implementa uma estratégia de negociação altamente eficaz, utilizando uma combinação de ciclos de sobrecompra/sobrevenda identificados pelo indicador STC e médias móveis exponenciais (EMA) rápidas e lentas. Quando as regras de entrada predefinidas são atendidas, ele rapidamente coloca ordens pendentes nos pontos altos ou baixos com base na análise das últimas 10 velas. Baixe os arquivos de configuração .
Entrada de Compra:
O indicador STC sai da zona de sobrevenda,
The indicator is a line right at yesterday's closing price. With the indicator, there is no need for adding or deleting previous day close lines each new day. T he line gives you an instant visual reference point for support, resistance, and market sentiment. Whether you are day trading or swing trading, this line helps you quickly gauge where the market closed last session and how current price action relates to that level. It works seamlessly across all timeframes - from 1-minute charts to d
FREE

A pin bar pattern consists of one price bar, typically a candlestick price bar, which represents a sharp reversal and rejection of price. The pin bar reversal as it is sometimes called, is defined by a long tail, the tail is also referred to as a “shadow” or “wick”. The area between the open and close of the pin bar is called its “real body”, and pin bars generally have small real bodies in comparison to their long tails.
The tail of the pin bar shows the area of price that was rejected, and t
FREE
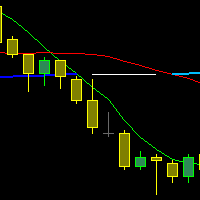
The indicator draws three Moving Averages. Two short ones cross a long one.
At the same time, the long MA changes color: If both short MAs are above the long one - first color; If both short MAs are below the long one - second color; If the two short MAs are on opposite sides of the long one - third color. All three MAs are based on closing prices with a smoothing method of "simple."
cross MA cross 3 MA cross three Moving Average across Moving cross Moving crossing MA crossing MA across MA
FREE

Volume Weighted Average Price (VWAP) is a trading benchmark commonly used by Big Players that gives the average price a Symbol has traded throughout the day. It is based on both Volume and price. Additionally we put in this indicator the MVWAP (Moving Volume Weighted Average Price). For those who do not know the usage and the importance od this indicator I recommend a great article about this subject at Investopedia ( https://www.investopedia.com/articles/trading/11/trading-with-vwap-mvwap.asp )
FREE

Magic Trend
This MT5 indicator is a Moving Average with 3 signal colors. The 3 input parameters on this Indicator give you a chance to set any Moving Average of choice. A combination of 2 different exponential moving averages, relative strength index, commodity channel index, and William's percent range provide the signals.
White color = Null/No/Exit Signal Green color = Buy Signal Red color = Sell Signal
Point To Note: Confirm the color change only after the current candle closes to avoid
FREE

Judas Swing ICT Forex without confirmation MT5
The Judas Swing ICT Forex without confirmation Indicator is designed to recognize and interpret deceptive market movements within forex and stock trading. It pinpoints situations where the market executes a misleading move to entice traders before swiftly reversing direction. This tool is widely used in ICT trading methodologies and technical market analysis.
Judas Swing ICT Forex without confirmation Indicator Specifications Table
The table bel
FREE
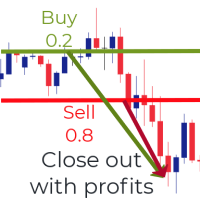
Introducing the Zone Recovery EA, a powerful tool for traders who seek precise control over their Zone Recovery strategies. This manual version operates similarly to the Zone Recovery mode in ManHedger but some distinctive features – the Stop Loss (SL) cannot be modified during the strategy execution, and no pending orders are opened, when the StartPrice is reached. There are no input parameters. Zone Recovery strategies can only be executed on accounts that allow hedging. Key Features: Hedging
FREE

It's a triangular arbitrage system (three pairs correlation system) to use 3 currencies to make 3 pairs to open hedge orders on those.
The expert starts opening six orders for each ring (3 plus and 3 minus) and waits to move prices in one direction to make a grid of orders.
The expert can use a maximum of 8 currencies to make 28 pairs and make 56 rings.
It is important the order of currencies is from the strongest to the weakest.
Strongest... EUR/GBP/AUD/NZD/USD/CAD/CHF/JPY ...weakest.
Can
FREE

The signal trend indicator Sliding Step . The appearance of a signal in the form of an arrow gives a recommendation to open a deal. The appearance of scissors warns of a changing in the situation and gives a recommendation on fixing profit (loss).
Settings:
Trend filter (period) - the filter restricts trade in transitional stages and U-turns. It is recommended that you actively work with the filter settings. The upper limit of the settings depends on the volatility of the instrument. ht
FREE

Este indicador multi-quadro de tempo e vários símbolos identifica os padrões duplo superior / inferior, cabeça e ombro, flâmula / triângulo e bandeira. Também é possível configurar alertas apenas quando uma ruptura do decote / triângulo / mastro tiver ocorrido (ruptura do decote = sinal confirmado para parte superior / inferior e cabeça e ombros). O indicador também pode ser usado no modo de gráfico único. Por favor, leia mais sobre esta opção no produto blog . Combinado com suas própria

Essa ferramenta poderosa identifica automaticamente as linhas de tendência, ajudando você a simplificar sua estratégia de negociação e tomar decisões mais informadas. mt4 versão
Recursos -chave Detecção automática de linha de tendência : o indicador "Basic TrendLine" digitaliza o mercado em busca de linhas de tendência em potencial e as exibe instantaneamente no seu gráfico.Isso economiza tempo valioso e garante que você nunca perca uma tendência importante. Painel amigável : Nosso indicado

Certainly! Let me introduce you to a powerful tool for MetaTrader 5 (MT5) that can automatically identify and draw support and resistance (S&R) levels on your trading charts. This tool is called the “Support and Resistance Levels Guru” . Support Resistance Levels Guru The Support & Resistance Indicator automatically displays essential S&R levels on your chart. These levels are crucial for technical analysis and are used by many traders. Resistance levels (zones) are shown in R ed , while suppo
FREE
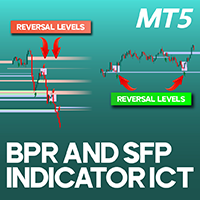
BPR + SFP Indicator in ICT MT5 The BPR + SFP Oscillation Breakout Indicator merges BPR and SFP patterns within technical analysis to detect market trends and highlight optimal trade entry points. This synergy relies on market dynamics and trader responses to significant price zones such as support and resistance levels, liquidity accumulation areas, breakout and pullback zones, and market highs and lows . This indicator assesses oscillation breakouts, verifies breakout and pullback movements at
FREE

Very simple, yet powerful, indicator that helps you get notified every time a candle touches your trend line, horizontal line, and/or your rectangular. Powerful indicator yet very simple to use! All you need to do is draw your MT5 trend lines, horizontal lines, and/or rectangles and SmartLine takes care of notifying you the moment the current price touches one of your key levels! No brainer If you like the indicator, please leave a review and share the tool with your peers. WARNING: Please use t
FREE

Simple Vwap with the daily, weekly and monthly
VWAP is the abbreviation for volume-weighted average price , which is a technical analysis tool that shows the ratio of an asset's price to its total trade volume. It provides traders and investors with a measure of the average price at which a stock is traded over a given period of time.
How it's used Identify entry and exit points: Traders can use VWAP to determine when to buy or sell an asset. Understand price trends : Traders can use V
FREE

This MT5 chart trend checker cuts through the noise of market volatility to provide a clearer picture of trends and price movements. It includes the following features that can provide more clarity during market assessments: 1 customizable multi-period moving average Optional Heikin-Ashi candles 3 switchable focus modes Distinct colors for easy analysis
Link to MT4 version: https://www.mql5.com/en/market/product/106708/
This indicator shows your preferred moving average from multiple time fram
FREE
MT4 Version
Advanced Range Breakout
Advanced Range Breakout allows you to trade breakouts in an impossible way for any human being. This EA focuses on entering breakouts as soon as the price moves over them, keeping a tight trailing stop loss (TSL) to catch as much as possible of breakouts' characteristic explosive price movements while protecting the trade if it turns out to be a fakeout. Feel free to get in touch we me to find out how I successfully managed to passed a prop firm challenge

QuantScalping - Precision Scalping for Consistent Profits Join channel here: https://www.mql5.com/en/channels/quantbreakprop
Overview QuantScalp is a cutting-edge scalping trading strategy designed to maximize your trading efficiency and profitability. Built with advanced algorithms and tailored for high-frequency trading, QuantScalp offers a unique approach to the markets, ensuring faster wins and higher win rates. Key Features Optimized Scalping Strategy : Harnesses advanced technical analy
FREE
Advanced MACD is a safe and fully automated EA. This EA uses MACD indicator with double confirmation set and filtering by range of latest price movements. Every order has stop-loss and the EA has implemented advanced filtering functions together with spread and slippage protections. This EA does NOT use the dangerous strategies like Martingale, etc. Advanced MACD is NOT a tick scalper that produces high number of trades per day and it is NOT dependent on every point of price. This EA is
A 'Seconds Period' chart, offering enhanced precision for charting and analysis. Especially beneficial during volatile market conditions and intraday trading. This indicator addresses the limitations of MT5's predefined timeframes, allowing for finer granularity down to second intervals.
Since only one EA can run per chart, being an Indicator allows for the additional advantage of running an EA alongside the Seconds Timeframe Candles Indicator on the same chart. Compatible with any intraday tim
FREE

Здравствуйте. После долгого пути разработки остановился на виртуальном сеточнике. У робота всего два режима автоматический и ручной. Автоматическая торговля, а также для тестера: M15, Н1 настройка Virtual_Grid_default рекомендуется true. Автомат без замечаний работает на форексе золоте и ByBit эфириум. На других инструментах, пока недостаточно статистики Ручная торговля на всех таймфреймах меньше часовика Обязательно посмотрите видео по последнему обновлению. Вся информация по работе советника
Este EA negocia usando Crossovers de Médias Móveis. Ele oferece configurações totalmente personalizáveis, configurações flexíveis de gerenciamento de posição, além de muitos recursos úteis, como sessões de negociação personalizáveis e um modo de martingale e martingale inverso. [ Guia de instalação | Guia de atualização | Solução de problemas | Perguntas frequentes | Todos os produtos ] Fácil de usar e supervisionar Configurações de média móvel totalmente personalizáveis Ele implementa dois comp

Consultor Especialista AlphaTrader Pro
Visão geral:
AlphaTrader Pro é um Expert Advisor sofisticado meticulosamente elaborado por uma equipe com mais de uma década de experiência em mercados financeiros. Embora não façamos afirmações irrealistas de riqueza instantânea, apresentamos uma ferramenta fiável concebida para ajudar os traders a tomar decisões informadas.
Características principais:
Abordagem Estratégica: AlphaTrader Pro emprega uma abordagem estratégica para negociação, combinando
FREE

Stochastic indicator alerts when EA Available in comments , must have indicator installed buys stochastic main line is above signal line stochastic is below 30 rsi 5 is below 20 sell stochastic main line is below signal line stochastic is above 70 rsi 5 is above 80 ADD to chart Stochastic k 30 - d 9 - slowing 3, levels 30/70 rsi 5 lelels 20.80
Full alerts push, mobile , email ect All input settings variable feel free to contact for more information or alert sugestions
FREE

Trading Busters Bollinger is a fully automated scalping robot that uses a highly effective breakout strategy, advanced money management, probabilistic analysis and advanced techniques to hedge risk. The strategy is executed with pending orders that are automatically triggered once the price crosses the indicated levels. The pending orders are placed at the level that is determined by a sophisticated algorithm and is inspired by the famous trading busters technique. Backtests presented in the
FREE

EA Pivot SR is a free version of a fully automatic Expert Advisor for MT5. There are no sewn-in deals, as is the case with most fraudulent advisors. Transactions in the tester and in real trading will correspond exactly to 99.99%.
The strategy of the Expert Advisor is based on trading from levels, which is the most acceptable solution than focusing on indicators that are usually late and give signals several bars late.
Support and resistance levels are calculated using the Pivot Point system
FREE

FairPrice Donchain is a free, trend-following breakout Expert Advisor designed to capture significant market moves by dynamically computing Donchian channels. The algorithm identifies breakout signals by comparing the previous bar’s close against a channel derived from historical highs and lows—ensuring that trades are entered when clear trends emerge. Key features include: Dynamic Channel Calculation: The EA calculates the highest high and lowest low over a user-defined period, enabling it to d
FREE

All traders should know the trend before making their decision when placing the buy or sell orders. The first step always starts with supply and demand , rising and falling channels , trend lines, engulfing candles etc. All the above contribute to what is called “Price Action” and that is the best and most reliable way in trading and catching the trend and making profits, without stress. The Investment Castle Trend Line Indicator will automatically draw the trend lines on the MT5 for you.
FREE

Trendy Stock is a price following indicator that uses Stochastic to show when the price is out of the oversold or overbought areas. The algorithm allows you to stay longer in a trend where the bulls or bears are in control. The indicator changes color immediately the price exits oversold/overbought state. In short, the downtrend [red] bars start to paint when the buying pressure decreases while the uptrend [green] bars form as the buy pressure kicks in. For MT4 version, follow :: https://www
FREE

BEHOLD!!!
One of the best Breakout Indicator of all time is here. Multi Breakout Pattern looks at the preceding candles and timeframes to help you recognize the breakouts in real time.
The In-built function of supply and demand can help you evaluate your take profits and Stop losses
SEE THE SCREENSHOTS TO WITNESS SOME OF THE BEST BREAKOUTS
INPUTS
MaxBarsback: The max bars to look back
Slow length 1: Period lookback
Slow length 2: Period lookback
Slow length 3: Period lookback
Slow leng
FREE

ET1 for MT5 is new and completely free!! ET1 for MT5 v4.20 Updated!! Now use on XAUUSD(Gold) !! The success rate is more than 75% !!!
important update: Merge ET9 's breakout strategy
Warning!! You can use ET1 completely free, but we do not guarantee ET1 stability, It is recommended that the more powerful ET9 for MT5 version includes the ET1 strategy and guarantees complete and stable returns.
The Best Expert Advisor on XAUUSD any timeframes ET9 for MT5 Updated v4.70 !! https://www
FREE

This indicator is a very simple indicator that draws candlesticks on a chart. However, it is possible to draw not only on the main chart but also on several sub-charts. In addition,it is possible to draw different symbols and timeframes from the main chart. features. 1. any symbols 2. any timeframes 3. two candle type(normal and heikin ashi) 4. many candle colors(intersection with ma_1) 5. pivot line (ver1.2) In case of positive candle, FULL : change color if low is over ma_1 PARTIAL :
FREE

I think you all know Donchian Channels. so I am not going to write about it.
With this indicator I tried to create Donchian Trend Ribbon by using Donchian Channels.
How it works ?
- it calculates main trend direction by using the length that is user-defined. so you can change it as you wish
- then it calculates trend direction for each 9 lower lengths. if you set the length = 20 then the lengths are 19, 18,...11
- and it checks if the trend directions that came from lower lengths is same
FREE

This indicator identifies and highlights market inefficiencies, known as Fair Value Gaps (FVG), on price charts. Using a custom algorithm, the indicator detects these areas of imbalance where the price moves sharply, creating potential trading opportunities. Indicator Parameters: Bullish FVG Color (clrBlue) : Color used to highlight bullish inefficiencies. The default value is blue. Bearish FVG Color (clrRed) : Color used to highlight bearish inefficiencies. The default value is red. Bullish FVG
FREE

The Supertrend etradro indicator is volatility based and is more of a trend following indicator in function. The ATR indicator, which is integrated into the calculation of the super trend, also calculates course gaps (gaps) and does not overlook them. This allows more accurate values to be calculated. When measuring volatility, the mean value of the current price serves as the basis. Since the Supertrend indicator features sliding stop and reversal lines, it is quite similar in function to the P
FREE

A new unique trading strategy Stock Index Trader, has been introduced, designed for trading the US30 index. The trading robot works on the timeframe (M30, H1) . The strategy does not use indicators with the exception of stop loss and take profit (floating, works according to ATR). The strategy works on Candlestick patterns, such as Piercing lines - a reversal pattern of Japanese candlesticks with additional installed filters and other popular patterns. The advisor does not use grid or martingale
FREE
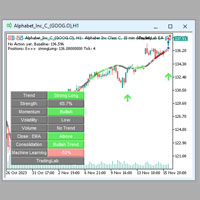
This EA will work together with TradingLab AI Private Indicator. Consider to copy trades from my signal here on MQL5 or subscribe to the private indicator if you don't have it already.
Checkout the private indicator website or watch the video linked in the store.
How it works: Step 1) The EA analyze the trend once it receives a signal from the indicator. It will open a small position and continue to monitor.
Step 2) The EA will automatically open a larger position if the position is prof

Just Keep CALM and Trade SMART This EA is only for serious traders, who wants really robust strategy for longterm and sustainable profits. Strategy uses MACD direction change for finding trading opportunities. It is fully automatic and doesn't require any action from you. Just attach it to the EURUSD H1 chart and let this EA works for you. This EA has passed 9 robustness tests , indicating a quality strategy.
Benefits for you Plug & Play system - just attach to the chart, configure your ri

For Demo, Competition and Real Account. Valid until 20/12/2025 Combined with artificial intelligence. Build your EA, so you can build your strategy with available indicators and tools. Build EA Simple does not have any set strategy, but with it you can use a combination of indicators and use them as signals or filters and build your strategy!
Indicators available: Price Action Fast Moving Average Slow Moving Average Adaptive Moving Average Triple Exponential Moving Average Relative Strength Ind
FREE

This EA script implements a triangular arbitrage strategy, which exploits price discrepancies between three related currency pairs (EURUSD, GBPUSD, and EURGBP). The strategy aims to profit from temporary mispricing in the market by simultaneously buying and selling the same currency pair through different routes. This approach is based on the law of one price, which states that in an efficient market, the price of a security should be the same across all markets. Importance: This strategy is imp

Indicador de pião real
Ele detecta o pião preciso no gráfico com corpo equilibrado e proporção de altura do pavio, que é o verdadeiro significado do pião, que o difere de Hammers e Doji ou Null Candlestick.
Este indicador traça um ícone de asas no número de piões encontrados no gráfico.
As configurações incluem
Número de compassos: Para ajustar a pesquisa no número de compassos
Cor do ícone: mude a cor do ícone
Código do ícone: altere o código de wingdings para o ícone
FREE

The strategy is based on finding top and bottoms during the night flat range. The night flat range usually lasts during the Pacific and Asian trading session and is characterized by low volatility. Most night scalpers have one weakness, that is, small gains and few big losses which wipe all the small gains. This Scalper is using Neutral network to avoid days that can potentially have high volatility and result in big loses, Neutral network does this accurately . The Neutral network has currently
FREE

Multi currency and multi timeframe scanner. Scans all instruments in "market watch" and gives either pc-alert or push-notification to the phone on a breakout. A breakout is by default defined as when a candle becomes longer than three ATR with a period of 300.
If you have the need for a custom buildt scanner, to scan for your particular setup. Please add a personal jobb under the Freelance section.
Functionality
Has spread filter , to not open stupid mega spread crypto currency charts. Has lo
FREE
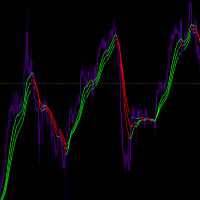
Input Parameters JawPeriod (default=9): Period for the blue line JawShift (default=0): Shift for the blue line TeethPeriod (default=7): Period for the red line TeethShift (default=0): Shift for the red line LipsPeriod (default=5): Period for the green line LipsShift (default=0): Shift for the green line Signals Bullish Conditions When price moves above all lines (all lines turn Lime) Potential buying opportunity Confirms upward momentum Bearish Conditions When price moves below all
FREE

Descrição do EA: Este EA de negociação automatizada foi projetado para oferecer uma solução durável, adaptável e de alto desempenho a longo prazo. Ao contrário de muitos EAs vendidos sem suporte, ele se destaca por sua flexibilidade e abordagem focada na gestão rigorosa de riscos. Cada estratégia integrada foi meticulosamente testada para se adaptar a várias condições de mercado, garantindo uma cobertura ideal. Equipado com gerenciamento de dinheiro avançado e personalizável, este EA visa manter

BLAZING NIGHT SCALPER ALL NEW GRID RECOVERY SYSTEM ADDED
Night scalping using Stop Losses have worked incredibly well in previous years prior to 2022. Blazing Night Scalper was originally tested on more than 10 years of Tick Data using Take profit and Stop Loss with amazing results. As soon as we hit 2022 night scalpers became gradually more difficult to gain profits most likely due to many reason such as brokers increasing spreads and having too many Expert advisors trading during these hours

Real Trend Zigzag PRO shows the real trend of a market, u nlike the default Zigzag indicator. It calculates the trend in real time and shows green lines for upwards trends, red lines for downward trends and blue lines for no trends. Regarding the old slogan "the trend is your friend" it helps you to decide if should open a buy or sell position. The PRO version is a multi timeframe zigzag (MTF). Means, it shows the trend of the current timeframe as well as the trend of a higher or lower time.

This indicator is especially for the binary trading. Time frame is 1 minutes and exp time 5 or 3 minutes only. You must be use martingale 3 step. So you must put lots size is 10 % at most. You should use Mt2 trading platform to connect with my indicator to get more signal without human working. This indicator wining rate is over 80% but you may get 100% of profit by using martingale 3 step. You should use MT2 Trading Platform to connect meta trader platform and binary platform . You can get mt2
FREE
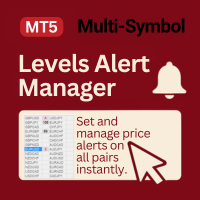
Levels Alert Manager (Beta) is a fast, user-friendly tool for placing and managing price alerts across multiple symbols — ideal for consistent, mechanical, and hybrid trading.
It provides a user-friendly, time-saving alternative to MetaTrader’s default alert system, which can be inefficient and clunky. The process is simple: click the + button, and drag the alert line to the desired level. All alerts are tracked in the panel, displaying live distance to price, with instant notifications trigg
FREE

AC Pivot Panel – Your Ultimate Pivot Trading Tool The AC Pivot Panel is a powerful yet user-friendly pivot point indicator designed to help traders identify key support and resistance levels with ease. Whether you’re a beginner or an experienced trader, this indicator simplifies pivot trading and enhances your decision-making process. Key Features : Interactive Selection Panel : Easily adjust pivot settings directly on the chart with a compact and intuitive panel. Multiple Pivot Methods : C
FREE
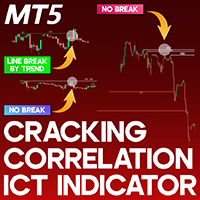
Cracking Correlation ICT Indicator for MetaTrader 5 The Cracking Correlation Indicator is a specialized ICT-style tool designed to track shifts in correlation among three financial assets. Typically, indices such as DJI, ND100, and SP500 move in tandem due to strong market correlation. However, there are instances when this synchronization breaks. The indicator identifies these moments, visually representing them through color-coded lines that change based on correlation shifts. «Indicator Insta
FREE

The selective pin bar is designed to identify reversals. To use the selective pin bar effectively, traders typically look for Strong Rejection: The tail of the pin bar should extend significantly beyond the surrounding price action. It indicates that there was a sharp rejection of higher or lower prices during the trading period. A strong rejection suggests that the market sentiment may be changing.
FREE

This is a Forex Scalping Trading Sytem based on the Bollinger Bands. Pairs:Major Time frame: 1M or higher. Spread max:0,0001. Indicators (just suggestion) Bollinger bands (20, 2); ADX (14 period); RSI (7 period ). Y ou should only trade this system between 2am to 5am EST, 8am to 12am EST and 7.30pm to 10pm EST. Do not scalp 30 minutes before a orange or red news report and not for a hour afterwards. Setup: is for price to move above the lower or lower Bollinger Bands, RSI raise above the
FREE
Simple SuperTrend indicator, similar to that of TradingView's.
Links:
All-In-One Supertrend Indicator MT4 Version
It has buffers for buy and sell signal, if you want to integrate this into an EA.
It helps traders easily identify trends by providing clear buy and sell signals based on price movements. Designed for simplicity, it’s easy to use and integrates well with various trading strategies, making it a great option for traders of all levels.
Happy trading!
FREE
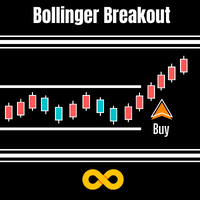
Bollinger Breakout Trader tells the trader when the market is about to breakout from a non-volatile period. Non volatility usually means its building up steam for more good moves in future. A signal is formed when this switch from non-volatile to volatile occurs. These periods are measured by both Bollinger Bands and Keltner Channels. Bollinger Bands measure the standard deviation of price from the Moving Average which results in an expanding and contracting channel. Keltner Channels are based
FREE
Supertrend with CCI Indicator for MQL5 – Short Description The Supertrend with CCI Indicator is a powerful trend-following tool that combines Supertrend for trend direction and CCI for momentum confirmation. This combination helps reduce false signals and improves trade accuracy. Supertrend identifies uptrends and downtrends based on volatility.
CCI Filter ensures signals align with market momentum.
Customizable Settings for ATR, CCI period, and alert options.
Alerts & Notifications via
FREE
O Mercado MetaTrader é um site simples e prático, onde os desenvolvedores podem vender seus aplicativos de negociação.
Nós iremos ajudá-lo a postar e explicar como descrever o seu produto para o mercado. Todos os aplicativos no Mercado são protegidos por criptografia e somente podem ser executados no computador de um comprador. Cópia ilegal é impossível.
Você está perdendo oportunidades de negociação:
- Aplicativos de negociação gratuitos
- 8 000+ sinais para cópia
- Notícias econômicas para análise dos mercados financeiros
Registro
Login
Se você não tem uma conta, por favor registre-se
Para login e uso do site MQL5.com, você deve ativar o uso de cookies.
Ative esta opção no seu navegador, caso contrário você não poderá fazer login.