Guarda i video tutorial del Market su YouTube
Come acquistare un Robot di Trading o un indicatore
Esegui il tuo EA
hosting virtuale
hosting virtuale
Prova un indicatore/robot di trading prima di acquistarlo
Vuoi guadagnare nel Market?
Come presentare un prodotto per venderlo con successo
Indicatori tecnici a pagamento per MetaTrader 5 - 4

Il dashboard di avviso RSI / TDI ti consente di monitorare gli RSI contemporaneamente (selezionabili da te) su ogni coppia principale scambiata.
Puoi usarlo in due modi:
1. Seleziona più intervalli di tempo e il trattino ti mostrerà quando ci sono più intervalli di tempo estesi oltre le normali condizioni di trading. Un ottimo indicatore del fatto che il prezzo ha spinto al massimo di recente poiché ha raggiunto un livello di ipercomprato o ipervenduto su più intervalli di tempo, quindi u

MetaForecast predice e visualizza il futuro di qualsiasi mercato basandosi sull'armonia dei dati dei prezzi. Sebbene il mercato non sia sempre prevedibile, se esiste un modello nei prezzi, MetaForecast può prevedere il futuro con la massima precisione possibile. Rispetto ad altri prodotti simili, MetaForecast può generare risultati più accurati analizzando le tendenze di mercato.
Parametri di input Past size (Dimensione passata) Specifica il numero di barre che MetaForecast utilizza per creare

Times and Sales Pro: Ottimizza le tue operazioni con il Disequilibrio nel Flusso delle Transazioni Opportunità in Piccole Variazioni di Prezzo
Times and Sales Pro è uno strumento essenziale per gli analisti che operano il flusso degli ordini attraverso Times and Trades . Ideale per gli scalper, è stato progettato per coloro che desiderano sfruttare piccole fluttuazioni di prezzo con alta precisione. Con calcoli avanzati, l'indicatore identifica i disequilibri nelle transazioni, fornend

The Nadaraya Watson Envelop indicator for MT5 is a popular tool used by traders to identify trends and potential buy/sell signals. The indicator is based on a non-parametric regression model that uses kernel smoothing to estimate the underlying trend of the market. The resulting envelopes are then plotted around the trend line, providing traders with an indication of where prices are likely to fluctuate. One of the key features of this indicator is its ability to send alerts, emails, and notific

Introduction to Harmonic Pattern Scenario Planner
The present state of Forex market can go through many different possible price paths to reach its future destination. Future is dynamic. Therefore, planning your trade with possible future scenario is an important step for your success. To meet such a powerful concept, we introduce the Harmonic Pattern Scenario Planner, the first predictive Harmonic Pattern Tool in the world among its kind.
Main Features Predicting future patterns for scenari
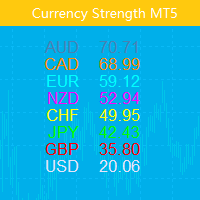
Questo indicatore mostra la forza relativa delle otto principali valute (USD, EUR, GBP, AUD, NZD, CAD, CHF, JPY). I valori della forza sono normalizzati nell'intervallo da 0 a 100. Un valore maggiore di 60 significa forte. Un numero inferiore a 40 indica debolezza.
biglietto Only Show Current Pair - Se vero, viene visualizzata solo la coppia di carte corrente. Altrimenti verranno visualizzate tutte le otto curve. Bars To Show – Numero di barre per visualizzare la curva di forza
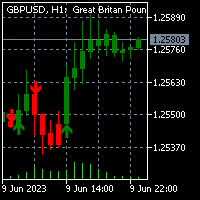
To get access to MT4 version please click here . This is the exact conversion from TradingView: "UT Bot Alerts" by "QuantNomad". This is a light-load processing and non-repaint indicator. Buffers are available for processing in EAs. You can message in private chat for further changes you need. Here is the source code of a simple Expert Advisor operating based on signals from UT Bot Alerts . #include <Trade\Trade.mqh> CTrade trade; int handle_utbot= 0 ; input group "EA Setting" input int magic_

Currency RSI Scalper MT5 è un indicatore professionale basato sul popolare indicatore Relative Strength Index (RSI).
Sebbene l'indicatore RSI funzioni bene per un intervallo di mercato, non riesce a generare segnali redditizi quando le condizioni del mercato cambiano, e quindi produce segnali errati con conseguenti grandi perdite.
Hai mai pensato a un indicatore RSI adattivo che si adatta alle condizioni di mercato?
L'indicatore presentato implementa un algoritmo di ottimizzazione che tro

Multicurrency and multitimeframe modification of the Fractals indicator. Displays the last two fractals — their sequence (and which one is broken), or the distance between them. You can specify any desired currencies and timeframes in the parameters. Also, the panel can send notifications on a fractal's breakout. By clicking on a cell with a period, this symbol and period will be opened. This is MTF Scanner. The key to hide the dashboard from the chart is "D" by default.
Parameters Calculatio

La combinazione di trend e livelli di rottura in un unico sistema. Un algoritmo di indicatore avanzato filtra il rumore del mercato, determina la tendenza, i punti di ingresso e i possibili livelli di uscita. I segnali indicatori sono registrati in un modulo statistico, che permette di selezionare gli strumenti più adatti, mostrando l'efficacia dello storico dei segnali. L'indicatore calcola i segni Take Profit e Stop Loss. Manuale e istruzioni -> QUI / versione MT4 -> QUI Come fare tradi

Was: $69 Now: $34 Blahtech VWAP - Volume Weighted Average Price (VWAP) is the ratio of price to total volume. It provides an average price over a specified time interval. Links [ Install | Update | Documentation ] Feature Highlights
Configurable VWAP Line Sessions, intervals, anchored or continuous Previous day settlement line Standard Deviation bands Alerts at bar close or real time Automatic Broker or Tick volumes Significantly reduced CPU usage
Input Parameters
Expert Advisor

Questo indicatore è progettato per rendere le revisioni di molti grafici su scale temporali diverse più rapide e più facili da eseguire. Tieni traccia di tempo e prezzo su più grafici Cambia simbolo su un grafico e anche tutti gli altri grafici dello stesso simbolo verranno modificati. Facile da usare, veloce da padroneggiare L'indicatore consente di identificare il prezzo e l'ora in cui si trova il puntatore del mouse sul grafico corrente, su tutti gli altri grafici aperti sullo stesso simbolo.

Welcome to Investment Castle products This product is exclusively available in the MQL5 market and is not available and will not be available anywehere else. The Combined indicator is a multi-time frame indicator and it is built using 3 indicators: Bands indicator which draws the support and resistance key levels using up to 5 different time frames Patterns indicator which draws the chart patterns using up to 6 different time frames Spots indicator which shows the common candlestick patterns Yo

KT Supply and Demand indicator identifies and plots key supply and demand zones. It achieves this by analyzing swing points and integrating them with a multi-timeframe analysis, ensuring that only the most crucial supply-demand zones are highlighted. This advanced method highlights the regions where prices are likely to reverse, stemming from significant supply-demand zones established by recent price movements.
Features
Precision Analysis: Our refined algorithm is designed to accurately pi
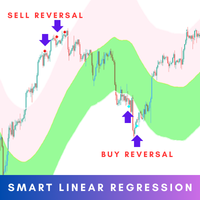
The Smart Linear Regression indicator is a powerful, non-repainting tool designed for traders looking for enhanced accuracy in market analysis. Unlike the typical linear regression channels that often repaint, this indicator provides reliable insights without changing past values, making it more trustworthy for forecasting future price movements. MT4 Version - https://www.mql5.com/en/market/product/124893/ Overview: The Smart Linear Regression Indicator goes beyond the basic linear regr

Place price Alerts on extended Rectangles and Trendlines - Risk reward indicator mt5 Extend Rectangles & Trendlines to the right edge Mark your supply demand zones with extended rectangle and draw support resistance lines with extended trendline. Find detailed manuals here . Find contacts on my profile . MT4 Rectangle extender indicator will simplify and make it easier for you to analyze markets and stay notified about important events. When you extend rectangle or trendline the a

Trend Shift is a very interesting trend indicator. The Trend Shift indicator helps you identify either a new or existing trend. One of the advantages of the indicator is that it quickly adjusts and reacts to various chart changes. Of course, this depends on the settings. The larger it is, the smoother the wave the trend line will be. The shorter the period, the more market noise will be taken into account when creating the indicator. The goal that was pursued during its creation is to obtain si
ICT Template Indicator visualizes and automatically updates all important ICT elements for Scalpers, Day and Swing traders. It allows you too keep your chart clean and bring any elements by just one click to the buttons. Thanks to mobile notifications on external liquidity levels, you will not miss any opportunity and you don't have to sit behind the screens whole day. Each element has fully customizable colours, width, line types, max timeframe to be shown etc... so you can really tweak your ch

The indicator draws support and resistance lines on an important part of the chart for making decisions. After the trend line appears, you can trade for a breakout or rebound from it, as well as place orders near it. Outdated trend lines are deleted automatically. Thus, we always deal with the most up-to-date lines. The indicator is not redrawn .
Settings:
Size_History - the size of the calculated history. Num_Candles_extremum - the number of candles on each side of the extremum. Type_Ar

Scoprite la potenza dell'analisi del volume con il nostro indicatore del profilo del volume per Metatrader! / Versione MT4
Basic Volume Profile è un indicatore progettato specificamente per i trader manuali che desiderano ottimizzare il proprio trading. L'indicatore Volume Profile è uno strumento essenziale per qualsiasi trader serio che voglia comprendere meglio il comportamento del mercato. Con la nostra soluzione innovativa è possibile visualizzare in modo chiaro e conciso la distribuz

Effortless trading: non-repainting indicator for accurate price reversals Special Offer: Purchase now to receive free bonuses worth $60! (Read more for details) This indicator detects price reversals in a zig-zag fashion, using only price action analysis and a donchian channel. It has been specifically designed for short-term trading, without repainting or backpainting at all. It is a fantastic tool for shrewd traders aiming to increase the timing of their operations. [ Installation Guide | Upd
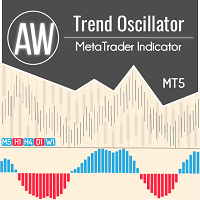
Oscillatore di tendenza con sistema di filtraggio avanzato. Determina la tendenza, il suo indebolimento e rafforzamento. Ha un pannello multi-timeframe integrato. AW Trend Oscillator funziona su qualsiasi timeframe e su qualsiasi simbolo (valute, indici, petrolio, metalli, azioni). Versione MT4 -> QUI / Risoluzione dei problemi -> QUI Caratteristiche e vantaggi:
Filtraggio trend avanzato Modifica della sensibilità dell'indicatore in un clic Installazione facile Pannello a più intervalli

The SyntheticaFX Boom & Crash Multi Indicator for MetaTrader 5 is an advanced trading tool designed to enhance your trading strategy by detecting potential spikes and analyzing market trends across various timeframes. This indicator is specifically tailored for the Crash and Boom indices, providing timely alerts and essential trend information to help you make informed trading decisions.
Key Features:
1. Spike Detection: - Identifies potential spikes on the following indices and timefra

** All Symbols x All Time frames scan just by pressing scanner button ** *** Contact me to send you instruction and add you in "Swing scanner group" for sharing or seeing experiences with other users. Swing EA: https://www.mql5.com/en/market/product/124747 Introduction: Swing Scanner is the indicator designed to detect swings in the direction of the trend and possible reversal swings. The indicator studies several price and time vectors to track the aggregate trend direction and dete
Smart Breakout Indicator determines support and resistance levels and also shows the breakout points of the levels in the form of a histogram.
The program contains two indicators in one: 1-support and resistance lines, 2-histogram indicator based on high price fluctuations. The indicator autonomously calculates the best support and resistance levels and also in the form of a histogram shows the best moments of the breakdown of the lines.
The histogram indicator is based on the action of p

# 33% off - limited time only # ChartSync Pro MT5 is an indicator, designed for the MetaTrader 5 trading terminals. It enables the trader to perform better multi-timeframe technical analysis, by synchronizing symbols and objects into virtually unlimited charts. Built by traders for traders! Telegram Premium Support - Dd you purchase the Chart Sync indicator and need a bit of help? Send us a screenshot with your purchase and your Telegram ID so we can add you to our premium support Telegram g

Breakthrough Solution For Trend Trading And Filtering With All Important Features Built Inside One Tool! Trend PRO's smart algorithm detects the trend, filters out market noise and gives entry signals with exit levels. The new features with enhanced rules for statistical calculation improved the overall performance of this indicator.
Important Information Revealed Maximize the potential of Trend Pro, please visit www.mql5.com/en/blogs/post/713938
The Powerful Expert Advisor Version
Automa

Robust median Renko style indicator for creating custom charts resembling Median Renko, Mean Renko, Turbo Renko and Better Renko candles as well as vanilla Renko with wicks plus Point-O charts. This all in one package provides all of the signals needed by day traders, scalpers, and even long-term traders.
Main characteristics The indicator is an overlay on the main chart so it is possible to utilize one-click trading and order manipulation directly on the custom charts. Visual order placement

An indicator based on time-tested trading methods that gives a signal that the market is overbought or oversold in a certain period of time
The indicator does not disappear when it appears, easy to use
Suitable for any trade
It can be used on any currency pair or crypto
He performed best in the period H1,H4,daily
After the purchase, you will also receive a seller's template with settings
The seller uses it more for trading on cryptocurrency
After the purchase, I also keep in touch

Modifica multivaluta e multitimeframe dell'oscillatore stocastico. È possibile specificare qualsiasi valuta e intervallo di tempo desiderati nei parametri. Il pannello visualizza i valori correnti e le intersezioni delle linee: Segnale e Principale (crossover stocastico). Inoltre, l'indicatore può inviare notifiche quando si attraversano i livelli di ipercomprato e ipervenduto. Cliccando su una cella con un punto, questo simbolo e punto verranno aperti. Questo è lo scanner MTF.
Similmente al

This indicator is designed to detect the best divergences between price/MACD and price/RSI. MACD and RSI produce by far the best divergence signals therefore this indicator focus on those two divergences. This indicator scans for you up to 15 instruments and up to 21 timeframes for bullish and bearish divergences. You need to add the indicator only to one single chart ! The indicator will then automatically scan all configured instruments and timeframes.
Important Information
The indicator c

Gold Trend - è un buon indicatore tecnico azionario. L'algoritmo dell'indicatore analizza il movimento del prezzo di un asset e riflette la volatilità e le potenziali zone di ingresso.
I migliori segnali dell'indicatore:
- Per VENDERE = istogramma rosso + puntatore SHORT rosso + freccia di segnale gialla nella stessa direzione. - Per l'ACQUISTO = istogramma blu + puntatore LONG blu + freccia di segnale acquatica nella stessa direzione.
Vantaggi dell'indicatore:
1. L'indicatore produ

Le linee di tendenza sono lo strumento più essenziale di analisi tecnica nel forex trading. Sfortunatamente, la maggior parte dei trader non li disegna correttamente. L'indicatore automatizzato delle linee di tendenza è uno strumento professionale per i trader seri che ti aiuta a visualizzare il movimento di tendenza dei mercati.
Esistono due tipi di linee di tendenza, linee di tendenza rialziste e linee di tendenza ribassiste.
Nella tendenza rialzista, la linea di tendenza Forex viene t

Questo cruscotto scopre e visualizza le zone di domanda e offerta sul grafico, sia in modalità scalping che a lungo termine, a seconda della vostra strategia di trading per i simboli selezionati. Inoltre, la modalità scanner del cruscotto vi aiuta a controllare tutti i simboli desiderati in un colpo d'occhio e a non perdere nessuna posizione adatta / versione MT4
Indicatore gratuito: Basic Supply Demand
Caratteristiche Consente di visualizzare le opportunità di trading su pi

Questo indicatore della zona di domanda e offerta disegna le zone sul grafico e invia avvisi quando il prezzo ha raggiunto o rotto una zona. È anche possibile utilizzarlo per essere avvisati di doppi cime/basse regolari invece che di zone. È possibile utilizzare filtri RSI, volume e divergenza per filtrare solo le configurazioni più potenti. Combinato con le tue regole e tecniche, questo indicatore ti consentirà di creare (o migliorare) il tuo potente sistema. Questo indicatore è per il trader p

Rediscover how fractals can transform your trading
This is a very simple yet effective indicator to trade breakouts of variable fractal periods. A fractal is a price formation of an odd number of bars, being the middle bar the highest or lowest price point of the formation. These prices act as short-term support and resistance levels, which this indicator uses to draw a price channel and display breakouts. [ Installation Guide | Update Guide | Troubleshooting | FAQ | All Products ] Easy to tra
Solo 4 copie disponibili a $49 – Assicurati la tua prima che il prezzo aumenti a $149! Scopri la potenza dell'IA con il SuperTrend AI Clustering MT5 con Scanner , uno strumento di trading rivoluzionario per MetaTrader 5 (MT5). Questo indicatore ridefinisce l'analisi del mercato combinando il clustering K-means con l'ampio indicatore SuperTrend, dando ai trader un vantaggio nella navigazione di tendenze e segnali. See more MT4 version at: SuperTrend AI Clustering MT4 with Scanner See more prod

Indicatore Marley: Trading di Precisione su MT5 Migliora il tuo trading con l'Indicatore Marley, progettato per un'eccezionale accuratezza dei segnali sia su MT4 che su MT5. Questo strumento versatile è ottimizzato per i mercati delle criptovalute e del Forex, offrendo precisione e flessibilità nella tua strategia di trading. Integrazione Perfetta con MT4: Per gli utenti della piattaforma MT4, l'Indicatore Marley è completamente compatibile e accessibile qui. Ottimizzato per i Mercati delle

L'indicatore mostra i punti di entrata e di uscita più appropriati. Inoltre, visualizza dati statistici su tutti i segnali per una migliore analisi del trading.
Con l'aiuto di questo indicatore sarete in grado di comprendere meglio il mercato.
Non appena la forza della tendenza inizia a indebolirsi (questo verrà mostrato sul pannello), la linea di tendenza graviterà verso la posizione orizzontale - questo è il segnale per uscire dal trade. Oppure si può uscire quando si raggiunge il livello

A combination of trend, pullback, range breakouts and statistics in one indicator Mainly functions as an Entry indicator. Works in any pair and timeframe.
Suggested Combination Cluster Helix with Strength Meter Strategy: Confirm signals with ideal strength levels Watch Video: (Click Here)
Features Detects range breakouts on pullback zones in the direction of the trend Analyzes statistics of maximum profits and calculates possible targets for the next signal Flexible tool, can be used in many

The indicator automatically identifies the 1-2-3 pattern on the chart. The indicator is able to monitor the formation of pattern in real time. It informs the trader when the pattern is completely formed (when the price breaks the line in point 2) and displays the completed patterns in history. The patterns are never redrawn. The indicator can identify patterns on any instruments (currency pairs, stock market, gold, etc.) without the need to adjust to each instrument. Simple and clear visualizati

The indicator displays volume clusters or volume profiles to choose from. For trading symbols which contain the tape of deals, the indicator can perform calculations based on the tape of deals.
Input variables
StepPoint - cluster step in points, if the value is zero, the step is assigned automatically. HistoryTicks - size of tick history (for VolumeType in the mode TimeAndSales). AssociatedTimeframe - binding the indicator to the specified timeframe of the chart, if the value is equal to

Questo indicatore traccia fino a 6 livelli che possono essere abilitati/disabilitati per rendere il grafico più pulito secondo il requisito del trader
Questi 6 livelli sono in 2 set: Alto e Basso
Per ogni set, è possibile selezionare un periodo di tempo diverso
Si basa sulla strategia di inversione di precedenti alti e bassi, poiché si ritiene che il prezzo di solito mostri un rifiuto in un intervallo di tempo più breve come 5 minuti quando il prezzo raggiunge il massimo giornaliero, sett

L'indicatore Boom and Crash Spike Detector è codificato in base a una strategia avanzata principalmente per rilevare il boom e il crash nei prezzi. Algoritmi complessi sono stati impiantati per rilevare boom e crash ad alta probabilità nei prezzi. Avvisa su potenziali fasi di boom o arresto anomalo:
Fase boom: quando il prezzo aumenta troppo velocemente. Crash Phase: quando il prezzo diminuisce troppo velocemente.
OFFERTA A TEMPO LIMITATO: L'indicatore è disponibile per soli 30$ e per tutta

Fractal Advanced - displays Fractal and Alligator indicators on the price chart. Has wide options for settings and customization. It is also equipped with alerts and a hotkey system. Manual (Be sure to read before purchasing) | Version for MT4 Advantages
1. The indicator does not fill the entire chart with fractals, but allows you to display only relevant signals. 2. The number of fractals is adjusted by scrolling the mouse while holding down the Shift key. 3. Instantly show/hide the Alligator

Sei stanco di perdere le tendenze di mercato redditizie? Vorresti avere uno strumento affidabile in grado di identificare le continuazioni del trend con precisione e accuratezza?
Non guardare oltre! Il nostro indicatore di continuazione del trend è qui per potenziare la tua strategia di trading e aiutarti a stare al passo con il gioco.
L'indicatore di continuazione del trend è un potente strumento, creato appositamente per assistere i trader nell'identificazione e nella conferma dei modell

Did You Have A Profitable Trade But Suddenly Reversed? In a solid strategy, exiting a trade is equally important as entering.
Exit EDGE helps maximize your current trade profit and avoid turning winning trades to losers.
Never Miss An Exit Signal Again
Monitor all pairs and timeframes in just 1 chart www.mql5.com/en/blogs/post/726558
How To Trade You can close your open trades as soon as you receive a signal
Close your Buy orders if you receive an Exit Buy Signal. Close your Sell orde

Descrizione:
L'indicatore "Struttura del mercato HH HL LH LL" è uno strumento potente e allo stesso tempo semplice per analizzare la dinamica dei prezzi nei mercati finanziari. Questo indicatore aiuta i trader e gli investitori a identificare i cambiamenti nelle tendenze e a identificare i punti importanti nelle serie temporali dei prezzi.
Componenti chiave dell’indicatore:
HH (Higher High): il massimo al quale il prezzo chiude sopra il massimo precedente. HH indica un rafforzamento del t

The intention of the dashboard is to provide a quick overview of the daily, weekly and monthly range of configured assets. In "single asset mode" the dashboard shows you possible reversal points directly in the chart, thus making statistics directly tradable. If a configured threshold is exceeded, the dashboard can send a screen alert, a notification (to the mobile MT5) or an email. There are various ways of using this information. One approach is that an asset that has completed nearly 100%

BUY INDICATOR AND GET EA FOR FREE AS A BONUS + SOME OTHER GIFTS! ITALO TRIANGLE INDICATOR is the best triangle indicator ever created, and why is that? Using Geometry and Fibonacci the Indicator works on all time-frames and assets, indicator built after 7 years of experience on forex and many other markets. You know many triangle indicators around the internet are not complete, does not help, and it's difficult to trade, but the Italo Triangle Indicator is different , the Italo Triangle Indi

Presentazione di Trade Sniper: il tuo vantaggio sui mercati.
Versione MT4: https://www.mql5.com/en/market/product/122371
Stanco di perdere operazioni redditizie o di essere trovato dalla parte sbagliata del mercato? Scopri Trade Sniper, l'indicatore all'avanguardia che sfrutta la potenza delle tendenze per darti un netto vantaggio nel tuo trading.
Trend Sniper non è solo un altro indicatore banale. È uno strumento sofisticato che combina algoritmi avanzati con principi di trading collauda
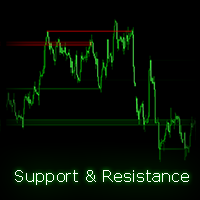
Questo indicatore trova e traccia automaticamente i canali di supporto e resistenza sul tuo grafico, rendendo facile l'identificazione dei livelli chiave. L'indicatore supporta più timeframe, consentendoti di visualizzare i canali di diversi timeframe sul grafico attuale. Inoltre, offre colori trasparenti per una maggiore chiarezza visiva e ti consente di personalizzare i colori dei canali in base alle tue preferenze. Come funziona questo indicatore? L'indicatore trova i punti di swing (alti e b

Grafico dei secondi per MetaTrader 5
Gli indicatori ti consentono di creare grafici nel terminale MetaTrader 5 con un intervallo di tempo in secondi. L'intervallo di tempo su tale grafico è impostato in secondi, non in minuti o ore. Pertanto, puoi creare grafici con un intervallo di tempo inferiore a M1. Ad esempio, S15 è un intervallo di tempo con un periodo di 15 secondi. È possibile applicare indicatori, Expert Advisor e script al grafico risultante.
Ottieni un grafico completamente funz

Ti presentiamo Quantum Heiken Ashi PRO Progettate per fornire informazioni chiare sulle tendenze del mercato, le candele Heiken Ashi sono rinomate per la loro capacità di filtrare il rumore ed eliminare i falsi segnali. Dì addio alle confuse fluttuazioni dei prezzi e dai il benvenuto a una rappresentazione grafica più fluida e affidabile. Ciò che rende il Quantum Heiken Ashi PRO davvero unico è la sua formula innovativa, che trasforma i dati tradizionali delle candele in barre colorate di faci

Dark Support Resistance is an Indicator for intraday trading. This Indicator is programmed to identify Support and Resistance Lines , providing a high level of accuracy and reliability.
Key benefits
Easily visible lines Only the most important levels will be displayed Automated adjustment for each timeframe and instrument Easy to use even for beginners Never repaints, never backpaints, Not Lag 100% compatible with Expert Advisor development All types of alerts available: Pop-up, Email, Pus

Introduction to Support Resistance Indicator Support and Resistance are the important price levels to watch out during intraday market. These price levels are often tested before development of new trend or often stop the existing trend causing trend reversal at this point. Highly precise support and resistance are indispensable for experienced traders. Many typical trading strategies like breakout or trend reversal can be played well around these support and resistance levels. The Precision Sup

The volume weighted average price (VWAP) is a trading benchmark used by traders that gives the average price a security has traded at throughout the day, based on both volume and price. It is important because it provides traders with insight into both the trend and value of a security. This version is simple to use as we simplify the indicator entries and leave only the most used buffers. You can use it to integrate with your EA Product Features Daily VWAP ploted at the chart. MOnthly

An indicator based on candlestick patterns
To catch short-term and long-term trends
If it gives a signal in the direction of the trend, it is long term
And if it gives a signal in the opposite direction of the trend, it is short term
Too many signals
Can be used in all symbols
Can be used in all time frames
Attributes: Too many signals Can be used in all symbols Can be used in all time frames Simple settings Simple and fast usage With author lifetime support
Settings: Candle back: Th

This LEGIT Indicator Can Accurately Predict the Outcome of One Bar.
Imagine adding more filters to further increase your probability!
Unlike other products, Binary Options PRO can analyze past signals giving you the statistical edge.
How Increase Your Probability
Information revealed here www.mql5.com/en/blogs/post/727038 NOTE: The selection of a Good Broker is important for the overall success in trading Binary Options.
Benefits You Get
Unique algorithm that anticipates price weaknes

The Squeezer indicator simply draws ascending lines with Sell signal in the downtrend and descending lines with Buy signal in the uptrend to catch the pullbacks and sniper entries. This is a common successful trading strategy being used by many successful traders, and the good thing about this strategy is that it works with all time frames. The difference is in the take profit level between them. Buy / Sell signals are triggered at the close of the current candles above / below the ascending or

What's new about iVISTscalp5 forecast indicator (Version 10)?
iVISTscalp5 is a unique nonlinear forecasting for a week ahead system for any financial instrument which executes fast scalping using time levels. iVISTscalp5 is a tool for easy study and understanding of financial market. 1) iVISTscalp5 forecast indicator has been completely rewritten into another programming language (C++), which has accelerated data loading and processing. As a result, a different graphical display of forecast

This indicator converted from 5 min Buy and Sell Range Filter - guikroth version on TradingView Popularity of the Range Filter
The Range Filter is a very popular and effective indicator in its own right, with adjustments to the few simple settings it is possible to use the Range Filter for helping filter price movement, whether helping to determine trend direction or ranges, to timing breakout or even reversal entries. Its practical versatility makes it ideal for integrating it's signals into

Multicurrency and multitimeframe indicator of the Standard Deviation Channel. Displays the current direction of the market. On the panel, you can see breakouts and touches (by price) of the levels of the linear regression channel. In the parameters, you can specify any desired currencies and timeframes. Also, the indicator can send notifications when levels are touched. By clicking on a cell, this symbol and period will be opened. This is MTF Scanner. The key to hide the dashboard from the char

DIREZIONE VOLUMI MT5
Normalmente l'indicatore del volume ha un cambio di colore predefinito quando il volume corrente è più alto del precedente, è importante ma non molto utile.
Per questo motivo è stato creato questo indicatore che oltre al volume normale, quando la candela è rialzista o ribassista, le dipinge di un colore diverso, di default è blu per rialzista e rosso per ribassista, ma questi colori possono essere personalizzati al Il gusto del commerciante.
Non dimenticare di con

Spike Hunter has been developed for Crash and boom markets.
Spike Hunter does not repaint.
Also please download SPIKE HUNTER(B)-boom and SPIKE HUNTER(B)-crash from the comments section to assist with extra confirmation Buy Signal ; Make sure that the trend for boom is Uptrend on 15 and 30min. Use the SPIKE HUNTER(B)-boom on your chart. Once the Up arrow comes on and the SPIKE HUNTER(B)-boom line color is blue then its the best time to trade. Sell Signal ; Make sure that the trend for crash

The Price Action Finder Multi indicator is an indicator of entry points that searches for and displays Price Action system patterns on dozens of trading instruments and on all standard time frames: (m1, m5, m15, m30, H1, H4, D1, Wk, Mn). The indicator places the found patterns in a table at the bottom of the screen. By clicking on the pattern names in the table, you can move to the chart where this pattern is located. Manual (Be sure to read before purchasing) | Version for MT4 Advantages
1. Pa

Documentation for connecting Metatrader 5 with Python with a simple drag and drop EA.
A full end-to-end solution ,fully tested ,fast and efficient!
The Pytrader ecosystem consists of a python script and a MT5 or MT4 version EA.
Further for the licensing an indicator is used.
The communication between the python script and the EA is based on sockets.
EA is the Server and the python script the Client .
It is always query(function / python script) and output(data / serv

MTF ATR dell'oro: questo è un indicatore tecnico di titoli azionari. L'algoritmo dell'indicatore ATR (Average True Range) analizza il movimento del prezzo dell'asset e riflette la volatilità disegnando i livelli corrispondenti in percentuali specificate (%) del prezzo di apertura del periodo di tempo specificato (D1). Gli indicatori (rosso e/o blu D1 H4) della direzione del movimento del prezzo del simbolo e i segnali delle frecce sono aiuti aggiuntivi ed essenziali per un trading intraday como

The balance of supply and demand is a simple and effective market analysis method. The supply and demand diagram can show you in advance, even before the trend reversal, where the supply ends and the demand is already emerging, where the demand ends and the supply is emerging, while substantially increasing the probability of making a deal in the right direction and with a high profit factor.
Indicator signals The indicator uses the price/volume values to generate signals: ED – excess demand.

Quarterly Cycles
Quarterly Cycles is based on the Quarterly Theory developed by Daye ( traderdaye on X ). This is an aid to the user to find Cycles and it is NOT automatic detected, user can select AMDX or XAMD in each Cycle and it will be visually drawn on the chart. Quarterly Cycles: Yearly, Monthly, Weekly, Daily, 6 Hour (90 minutes)
– Yearly Cycle : The year is divided in four sections of three months each Q1 - January, February, March Q2 - April, May, June Q3 - July, August, Sept
Il MetaTrader Market è un sito semplice e pratico dove gli sviluppatori possono vendere le loro applicazioni di trading.
Ti aiuteremo a pubblicare il tuo prodotto e ti spiegheremo come prepararne la descrizione per il Market. Tutte le applicazioni sul Market sono protette da crittografia e possono essere eseguite solo sul computer dell'acquirente. La copia illegale è impossibile.
Ti stai perdendo delle opportunità di trading:
- App di trading gratuite
- Oltre 8.000 segnali per il copy trading
- Notizie economiche per esplorare i mercati finanziari
Registrazione
Accedi
Se non hai un account, registrati
Consenti l'uso dei cookie per accedere al sito MQL5.com.
Abilita le impostazioni necessarie nel browser, altrimenti non sarà possibile accedere.