YouTubeにあるマーケットチュートリアルビデオをご覧ください
ロボットや指標を購入する
仮想ホスティングで
EAを実行
EAを実行
ロボットや指標を購入前にテストする
マーケットで収入を得る
販売のためにプロダクトをプレゼンテーションする方法
MetaTrader 4のためのテクニカル指標 - 119

This indicator is Strategy 2 of the Pipsurfer EA so traders can see where the EA would enter trades at and manually trade with the EA A Smart Money trend continuation strategy that's more moderate but this strategy includes candlestick price action and smart money institutional concepts to find trend continuation moves and hopefully to catch the BIG move that the Banks enter at. There are a full clues that large institutions give before entering and Pipsurfer Strategy 2 is designed to look for

Hello ! If you scroll in one chart, all charts will be scrolled If you change the time frame in one chart, it will change in all charts Of course, you can turn this feature on or off All the charts in which you want changes to be applied are specified through ID in the indicator settings You can scroll the charts of different time frames in two ways at the same time 1: Coordinated based on time That is, 1 hour candle is 60 candles one minute back 2: scroll in the form of number of candles That i
TRACKINGLEVELS (SUPPORTS AND RESISTANCES)
TrackingLevels is a useful indicator that saves considerable time when a trader starts analyzing a chart. This indicator draw on the chart all the resistances and supports that the market is creating. The resistance and support levels are very important, this levels define areas where there can be a considerable accumulation of sell or buy orders. These are a key areas that every trader must know and keep in mind all the time. This indicator helps the
It is a very simple indicator to display daily loss percentage, open position loss percentage, monthly loss percentage and monthly profit percentage. MT5 version
We assure you that we welcome any suggestions to improve this indicator and make the necessary changes to improve this indicator.
You can contact us via Instagram, Telegram, WhatsApp, email or here. We are ready to answer you.

You can proof how good this indicator is by comparing this indicator with other support resistance indicators in MQL5.com market. The Automated Support Resistance Screener is a powerful support and resistance custom indicator that can help traders determine the level of support and resistance values simple, easily and accurately. MT4 doesn't provide any support and resistance indicator, making ASRS an essential tool for traders and t his indicator is built using the MQL4 programming language an

Afidealn - インディケータはバイナリ オプション用に設計されています!
矢印インジケーター Afidealn は、期間で最良の結果を表示します。
M1 M5 M15 もういらない!
青い矢印を上に置きます
赤い矢印を下に置く
信号は、10 ~ 15 秒の遅延で現在のろうそくに表示されます。
Afidealn は、このような信号遅延のために、いくつかの指標に取り組んでいます。
マルチカレンシー!さまざまな通貨ペアで動作し、結果は優れていました。
また、おすすめインジケーターはニュースに非常に敏感です。
ニュース中に取引することはお勧めしません
最良の結果を得るには、2 分間取引を開始することをお勧めします
通貨ペアドルユーロは彼にとって最高です!
テストして結果を確認してください!
KFX RSI Dashboard uniquely monitors RSI levels on multiple currency pairs (selectable by you) at once and displays them in a two-column list of lower timeframe and higher timeframe (selectable by you). The currency pairs are the combinations of the major currencies (USD, EUR, GBP, CHF, JPY, CAD, AUD, and NZD). All the currency pairs are sorted automatically based on RSI Levels from this the indicator allows one of two output options:
1. Currency Strength OR 2. RSI Level
What's the Strat

This Indicator is designed to show past trade entries and exits on calculations from level crossed. It can be used on any chart. It will show past losses, profits and profits minus losses. User can change indicator's basic settings and the results shown will change. Indicator will work on running charts too. Past no. of bars will enable indicator to calculate set no. of past period of candles.

Hi Trader, We are strategy development for Binary and Forex tools, our product have success for binary trading 1 min - 2 min experation. At the moment I build indicator for trading all day, not like Bonosu series with specific time. We launch A-Boss Stats Indicator for trading 1 minute to 5 minutes experation is mean can trade from 1 minutes - 5 minutes. Specification of A Boss Stats trading binary option: Work with all MT4 broker. Chart Time Frame M1 only, can use M5 Experation time for contact

The Moolah Trend is a proven trading method that enables one trade the ranging market and the trend all on the right side of the market. The entire trading strategy is comprised of basically 5 mt4 plugins to support it. Send me a direct massage after purchase so I can forward you the bonus plugins and template file with a video for installation and how to trade the strategy.

The Cross Period Moving Average Support Resistant Map puts multiple latest updated MA value in the same window.
Useful for trend and breakout traders to identify support and resistance at a glance. Highlighted with multiple line width for each period. MA type : SMA MA price : candle close price MA periods: H1 , H4 , D1 , W1 , MN
**if you have any enquiry, contact me at : pipsstalker1507@gmail.com

Trend Lines contiuous Signal (FREE one WEEK) This indicator draws current trend line and provides Buy/Sell Signal based on calculations on Higher frame (Trend) and Lower frame(Entry signals)
* You should select the higher and lower frame for indicator calculations * You select the Trend line colors as you prefer * Enable or disable Alerts! Trend lines UP/Down are drawn when a trend is detected Wait for small arrows for entry : *Normally an UP arrow in an UP Trend is a BUY signal : ---you Clos
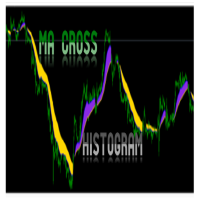
MA Histogram is MT4 Indicator for beginners which plot a histogram after Moving Average Crossover of 2 MAs. The Indicator does not have arrow or alert. It will simply plot on chart the potential Up and Down trend when trend is beginning or ending. It will show a Blue color for potential up trend and Gold color for potential down trend. Recommended pairs: All MT4 pairs including Indices You can change inputs to suit your Moving Average cross parameters and color for histogram.
Get for Forex MT5
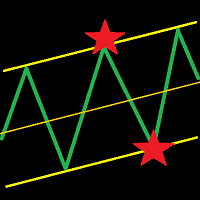
This indicator draws a trend line and a trend tunnel on the chart. You can choose several calculation methods, alerts, notifications, and other settings. It can also draw trendlines from another TimeFrame. You can also use this indicator for your ExpertAdvisor. The current values of the lines are stored in the memory buffer from where the EA can load them. You can trade the price bounce from the upper and lower lines . Settings TimeFrame – trend timeframe Description – show description of line

このインジケーターは、移動平均の組み合わせを使用します。
最初から、非常に簡単ですが収益性の高い戦略パターンを特定することができます (初心者のトレーダーでも見逃すことはありません)。
ユーザー用に定義済みの入力パラメーターが付属しています。 すでに定義されたパラメーターにもかかわらず、ユーザーは好みや好みに合わせて色のみを変更できます。
パラメータが組み込まれているため、移動平均パラメータの変更について心配する必要はもうありません。
あなたが使うすべてのペニーの価値があります.
更新されたバージョンの機能
1.移動平均線が交差した場合にアラートを送信します
2. 移動平均線のクロスでの売買のアラート
3.アラートが送信されると、注文する価格(アスクまたはビッド)が通知されます アップデート版をお楽しみください。 レビューとコメントを残してください。

CURRENTLY 20% OFF Pips breaker pro indicator MT4 Version and definitions : **Please contact us after your purchase and we will send you the complimentary indicators to complete the system.**
This indicator does not send any signal without a reason...You can observe and analyze the indicator and the signals it sends Cycle Sniper is not a holy grail but when you use it in a system which is explained in the videos, you will feel the difference. We recommend watching the videos about the indiac
This indicator will mirror the assets in use in another Metatrader, being able to choose the timeframe and a template. This is the Metatrader 4 Server, it can work with Metatrader 4 or 5 Client versions: Metatrader 4 Mirror Chart Client: https://www.mql5.com/en/market/product/88649
Metatrader 5 Mirror Chart Client: https://www.mql5.com/en/market/product/88650 Details of how it works in the video.
任意の通貨ペアと任意の時間枠のスキャルピング インジケーター。この指標は、市場の規則性の法則に基づいて、価格が反転する可能性のあるポイントを矢印で示します。インディケータはシグナルを再描画しません。矢印が表示されると、インジケーターは携帯電話や電子メールでトレーダーにシグナルを送信できます。インジケーターの設定は非常に簡単です。シグナル「期間」を設定するためのパラメーターは 1 つだけです。このパラメーターを変更することで、インジケーター信号と数値の精度を変更できます。
この指標で取引するための準備が整った取引戦略: 任意の通貨ペアにインジケーターをインストールします。 推奨期間 M5、M30、H1。 インジケーターの矢印が表示されるのを待っています. 青い矢印が表示されたら、買い注文を出します.赤い矢印が表示されたら、売り注文を出します。 TakeProfit は 25 ポイントに設定されています (主要通貨 GBPUSD、EURUSD で取引する場合)。 StopLoss は 55 ポイントを置きます。 ロットサイズは残高の大きさに応じて決定されます。 $200 の残高ごとに
this indicator functions to read buffers from other custom indicators, and combine 2 signals from each indicator Instructions 1. you have to know the buffer up or down of the indicator you want to use 2. if the indicator is in the same folder, you just need to enter the name of the indicator in the indicator name column if the custom indicator is in a separate folder, you can type it in the format folder1/folder2/name indicator

トレーディングマスターコントロールシステムの特徴
TMCS は、アセットのステータスを一度に表示するためのツールです。 TMCS はすべての時間枠を表示し、トレンド、取引力を示し、取引シグナルの取引力アラートに基づいて計算します。インジケーターは、ボリンジャー バンドからのブレイクアウトを計算します。また、非常に重要なことに、時間枠がフラットな場合、実際の取引力がないことを意味します。詳細については、スクリーンショットとビデオ チュートリアルの説明を参照してください。
プラットフォーム: Metatrader4
通貨ペア: 任意のペア、指数、金属 取引時間:24時間 時間枠: 任意の時間枠 指標のアルゴリズム
インジケーターは、ADX に基づいてすべての時間枠の全体的な傾向を計算します この指標は、Tickdata とビッド & アスク量に基づいて価格変動の力を計算します インディケータは、すべての時間枠のボリンジャー バンドからのブレイクアウトを計算し、非常に高いパワーでの爆発と反転の機会を示します。 インジケーターは、すべての情報に基づいて平均値を計算し、資産の取引時期

This indicator helps to identify market sessions, It's High/Low, Open Range (OR), range of the sessions in pips and percentage of previous day (change%) under OHLC.
It is also editable for any brokerage market watch time. For traders who use session trading strategies such as Mark B. Fisher ACD it can be super effective, where they can edit OR from the settings to either line or box. We tried to make the settings easier to edit, for traders' use on different markets, charts and brokerage time.
DESCRIPTION:
Account Information Panel v1.1 is a MT4 (MetaTrader 4) indicator, and it is an excellent tool to track and analyze your investments monthly under an investor's view to help investors/traders understand their investment/trading quickly without spending hours to do manual calculation. FEATURES:
Display a basic information Balance Equity Margin Free margin Margin level Leverage Swap (long/short) Spead Current DD (drawdown) Active positions (long/short, lot, profit/loss) Display week
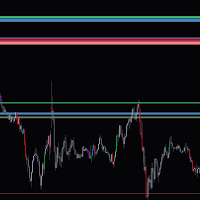
This indicator shows zones based on daily candles in the chart , Make sure you have enough daily bars in the chart before loading the indicator to the chart, These zones can act as both supply and demand zones. The zones are not subjected to repaint. If you have less zones or no zones for current prizes under the default inputs, try increasing the past days input and the zone sizes values gradually. If you have more zones than you need in chart try decreasing the past days and the zone size val
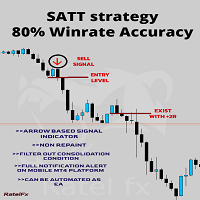
SAT strategy (Systematic Approach Trading Technique)
This is a revolutionary new way of trading the financial market.
This is the top indicator system that provides the most accurate trading signals for both entries and exits.
This system indicator algorithm provides the most accurate and precise signal only during the highly impulsive phase of the market.
This system indicator performs well during a high volume period, which is only the first three hours of a specific session, whether in L

The Qv² Histogram - Indicator developed for traders with advanced experience. This indicator has two purposes: 1-) Identify price normality patterns (green color) 2-) Identify abnormal price patterns “outliers” (red color) ====================================================================================================================================== Interpretation for trades in start trend: Histogram (Green color) crossing the zero line upside - uptrend. Histogram (Green color) crossing th

Современный индикатор паттернов PPR по торговой стратегии RAIT. Работает по тренду и без него. Имеет настройки таймфрейма для отображения. Можно настроить количество баров для отображения индикатора на графике. Используется несколько паттернов PPR. Индикатор предпочтительно использовать на часовом таймфрейме и выше, но работает и ниже . Паттерны: PPR, PinPPR, OutPPR. Отображаются одной стрелкой.

A supply and demand indicator designed with a minimalist trading strategy based on the nature of the market. The Bull zone is a strong support area, and the Bear zone is a strong resistance area. When a Bull zone was breakout, it becomes the "base" of the Bears and vice versa. When the price meets these areas, there is a high probability that the price will turn around, so we call them Obstacles. It is a suitable indicator for traders interested in manual price action and algorithmic trading up

Buy and Sell Targets Indicator You can see the buying and selling goals in the box and they are inevitably achieved. It consists of three lines: the first green color sets buying targets, the second red color sets selling targets, and the third blue color is the average price. Trading Method For Buy Trade: The entry point will be where the wavy blue line (representing the average price) is 'broken' by the ascending 'Buy' candle from beneath Please wait until the next candle appears to enter int

平均価格バー (APB) は修正された平均足タイプのローソク足です。平均足は、「平均棒」として翻訳された日本語の用語です。したがって、名前は、Average Price Bars です。平均価格バーは、現在の高値、安値、および終値アクションの「チョッピネス」と呼ばれることが多い名目価格アクションの変動を排除または削減することにより、現在の市場をより適切に描写します。
平均価格バー (APB) は修正された平均足タイプのローソク足です。平均足は、「平均棒」として翻訳された日本語の用語です。したがって、名前は、Average Price Bars です。平均価格バーは、現在の高値、安値、および終値アクションの「チョッピネス」と呼ばれることが多い名目価格アクションの変動を排除または削減することにより、現在の市場をより適切に描写します。

Hi! Between the given time range. Adds profit and lot. This can be written on the charter in English and Hungarian. The name of the symbol must be entered exactly. Good used for it. :)
Szia! A meg adott idősáv között Összeadja a profitot és lot-ot. Ezt ki írathatjuk Angolul és Magyarul a chartra. Pontosan kell beírni a szimbólum nevét. Jó használatott hozzá. :)
Best Solution for any Newbie or Expert Trader!
Forex Support Resistance is a unique, high quality and affordable trading tool because we have incorporated a number of proprietary features. it calculate highest high and lowest low of Previous X bars with possibility to select timeframe as desired . also it display the values of highest high and lowest low of Previous bar as a comment at the main chart . Imagine how your trading will improve because you are able to pinpoint the exact trigger poi

ZigZagSpeed indicator measures the rate of formation of zig and zag over time calculated by the known zig zag indicator. The calculation system is simply calculated by dividing the difference in pips by the number of bars elapsed in the selected time frame. The speed measurements that occurred in the past period will also be displayed on the graph together with the date of occurrence. Velocity numbers are located above or below each zig and zag formation in white. The number shown in yellow rep
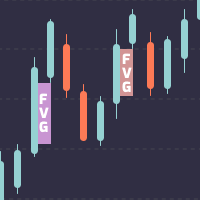
MetaTrader 4 の公正価値ギャップ インジケーター。
フェア バリュー ギャップは、有名なスマート マネー トレーダーであるインナー サークル トレーダー (別名 ICT) によって教えられた 3 つのローソク足の価格行動パターンです。 基本的に、これは価格の動きが速すぎる場合にチャート上に開いたままのギャップです。 それは、左のローソクとその隣の右のローソクが重なったティックを取得しない中央のローソクの本体の領域です。 価格がチャートにギャップを残す場合、2 つのことを念頭に置くことができます。 1つ目は、価格がその方向に向かう非常に強い勢いを持っていること、2つ目は、価格がその方向に向かう前に、ギャップを埋めるために通常リトレースすることです.
フェア バリュー ギャップは、プライス アクション トレーダーの間で最も一般的に使用され、プライス デリバリーに非効率性または不均衡がある場合として定義されます。 この非効率性は、以前は約定されなかった多くの残りの注文があるため、この価格の不均衡を再調整するために将来的に価格を引き付ける可能性があります。 トレーダーはこの情

スキャルピング インジケーター 2 in 1。このインジケーターを購入すると、自動ロボットがプレゼントされます。価格反転ポイントを検索するための自動システム。通貨ペアのチャート上にあるドットのインジケータは、価格変動の可能性のある反転ポイントを示しています.赤い点は下降の反転を示し、青い点は上昇の反転を示します。この指標は、スキャルピング戦略を使用した日中取引に最適です。チャンネルインジケーターとの組み合わせが理想的です。チャネル インジケーターが下降トレンドを示し、M1 TickTok が赤い点を描いたら、売ります。そして、チャネルインジケーターが上昇トレンドを示し、M1 TickTok インジケーターが青い点を描くとき、買います.
インジケーターの利点: OPEN モードでは値を再描画しません。 CLOSE モードをオンにすると、ろうそくが閉じるまで待つ必要があります。 この指標は、あらゆる通貨ペアでの取引に適しています。 この指標は、M1 を含むすべての時間枠で機能します 推奨事項: 任意のチャネル インジケータと併用 設定: mode_pric - 市場が分析される価格

Easy to use indicator that will help you place your pending and market orders with great accuracy. The indicator plots the order blocks based on how price reacts to current market structure. These key levels represent supply and demand zones and the Smart Blocks Trading System indicator uses price to assess whether an asset is being accumulated or distributed. It can be used on any financial instrument, and on any given time frame.
BoS stands for Break of (market) Structure. The blue and red d

This indicator is developed based on the multiple session trading to aid in analysis for all the day traders. The indicator supports all currency pairs as well as other trading instruments like indicies, commodities, metals ,etc. The way the indicator work is by making analysis on your behalf. During asian session that's when the indicator does the calculations and provided trading plans in form of areas on the chart for the current day. And this process happens everyday which allows for hands f

This indicator easily calculates the reward to risk ratio and indicates the stop out level and take profit limit with graphical boxes. Also shows the reward steps with fibonacci levels without changing the fibonacci default levels, this is a lot useful for people who use fibonacci retracement. Very user friendly interface and easily to use with graphical buttons.
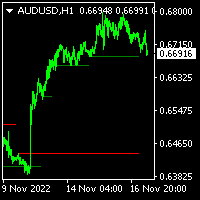
A simple and precise Indicator to identify potential supply and demand zones for price reversals. It was first described in Jason Pearl's Book, " Demark Indicators", published in 2008. It can be used both as Support and Resistance, and can be traded as a Breakout or as a Fakeout, depending on your trading style, and depending on how the candle was closed in proximity to TDST.

1 つのウィンドウで通貨ペアの複数の時間枠を分析すると、混乱する可能性があります。
複数の時間枠を分析するには、信頼できるインジケーターが必要です。
それらの 1 つは、9TF MACD 曲線を使用しています。
シンプルでありながら信頼性が高く、1 つのインジケーターで 9 つの時間枠すべてをカバーするコードを作成するために、昼夜を問わず取り組んできました。
このインジケーターの利点のいくつかを見てみましょう。
カラフルなヒストグラム。 各時間枠の曲線の色は互いに異なります。 MACDメインラインとシグナルラインの交差を示す矢印。 (注: 最後に表示される矢印は無視してください!) クリティカルレベルライン。 リアルタイム 9TF ダッシュボード モニター。 ある時間枠から別の時間枠に変更しても、9TF ダッシュボード モニターの計算は非常に正確です。 どの曲線が臨界レベルを超えており、どの曲線が臨界レベルを下回っているかを監視します。 メイン MACD がシグナル MACD を上回っているか、またはその逆であるかを曲線で監視します。 メイン MACD とシグナル MACD
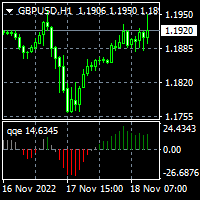
To download MT5 version please click here . - This is the exact conversion from TradingView: "QQE mod" By "Mihkel00". - It can be used to detect trend direction and trend strength. - Gray bars represent weak trends. You can set thresholds to achieve better accuracy in detecting trend strength. - There is buffer index 15,16,17 to use in EA for optimization purposes. - The indicator is loaded light and non-repaint. - You can message in private chat for further changes you need.

A Gap often occurs when the price moves with "strength" in a given direction (either up or down). This Gap is formed when, in looking at 3 consecutive candles, the wicks of the 1st and 3rd candles do not overlap. When this happens, the indicator creates a rectangle where the Gap is located. It identifies a zone where the price could potentially go back to (mitigation). The Gap/rectangle is mitigated when the price returns and completely covers the rectangle. Note that the indicator also show

To download MT5 version please click here . This is the exact conversion from TradingView: "WaveTrend [LazyBear]" By "zeusuk3". One of the coolest indicators out there to detect overbought and oversold zones. It can be used as a part of more complicated strategy and for confirming a potential trade setup. There are buffers to use in EAs also. The indicator is loaded light and non-repaint. - You can message in private chat for further changes you need. Thanks for downloading

Emini Signal Bar
Price - Promotion: $100 - Normal Price: $200
Symbol Recommended - S&P 500 Index / US500
Timeframe - 5 minutes Buffer Information - Buy Trade Buffer = 2 - Sell Trade Buffer = 3 Main features - Show Buy Signal Bar and Sell Signal Bar on Live Chart. - Get Alert from signal bar. - The precision of the Alert is superior to dots. (Alert is active at that time) - Dots will be recalculated after reset the properties. After the Alert is displayed, kindly make your decisions to trade.
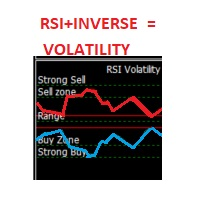
This indicator is an oscillator that shows the RSI (Relative Strength Index) in red and its inverse graph in a light green. Together this shows the volatility of the market (in its default setting). You can also change it to show only the RSI graph. It also gives you the possibility to change its Period. The oscillators zones (80,70,50,30,20) are marked by Strong Sell, Sell Zone, Range, Buy Zone, and Strong Buy respectively.
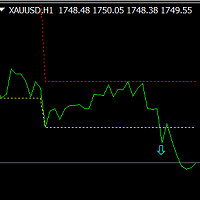
This is an MT4 indicator based on fluctuation statistics, which mainly includes two parts: one is display the fluctuation area, and the other is to display the signal at the same time if there is a signal generated.
Its main principle is to conduct data statistics based on the specified extreme value fluctuation radius, and draw the fluctuation area. If the breakthrough area is displayed, the signal in the same direction will be displayed. Advantage:
Suitable for all breeds. Applies to all cy

Thanks to this indicator, you will be able to analyze the trading of all your advisors from one account. You don't have to have a separate terminal for each Expert Advisor to evaluate its work specifically.
The indicator is able to analyze the account history by magic numbers and you will be able to see which setting with the magic number assigned to it gave what results. moreover, you will be able to analyze transactions on Buy and Sell separately, this is an underestimated moment for many tr

KFX Dashboard monitors Price Action using Candle Direction + Moving Average on Multiple currency pairs (selectable by you) and on Multiple Timeframes (selectable by you). The dashboard also reveals Currency Strength of pairs based on your Moving Average selection.
FEATURES
- Price Action: Candle Direction + Moving Averages(3x shown on chart). - Multiple Symbols and Multiple Timeframes. - Currency Strength Analysis. - Monitors Open Trades: Currency Amount + Pips. - Symbol button(click) change
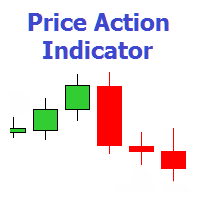
The indicator shows 7 patterns of the Price Action trading system, as well as the maximum and minimum price lines for the day. Timeframe: H1, H4, D1. Pin bar Outside Vertical Bar (OVB) Pivot Point Reversal (PPR) Closing Price Reversal (CPR) Double Extremums ( DMax/DMin ) Wide Range Bar (WRB) Inside Bar (IB) Settings PRICE ACTION PATTERNS Show Pin Bar Color Pin Bar - pointer arrow color. Show Outside Vertical Bar (OVB) Color Outside Vertical Bar - poin

ボリューム チャンピオンは、市場のボリュームを分析し、データをヒストグラム形式で表示するインジケーターです。市場分析の理論を掘り下げる必要はありません。インジケーターの読みに従うだけです。インジケーター バーは、市場ボリューム構造の分析に基づいて、価格変動の潜在的な方向性を示します。このインジケーターは、H4、D1、W1 などのより高い時間枠で使用するように設計されています。信号はレンダリングされません! 技術的には、インディケータは、トレーダーが望むように他の時間枠で使用できます。また、このインジケーターはどの通貨ペアでも使用できますが、USDJPY、EURJPY、EURUSD、GBPUSD、その他のペアなど、このインジケーターが最適に機能する通貨ペアがあります。購入後、インジケーターに最適な通貨ペアの完全なリストを提供します。 購入後ご連絡ください。サポートされている通貨ペアのリストと、取引をさらに収益性の高いものにするのに役立つ優れたボーナス指標を提供します!

Trend TD is a trend indicator. Thanks to the algorithm of this indicator, the signal will never go against the trend. Thanks to the two lines forming a narrow channel, the algorithm for analyzing entry points, the algorithm controls the reversal moments at the moment when the upper line of the channel has reversed and it is possible to visually draw a line crossing the upper line with itself in the past, while crossing the lower line at one point. If this rule is fixed, then the signal will

The indicator is built on a non-standard Zig Zag, it draws accumulations after which if the price leaves this zone and a test of this zone occurs, then a sound signal is given and an arrow appears - after the test candle closes.The indicator does not redraw its signals, it is very easy to use, there are only three settings 1- this is the zig zag parameter 2- this is the minimum price exit from the zone 3- this is the maximum price exit from the zone. The lower the parameter for Zig Zag, the more
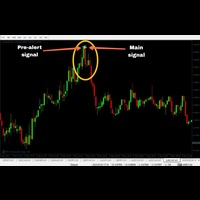
'Zoro PRO' is a reversal strategy based MT4 indicator with advance pre-alert system. Its an 100% non repaint indicator with an average accuracy of about 70-95% in any kind of market. (EXCEPT BAD MARKET AND NEWS TIME)
MT5 version: https://www.mql5.com/en/market/product/90934 (MT5 version not recommended)
Recommended Broker: Alpari, Amarkets, tickmill. Recommended pairs for M1:
EURUSD
AUDJPY
GBPUSD
EURJPY
NZDJPY
CADJPY
EURGBP
USDCAD
GBPCHF
GBPCAD
EURNZD
AUDNZD
-------------------------
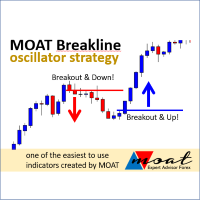
The indicator will provide a breakout line or price stop guide, we recommend M5 or H1 timeframes. Trade signal: Buy Signal: if the closed price (according to the timeframe) breaks the blue line and is already above it or if the lowest price stops above the red line. Sell Signal : if the closing price (according to the timeframe) breaks the red line and is already below it or if the highest price stops below the blue line. Feature: You will get time (hours) and price values for the lines
Nepsetms45 は、トレーダーに価格反転ポイントと現在のトレンド方向を示す外国為替スキャルピング インジケーターです。インジケーター信号の精度は平均 87% です。これは、インジケーターがチャートに矢印を描く場合、87% の確率で、近い将来、価格が少なくとも 20 ポイント以上矢印の方向に進むことを示唆しています。このインジケーターは、チャート上の線を使用してトレンドの方向と動きの強さも示します。
Nepsetms45 は、M5、M15、さらには H1 時間枠での日中スキャルピング用の既製の取引システムです。彼との取引はとても簡単です。インジケーターが青い矢印を描いたら、買い注文を開きます。テイク プロフィット +20 ポイント。青い矢印の少し下に設定されたストップロス。赤い矢印が表示されたら、同じことを行います。この場合のみ、売り注文を開き、TakeProfit を -20 ポイントに設定し、赤い矢印のすぐ上に StopLoss を設定します。取引システムは非常にシンプルで実績があります。ロット サイズはご自身で選択できますが、各取引の開始に使用するデポジットの 10% を
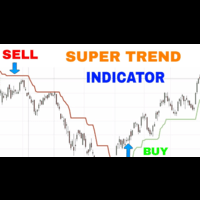
The SuperTrend Non Repaint Indicator is particularly stable and has a few advantages.
1.Magnified Market Price added for instant check of current market price
2.It uses a moving (statistical) median of the arithmetic mean (High + Low)/2 of the bars instead of a moving average. The (statistical) median is known to be more robust than any average.
3.It calculates both the Median and the ATR (average true range) 1 bar ago, whereas the original SuperTrend indicator takes the ATR and moving average

Gartley Hunter Multi - An indicator for searching for harmonic patterns simultaneously on dozens of trading instruments and on all classic timeframes: (m1, m5, m15, m30, H1, H4, D1, Wk, Mn). Manual (Be sure to read before purchasing) | Version for MT5 Advantages 1. Patterns: Gartley, Butterfly, Shark, Crab. Bat, Alternate Bat, Deep Crab, Cypher
2. Simultaneous search for patterns on dozens of trading instruments and on all classic timeframes
3. Search for patterns of all possible sizes. From t

This indicator contains Pivot Levels of: Traditional Fibonacci Woodie Classic Demark Camarilla Calculation periods can be set to auto / Daily / Weekly / Monthly / Yearly. Number of Levels are editable. Options to hide level labels and price labels. Pivots Points are price levels chartists can use to determine intraday support and resistance levels. Pivot Points use the previous days Open, High, and Low to calculate a Pivot Point for the current day. Using this Pivot Point as the base, three resi

Looking for an indicator that identifies high-probability price action patterns? Love counter-trend trading? The Kangaroo Tailz indicator might be just for you. This indicator is meant to be used as a reversal detector. I personally would rather enter a position at the beginning of a trend rather than catch the last couple of moves. This indicator does a good job of alerting when price may reverse by identifying price action patterns that occur frequently in markets. Even though this indicator i

1 つのウィンドウで通貨ペアの複数の時間枠を分析すると、混乱する可能性があります。
複数の時間枠を分析するには、信頼できるインジケーターが必要です。
それらの 1 つは 9TF STOCH RSI を使用しています。
シンプルでありながら信頼性が高く、1 つのインジケーターで 9 つの時間枠すべてをカバーするコードを作成するために、昼夜を問わず取り組んできました。
このインジケーターの利点のいくつかを見てみましょう。
カラフルなヒストグラム。 各時間枠の曲線の色は互いに異なります。 STOCHASTICメインラインとシグナルラインの交差を示す矢印。 (注: 最後に表示される矢印は無視してください!) OBOS レベルライン。 リアルタイム 9TF ダッシュボード モニター。 ある時間枠から別の時間枠に変更しても、9TF ダッシュボード モニターの計算は非常に正確です。 どの曲線が買われ過ぎのレベルを上回っており、どの曲線が売られ過ぎのレベルを下回っているかを監視します。 メイン STOCH が信号 STOCH を上回っているか、またはその逆であるかを曲線で監視します。 メイ

Pivot Point Indicator (Poivt)
ClassicMode indicator calculation formula (ClassicMode):
pp=(High+Low+Close)/3.0
s1=2*pp-High
s2=pp-(High-Low)
s3=Low-2*(High-pp)
r1=2*pp-Low
r2=pp+(High-Low)
r3=High+2*(pp-Low)
Woodie Mode indicator calculation formula (WoodieMode):
pp=(High+Low+2*Close)/4.0
s1=2*pp-High
s2=pp-(High-Low)
s3=Low-2*(High-pp)
r1=2*pp-Low
r2=pp+(High-Low)
r3=High+2*(pp-Low)
Fibo
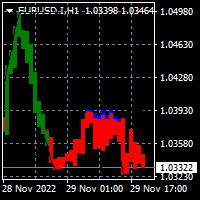
To download the MT5 version of Donchian Trend Ribbon please click here . You may also check this link . This is a conversion from TradingView: "Donchian Trend Ribbon" By "LonesomeTheBlue". This is a light-load processing and non-repaint indicator. Buffers are available for processing in EAs. You can message in private chat for further changes you need. Thanks for downloading
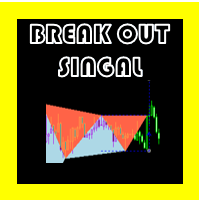
ブレイクアウトシグナル OSW
(メタトレーダー4)
高値と安値を破りたいですか? これは、これらのタイプのエントリからシグナルを取得するための完璧な指標です。
インディケータが開始するとすぐにシグナルは表示されませんが、価格が上昇するにつれて、ブレイクアウトするのに最適なパターンが見つかるまで市場を読み取ります。
高値と安値を読み取るインジケーターには、最も適切なものだけを取得できるジグザグ用の特別な構成があります。
他のインジケーターと同様に、完璧なエントリを提供するわけではありませんが、結果として提供されるものの多くは勝者であり、優れたテクニカル分析を伴って非常に良い結果をもたらします.
強気のエントリは青で、弱気のエントリは赤で表示され、それぞれに提案されたストップロスとテイクプロフィットがあり、バッファは完全に読み取られるように設定されており、シグナル アラートのオンとオフを切り替えることができます。
Metatrader 4 の Three MA Buy and Sell Signals PRO インジケーターは、トレンドが反対方向に変わるたびに売買シグナルを配信する 3 MA の取引システムです。
このシステム指標は、3 つの異なる期間を使用した 3 つの移動平均で構成されています。
この指標は、実際の売買シグナルを矢印の形で提供します。
MT4取引プラットフォームにインディケータをダウンロードしてインストールすると、以下の画像のようになります。
キーポイント トレンドシグナルインジケーター 再描画しない矢印 初心者に優しい 指標コレクションに追加する価値があります このインジケーターは、トレンド反転シグナルの確認ツールとして、既存の取引戦略またはシステムと連携できます。
基本的な取引シグナル Metatrader 4 の Three MA Buy and Sell Signals PRO インジケーターからのシグナルは解釈が簡単で、次のようになります。
買う 緑色のシグナル矢印がチャートに印刷されるとすぐに、買いシグナルが与えられます。 サポートの下にストップロス

MT4の3番目のCandle Forex Scalperインジケーターは、あらゆる時間枠とペアでうまく機能する真のスキャルピングインジケーターです.
キーポイント: 青い矢印は、買い取引の機会を表します。 赤い矢印は、売り取引の機会を表します。 このインジケーターは非常に信頼性が高く、軽量で、取引プラットフォームの速度を低下させません。
それと取引する方法は? 青い色のダフ屋の矢印がチャートに現れるたびに、買いポジションを開きます.
赤い色のダフ屋の矢印がチャートに表示されるたびに、売りポジションを開きます.
チャート上で反対の取引シグナルが発生したら、取引を終了します。
3番目のCandle Forex Scalperインジケーターで取引を開始および終了するには、お好みの取引方法を自由に使用してください。
インジケーターの仕様 取引プラットフォーム: Metatrader 4 (MT4) 向けに開発
通貨ペア: どのペアにも対応
時間枠: 任意の時間枠で機能します
入力パラメータ: Shift 矢印、雄牛のろうそくのフィルター、色の設定とスタイル
インジケーター

To download MT5 version please click here . This is the exact conversion from TradingView: "B-Xtrender" By "QuantTherapy". - It is an oscillator based on RSI and multiple layers of moving averages. - It is a two in one indicator to calculate overbought and oversold zones for different RSI settings. - This indicator lets you read the buffers for all data on the window. - This is a non-repaint and light processing load indicator. - You can message in private chat for further changes you need.

* All Symbols x All Timeframes scan just by pressing scanner button ** *** Contact me to send you instructions and add you in "Candle Scanner group" for sharing or seeing experiences with other users. Introduction: Candles tell their story. When looking at a candle, it’s best viewed as a contest between buyers and sellers. Candlestick patterns are used to predict the future direction of price movement. Candlesticks are an easy way to understand the price action. You can use candlesticks to decid

Metatrader 4 の Obie Scalper インジケーターは、使いやすい外国為替スキャルピング インジケーターであり、低い時間枠で迅速な利益をもたらします。
この指標は、さまざまな取引セッション中に発生する可能性のある迅速なスキャルピングの機会についてチャートを分析します。
最高の結果は、最も不安定な取引セッション (ロンドンとアメリカ) で達成されました。
当然のことながら、Obie Scalper インジケーターは、好みの時間枠と通貨ペアで機能します。
それと取引する方法(例)? 水色の矢印がチャートに表示されたらすぐに、買いスキャルピング取引を開始します。
マゼンタの矢印がチャートに印刷されたらすぐに、売りスキャルピング取引を開始します.
8-15 ピップスの利益のために取引を終了します。
短期ストップロスを利用して、損失を最小限に抑えます。
AFSTAR Forexインジケーターで取引を開始および終了するために、お好みの取引方法を自由に使用してください。
インジケーターの仕様 取引プラットフォーム: Metatrader 4 (MT4) 向けに開

DepthTrendView is an indicator that is used to see the direction of the market very clearly compared to the indicators that are commonly used by many people.
What is interesting about this indicator is that you can see the direction of the trend and also know that the market is at the end or that the market wants to start a new trend.
How to Use: 1- To see the earliest BUY direction you need to see previous candle below Aqua Line before green arrow appear.
2- To see the earliest SELL directi

MT4のアラートインジケーターを備えたRapid 5M Scalperは、スキャルパーやデイトレーダーにとって優れた売買の迅速なシグナルツールです.
シグナルは非常に理解しやすく、メイン チャート ウィンドウに青と赤の点として表示されます。
売買シグナル: 青い矢印は買いシグナルです。 赤い矢印は売りシグナルです。 インジケーターのさまざまな設定と入力値を自由に試してみてください。
この指標は、すべての通貨ペア (メジャー、マイナー、エキゾチック) で同様に機能し、正しく使用すれば有望な結果を示します。
アラート付きの高速 5M スキャルパーの例 以下のチャートの例は、MT4 トレーディング チャートで動作中のアラート付きの Rapid 5M Scalper インジケーターを示しています。
取引のヒント: このスキャルパー インジケーターを使用して取引する場合は、お気に入りの取引エントリ、ストップ ロス、テイク プロフィット戦略を自由に使用してください。
いつものように、この指標を完全に理解するまで、最初にデモ口座で全体的な傾向と練習に同意して取引してください。
イ

MA Revolution is upgraded version of standard Moving A verage. With the current upgrade moving average line got more sensitive with different market conditions. It gets more flexible by decreasing default period step by step while market is sharp and incrasing period back to default period step by step while market is normal again. testing of the ide a shows th at this upgr aded version gives much more acur acy for detecting m arket direction, ch anges in direction are shown much e arly th an
MetaTraderマーケットは、開発者がトレーディングアプリを販売するシンプルで便利なサイトです。
プロダクトを投稿するのをお手伝いし、マーケットのためにプロダクト記載を準備する方法を説明します。マーケットのすべてのアプリは暗号化によって守られ、購入者のコンピュータでしか動作しません。違法なコピーは不可能です。
取引の機会を逃しています。
- 無料取引アプリ
- 8千を超えるシグナルをコピー
- 金融ニュースで金融マーケットを探索
新規登録
ログイン