Watch the Market tutorial videos on YouTube
How to buy а trading robot or an indicator
Run your EA on
virtual hosting
virtual hosting
Test аn indicator/trading robot before buying
Want to earn in the Market?
How to present a product for a sell-through
New Technical Indicators for MetaTrader 5 - 25

This indicator displays filtered price information in the form of three colored histograms and one common colored line. This is a very colorful and beautiful indicator. Great for determining the strength and direction of price movement. This indicator has very simple settings: 1) choice of three options for calculating the indicator: - original, - demarker, - balance volume. 2) selection of five different periods. 3) selection of the displayed color. 4) choice of accuracy. /////////////////////

Introducing the Trend Enthusiasm Indicator (TEI), the ultimate tool for maximizing profits on the trading floor. This innovative indicator combines the power of trend analysis with the excitement of market sentiment, providing traders with a unique edge in the ever-changing financial markets. The TEI uses advanced algorithms to analyze the underlying trend of a financial instrument and the enthusiasm of traders to identify high-profit opportunities. This allows traders to capitalize on the combi
UR PulseScalp MT5
A calibrated trading indicator for scalpers seeking the ultimate edge in fast-paced markets UR PulseScalp MT5 is a cutting-edge trading solution for scalpers seeking the ultimate edge in fast-paced markets. This innovative indicator is built on a scientifically-calibrated formula that blends the power of Volatility, MoneyFlow and Relative Strength to create a highly accurate and reliable signal.
Advantages of using UR PulseScalp MT5: Comfortable Interactive Panel Highly Acc

Multicurrency and multi-timeframe indicator Inside Bar (IB). In the parameters, you can specify any desired currencies and timeframes. The panel displays the last found Inside Bar (and Mother Bar) pattern, the current price position and the breakout of the levels of the Mother and Inside Bars. You can set the size and color for bars and text in the cells. The indicator can also send notifications when levels are broken. By clicking on a cell with a period, the specified symbol and period will b

TILLSON MOVING AVERAGE Also known as TMA or T3 indicator. It is a moving average that uses EMA and DEMA in its formula and is calculated with the 3rd degree Binomial expansion. ... int handle1; //Handle of the Tillson TMA T3.EX5 custom indicator double euBuff1[]; int TMAperiod= 12 ; int TMSshift= 0 ; double VolumeFactor= 0.618 ; int OnInit () { ... handle1= iCustom ( NULL , PERIOD_CURRENT , "Market\\Tillson TMA T3.EX5" ,0,TMAperiod,0,0,TMSshift,0,0,Vol
FREE

DONCHIAN CHANNEL DC It is a trend indicator developed by “Richard Donchian”, consisting of 3 layers, the upper channel, the lower channel and the middle channel. It is created on the Donchian Channel by plotting the highest and lowest prices reached in the past period on the price chart. It is also used to measure the volatility of the market, as it is an expanding/contracting channel according to the increase/decrease of price volatility. Method 0; Donchian channel indicator drawing. BUY/SELL S
FREE
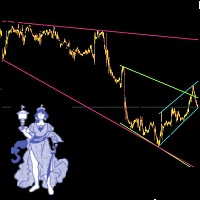
Leave a comment if you would like me to write an EA to trade these trendlines... if enough interest, will write an EA. Automatic Trendlines, updated automatically. To Set up 3 different (or mroe) Trendlines on chart, simply load the indicator as many times and name it differntly.. the example in the picture below is indicator 1 (loaded 1st time): Name: Long, StartBar: 50, BarCount: 500, Color: Pink indicator 2 (loaded 2nd time): Name: Short, StartBar: 20, BarCount: 200, Color: Green indicator 3
FREE

Crash Wizard Indicator works on 1 Minute time frame of Crash 500 and Crash 1000 ONLY. This indicator will plot a Red (x) on the Drop candle . it will plot Green arrows as BUY entry signal and will plot orange (x) as multi-exit points. You the indicator is 85% Accurate . you may use it together with Price action. NOTE: To use the indicator , make sure you have an account with Deriv the only synthetics indices broker. DONT use it on any other assets.

FRB Trader - Our mission is to provide the best support to customers through conted and tools so that they can achieve the expected results
FRB Strength - Indicator shows the current strength of the asset between buyers and sellers. - It can only be used by brokerage houses that report data on trading volumes, such as B3. In the forex market it is not possible to use.
FREE

- Times and Trades, também chamado de Time and Sales ou histórico de negócios, é uma ferramenta essencial para quem opera através do Tape Reading (Fluxo). - O Metatrader 5 não informa os dados das corretoras, sendo assim, impossível diferenciar quem enviou a ordem. - Os dados só podem ser usados por corretoras que informam os dados dos volumes de negociação, como a B3. No mercado forex não é possível usar.
FREE

To get access to MT4 version please click here . - This is the exact conversion from TradingView: "Twin Range Filter" by " colinmck ". - This is a light-load processing and non-repaint indicator. - All input options are available. - Buffers are available for processing in EAs. - You can message in private chat for further changes you need. Thanks for downloading

FRB Times and Trades Free
- Times and Trades, também chamado de Time and Sales ou histórico de negócios, é uma ferramenta essencial para quem opera através do Tape Reading (Fluxo). - O Metatrader 5 não informa os dados das corretoras, sendo assim, impossível diferenciar quem enviou a ordem. - Os dados só podem ser usados por corretoras que informam os dados dos volumes de negociação, como a B3. No mercado forex não é possível usar. VERSÃO PRO : https://www.mql5.com/pt/market/product/93726
FREE

FRB Trader - Our mission is to provide the best support to customers through conted and tools so that they can achieve the expected results
FRB Support and Resistance
- Indicator places lines on the chart to show Support and Resistance regions. - You can choose the timeframe you want to calculate, as well as the colors of the lines. - Algorithm calculates the points where the strengths of the asset are considered and are extremely important for decision making.
FREE

Able Turn indicator.
Currency pairs never rise or fall in a straight line. Their ups and downs are interspersed with rollbacks and reversals. Every rise and fall is reflected in your emotional state: hope is replaced by fear, and when it passes, hope appears again. The market uses your fear to prevent you from taking advantage of a strong position. At such moments you are most vulnerable.
Everything will change if you use the Able Turn indicator.
The Able Turn indicator was created to neu

The idea behind this indicator is to find all currency pairs that are over-bought or over-sold according to the RSI indicator at one go.
The RSI uses the default period of 14 (this can be changed in the settings) and scans all symbols to find the RSI level you will have specified. Once currency pairs that meet the specification are found, the indicator will open those charts for you incase those charts aren't open and proceed to write the full list of currencies on the experts tab.
FREE

Sniper Zones are our best kept secret for trading the forex markets profitably and extremely simple ! After years of profitable trading we are launching it to the public !
After thousands of hours of testing, we have developed an indicator that simplifies trading to the point where anyone can become a profitable trader. There exists certain zones and areas in the market that are used by institutions to move price and cause retail traders to lose their money ! We have done the hardwork and m

Your Helper is a global trend indicator. The indicator should be used on a period not less than H1, H4 and higher is recommended. Despite the apparent simplicity of the indicator, it has complex analytical algorithms inside, with the help of which the system determines the moments of entries. The indicator gives accurate and timely signals to enter and exit a trade that appear on the current candle.
The main purpose of this indicator is to determine the moments of entries and exits from trans

Get ALERTS for break of your TRENDLINES, SUPPORT LINES, RESISTANCE LINE, ANY LINE!!
1. Draw a line on the chart (Trend, support, resistance, whatever you like) and give it a name (e.g. MY EURUSD line) 2. Load the Indicator and input the Line Name the same name in Indicator INPUT so system knows the name of your line (= MY EURUSD line) 3. Get Alerts when Price breaks the line and closes Works on All Time frames and charts LEAVE A COMMENT AND IF THERE IS ENOUGH INTEREST I WILL WRITE AN EA WHICH
FREE

MACD (short for M oving A verage C onvergence/ D ivergence) is a popular trading indicator used in technical analysis of securities prices. It is designed to identify changes in the strength, direction, momentum, and duration of a trend in a security's price.
History Gerald Appel created the MACD line in the late 1970s. Thomas Aspray added the histogram feature to Appel's MACD in 1986.
The three major components and their formula 1. The MACD line: First, "PM Colored MACD" employs two

Mean Reversal Heikin Ashi Indicator calculates special trade reversal points based on Heikin Ashi candlesticks patterns. This indicator can be used on all symbols, even in Forex or B3 Brazillian Markets. You can configure just the position of each arrow. Then, after include the indicator on the graphic, pay attention on each arrow that indicates a long or short trade.

Multi-Timeframe Moving Average Indicator Provides you a simple edge. How? Let me explain.. Have you ever tried using Moving Average Strategy to trade but you find those entries too late? Have you ever tried to trade with moving averages on 1 Timeframe chart (example 4h) and when i try to lower the timeframe, moving averages change position? If you answered Yes to Both questions , This indicator is the solution for you! 1- You can visualize lower timeframes moving averages on higher timeframes ex
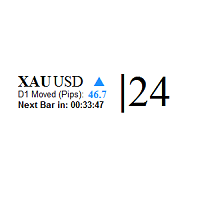
This indicator shows: The market spread Current candle time left to be closed and the pips of market movement from the beginning of the day play sound when candle is going to be closed This is an extremely useful tool for watching the spread rise and fall, allowing you to enter the market at just the right time. This indicator will help you stay out of the market when the spread begins to rise and help you get into the market as the spread begins to fall again.
very useful for day trading and
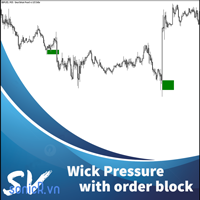
Multiple Wicks forming at OverSold & OverBought levels create Buying and Selling Pressure. This indicator tries to capture the essence of the buy and sell pressure created by those wicks. Wick pressure shows that the trend is Exhausted. Order block should display when buying or selling pressure wick. When price go inside buy order block and up to outside order block, trader should consider a buy order. If price go inside buy order block and down to outside order block, trader should consider a s
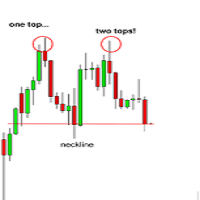
Hello all!
This is indicator 2 top and 2 bottom It will send alert to your phone when price hit top or bottom input uint InpMinHeight = 10; // Minumum Height/Depth input uint InpMaxDist = 20; // Maximum distance between the twin tops/bottoms input uint InpMinBars = 3; // Maximum number of bars after the top/bottom input string Inp_TOP_stringDOWN ="Signal Sell";// TOP: Level UP label input string Inp_BOTTOM_stringUP =
With dynamic Moving average, you can estimate the price movement, predict the next trend of price and have a better decision. Parameters setup: Period start <= Period Stop Period start >= 1
Maximum lines is 100 You can customize Moving average method: Simple averaging, Exponential averaging, Smoothed averaging, Linear-weighted averaging and price to apply: PRICE_CLOSE: Close price
PRICE_OPEN: Open price
PRICE_HIGH: The maximum price for the period
PRICE_LOW: The minimum price for the period
The Scalping Project EA follows a scalping breakout strategy. It trades the breakouts from relative highs and lows. For the entry stop orders are used for the fastest possible execution. Profits can be secured by the adjustable trailing stop. Since the strategy works with small average profits it is highly suggested to trade with a low spread and commission broker. Trading costs are crucial here! The backtests shown in the screenshots were done with the default settings. There might be better or
ONLY 3 COPIES OUT OF 10 LEFT AT $299! After that, the price will be raised to $349. IMPORTANT! Contact me immediately after the purchase to get instructions and a bonus! Advanced Fibo levels is a trading robot for the trading on forex. This is a Fibonacci system that designed to trade for most popular Fibonacci strategy that's completely automated. Warning:
I only sell EA's through MQL5.com. If someone contacts you saying it is me trying to sell you something, they are a Scammer. Block and rep

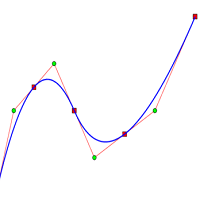
Fit line supports to extrapolation next movement of market, support for buy/sell decision. Indicator using spline algorithm to extrapolation. You can change number of spline with parameter "PointsNumber" and number of extrapolation point with "ExtrapolateBars". Eextrapolation points will be save into csv format, with prefix in parameter "PointsPrefix", and store in folder File of Data Folder.
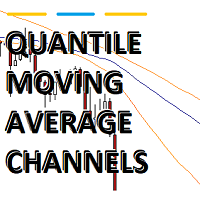
Quantile Moving Average Channels "KNOW WHERE OTHER MARKET PARTICIPANTS ACT"
General See where zones of interest exist with quantile MA channels. It plots three lines on the main chart: two outer lines and a mid line.
Most of all commonly used moving averages are between the upper and the lower band, if the input parameters are chosen properly.
This means that if the channel is relatively small, other market participants that rely on moving averages may act if the price action is near the mi

ICT, SMC, SMART MONEY CONCEPTS, SMART MONEY, Smart Money Concept, Support and Resistance, Trend Analysis, Price Action, Market Structure, Order Blocks, BOS/CHoCH, Breaker Blocks , Momentum Shift, Supply&Demand Zone/Order Blocks , Strong Imbalance, HH/LL/HL/LH, Fair Value Gap, FVG, Premium & Discount Zones, Fibonacci Retracement, OTE, Buy Side Liquidity, Sell Side Liquidity, BSL/SSL Taken, Equal Highs & Lows, MTF Dashboard, Multiple Time Frame, BigBar, HTF OB, HTF Market Structure,

MT4 version | FAQ The Owl Smart Levels Indicator is a complete trading system within the one indicator that includes such popular market analysis tools as Bill Williams' advanced fractals , Valable ZigZag which builds the correct wave structure of the market, and Fibonacci levels which mark the exact levels of entry into the market and places to take profits. Detailed description of the strategy Instructions for working with the indicator Advisor-assistant in trading Owl Helper Private User

MT4 version | Trend Monitor VZ Indicator | Owl Smart Levels Indicator | Owl Smart Levels Strategy | FAQ Elliott wave theory is an interpretation of processes in financial markets that relies on a visual model of waves on price charts. The Valable ZigZag indicator displays the wave structure of the market, which can be used to make trading decisions. The Valable ZigZag indicator is more stable and does not often change its direction like the classic ZigZag indicator, misleading traders.
FREE

MT4 version | Owl Smart Levels Indicator | Owl Smart Levels Strategy | FAQ
The Fractals Indicator is one of the elements of the author's trading strategy of Bill Williams . It is used to search for price reversal points on the price chart and, consequently, support and resistance levels. The Full Fractals Indicator is an improved Fractals which is available in the toolkit of almost all trading terminals. Its only difference is that to build a fractal we use 5 candles to the left
FREE

Welcome to RSI Colored Candles, an innovative indicator designed to enhance your trading experience by integrating the Relative Strength Index (RSI) directly onto your price chart. Unlike traditional RSI indicators, RSI Colored Candles utilizes a four-color scheme to represent RSI levels directly on your candlesticks, providing you with valuable insights at a glance. Features and Benefits: Space-saving Design: Say goodbye to cluttered indicator windows! RSI Colored Candles saves valuable chart
FREE

The KPL Swing indicator is a simple trend following mechanical trading system which automates the entry and exit. The system works with a hard stoploss and a trailing stoploss for exit with profitable trades. No targets are given as no one knows how high (or low) a Price can move. A trailing stoploss locks in the gains and removes emotions from trading. Convert from indicator Amibroker with modified Perfect if combining with KPL Chart Uptrend & Downtrend
FREE

This indicator can identify more than 60 candlestick patterns on the chart, including their bullish and bearish variants. Just choose the pattern you want in the settings.
Available Patterns 2 Crows Gravestone Doji On Neck 3 Black Crows Hammer Piercing 3 Inside Hanging Man Rick Shawman 3 Line Strike Harami Rising and Falling Three Method 3 Outside Harami Cross Separating Lines 3 Stars in South High Wave Shooting Star 3 White Soldiers Hikkake Short Line Abandoned Baby Hikkake Modified Spinning

UR Bands MT5
(with a Formula used in Machine Learning systems) UR Bands MT5 is a n indicator derived through a formula that incorporates market volatility is similar in principle to those used in machine learning systems. This mathematical representation of market conditions offers a precise analysis of price trends and dynamics, taking into account the inherent volatility of financial markets. By incorporating volatility as a variable, the indicator provides a more accurate and dependable re

FRB Agression Opposite Candle
This indicator shows when the candle has opposite direction to the aggression balance of the same period. Not intended to be used in the Forex market. Only use markets that have volume and aggression information, such as B3 (Brazil)
Settings Color - Define the color that will be shown for the candle ( Color 1 - When the candle is positive and the balance of aggression is negative / Color 2 - When the candle is negative and the balance of aggression is positive )
FREE

FRB Candle Time
Indicator showing the time left for the next candle You can edit font color and size. Very important indicator for Traders. To move time, just click on it and move the mouse to where you want to leave it. After positioning the time where you want it, click again or press "ESC" and the time will stay where you left it.
Settings font color Font size Background color
FREE

FRB Trader - Time Indicator that shows the server's time of operation.
You can edit the font color and size of the timetable.
Settings
Font color
Font size
Background color
To move the Timetable, just click on it and move the mouse to where you want to leave it. After placing the Time where you want it, click again or press "ESC" and the time will stay where you left it.
FREE

After working during many months, with the help of Neural Networks, we have perfected the ultimate tool you are going to need for identifying key price levels (Supports and Resistances) and Supply and Demand zones. Perfectly suitable to trigger your trades, set up your future actions, decide your Take Profit and Stop Loss levels, and confirm the market direction. Price will always move between those levels, bouncing or breaking; from one zone to another, all the remaining movements are just mark

Pivot Point Supertrend (corresponds to Pivot Point Super Trend indicator from Trading View) Pivot Point Period: Pivot point defined as highest high and highest low... input 2 = defining highest high and highest low with 2 bars on each side which are lower (for highest high) and are higher (for lowest low calculation) ATR Length : the ATR calculation is based on 10 periods ATR Factor: ATR multiplied by 3
FREE

The Double Stochastic RSI Indicator is a momentum indicator which is based on the Stochastic Oscillator and the Relative Strength Index (RSI). It is used help traders identify overbought and oversold markets as well as its potential reversal signals. This indicator is an oscillator type of technical indicator which plots a line that oscillates within the range of zero to 100. It also has markers at levels 20 and 80 represented by a dashed line. The area below 20 represents the oversold area, wh

Macd diverge! It is a macd indicator where it goes with the divergence indicator and arrows that mark the sale and purchase of the pair! It is very easy to use and at first glance you can see that you don't have to do a lot of analysis since the divergence marks the sail too! It can be used in all seasons! It is used for scalping! works for forex markets for crypto and synthetic index markets too! Good profit! World Investor.

filling It is an oscillator indicator, where it clearly marks sale and purchase, It has two colors, red and blue. red marks you buy, and blue marks you for sale, ideal for scalping and lengths! works for forex markets works for synthetic index markets ideal for volatility and jumps! It also works for crash and boom! walk in all temporalities! Good profit! World Investor.

macd rsi It is a macd indicator added to the rsi to capture perfect entries in the average crossovers! As seen in the indicator, it has 2 lines, one of gold color and the other violet line, where the cross of the violet with the gold downwards is a sell signal when it crosses the violet up from the gold it is a buy signal! very good to make shorts works for forex markets and synthetic indices It is used in any temporality! Good profit! World Investor.

The concept of Harmonic Patterns was established by H.M. Gartley in 1932. Harmonic Patterns create by 4 peak (ABCD) or 5 peak (XABCD). In traditional, we have BAT pattern, Gartley pattern, butterfly pattern, crab pattern, deep crab pattern, shark pattern. Each pattern has its own set of fibonacci. In this indicator, we add more extended pattern named ZUP pattern. So we have total 37 pattern as follow This indicator detects all above patterns, takes fibonacci projections as seriously as you do,

Extreme indicator! is an oscillator that works with candle volume levels, where it consists of red and green colors, where you measure the sale and purchase! where it also comes with a line crossing format where it reconfirms the purchase or sale on this occasion, works for forex markets and for the synthetic index markets ! It works for all seasons! Good profit! World Investor.

Color range ! It is an indicator that indicates the volume of the candle giving you input or output depending on the color you touch on the candle! It works perfect for making H1 or H4 lengths! It also works for scalping but ideal for long! works at any time works for forex markets for synthetic index markets !!! also for crypto. Good profit!!!!!! World Investor.

extend ! is an oscillator indicator, Where you measure bullish and bearish trends ideal for scalping and lengths! The strategy consists of the crossing of lines, where it has 2 types of lines, one blue and one green! where the blue line crosses over the green line gives entry signal, where the green line crosses below the blue line gives a sell signal! It works for all seasons! Good profit! World Investor.

Swing Line! It is an indicator that easily captures a trend channel, be it bullish or bearish! being able to easily hunt the rebounds, long and short, as well as rebound support and resistance of the channel! The indicator is suitable for any temporality! very good for scalping and long! works for forex markets and synthetic indices also crypto! good profit World Investor .

Trendline! trend line indicator, support and resistance, ideal for hunting long and short! where it uses 2 lines, the red and the blue, the red one marks rebounds for sales, the blue one marks you rebounds for purchase And not only that, but it also marks you, the uptrend and downtrend. works for any season works for forex markets and synthetic indices! also crypto. Good profit! World Investor.

Stellar volume. is an oscillator, indicating the high ranges and the low ranges. marking the ceiling and floor of each trend on the oscillator, where the violet line crosses the gray line gives a purchase entry, where the violet line crosses the red line downwards gives a sell signal, very easy to use and very simple, works for forex markets and synthetic indices! and for any temporality to operate. Good profit! World Investor.

Ma Distance Parabolic! is a moving average indicator with parabolic sar ! ideal for hunting trends where there are two ideal points showing input there are 2 points where there are blue points that mark the rise and the other green point where it marks the drop The indicator gives you the entry signal when it gives the second point the position is taken. suitable for forex and synthetic indices, also crypto! Good profit! World Investor.

Zigzag Oscillator. it is an indicator programmed to hunt each point of the zigzag of the candle! as in the foreground of zigzag this oscillator takes you to simple measurements, to catch every bounce from floor to ceiling! Ideal for scalping and intraday. works for any season! for all forex pairs! for all pairs of synthetic indices ideal for volatility 75 and other jumps! Good profit! World Investor.

Oscillator Moving ! is an oscillator where it has 3 input points where is the orange line, the red line and the blue line where the orange line touches the ceiling of the blue line, it gives a buy entry signal. where the red line crosses the blue line gives a sell signal! very clear to see and very simple to use! It can be used at any time! can be used in Forex markets. In the synthetic and crypto index markets! good profit World Investor.

High Low Expert! It is an indicator where it marks the high and lows in the short and long term works like demand and supply and support and resistance too Ideal for scalping in M1, it also works for longs in H1 or H4! works for all temporalities, works for forex markets and for the synthetic index markets ! ideal for volatility pairs and jumps It also goes in crypto! good profit World Investor.

Bear Bull! It is an indicator that marks with Heikin Ashi candles but modified, the sales and purchases long and short trend! with 2 colors green marks the purchase, purple marks the sale, works for any type of temporality, works for forex markets and synthetic indices! ideal for any pair, it also works for crypto pairs, Good profit! World Investor - World Inversor -

Crash Scalper sign! is a programmed flag %100 for the crash , where it has the scalping function in M1 where it sends you input signals with the blue arrow and exit signs with the arrow board, Its principle is scalping from 2 to long candlestick trends, the exit arrow will always mark you, sending you a signal message, It also has a message for email and cell phone message where it sends you the signals! It works for all seasons! Good profit! World Investor.

Boom Scalper! is a programmed flag %100 for the Boom index, can be used on the boom 1000, 500 and 300 works for scalping M1 and longs at any time frame always sending you the signal with a purchase message and the sign where it is sold, It has the system to send email as a signal and message as signal In case you are not on your desktop PC so you do not miss any signal! Good profit! World Investor.

The DR IDR Range Indicator PRO plots ADR, ODR and RDR ranges for a given amount of days in the past. A key feature that appears is that it calculates the success rate of the ranges for the shown days. This indicator is perfect for backtest since it shows ranges for all of the calculated days, not just the most recent sessions. In the PRO version you can now: use fully customizable advanced statistics to base your trades on get an edge via calculating statistics on up to 3 different day period
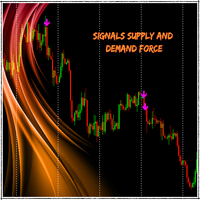
Este Indicador esta basado en el rebote de un soporte o resistencia fuerte con un indicador que tiene interno de fuerza de movimiento. Tiene la opción de ver el soporte y resistencia actual y ver la fuerza que tiene dicho soporte o resistencia.(Activando el parámetro Ver_Sop_Res ) Parámetros: Sop o Res, Fuerza Mayor a...: Con este parámetro podrás ajustar la fuerza del soporte o resistencia, con la cual el indicador evaluara si es una señal bajista o alcista. Velas Historial: Con este parámetro
Volatility Crusher Indicator is a Non-Lag MT5 indicator which detect trades on any time frame. The indicator has alerts to buy and sell once a trade has been detected. It will also send pop-up signal to your mobile phone and you can trade anywhere you are with your phone while its generating signals for you on PC connected to VPS. Its recommended on m5 to h4 time frame on any pair on Deriv MT5 Broker. Pairs recommended: Volatility Index 10, Volatility Index 25, Volatility Index 100 Volatility I

Recommended broker to use the indicator: https://tinyurl.com/5ftaha7c Indicator developed by Diogo Sawitzki Cansi to show possible trade points. Do not repaint. The results displayed in the past are exactly what happened. We also use it to hold trades longer and not get out on false reversal signals which are actually just a profit taking of trades and no one is trying to reverse the direction of the trend. Indicator Parameters: PERIOD: Period for analyzing the buying or selling force to fin
FREE

For MT4 version please send private message. - This is the exact conversion from TradingView source: "Hurst Cycle Channel Clone Oscillator" By "LazyBear". - For bar color option please send private message.
- This is a non-repaint and light processing load indicator. - Buffers and inputs are available for use in EAs and optimization purposes. - You can message in private chat for further changes you need.
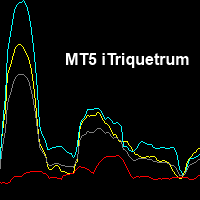
Индикатор показывает отклонения корреляции трех валютных пар, после резкой волатильности пар возвращает их к состоянию сбалансированости Выбор периода отклонения даст возможность наблюдать за более длительными отклонениями Цветные линии хорошо помогают распознать на какой валютной паре произошло отклонение цены, можно наблюдать как резко уходят цены по всем парам, и возвращаются к своему среднему значению
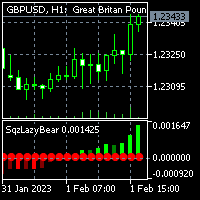
For MT4 version please click here . - This is the exact conversion from TradingView source: "Squeeze Momentum Indicator" By "LazyBear". - This is a non-repaint and light processing load indicator. - Buffers and inputs are available for use in EAs and optimization purposes. - You can message in private chat for further changes you need.
Thanks for downloading...

UR Vortex MT5
The Probabilistic UR Vortex Formula: An Accurate System for Predictive Market Analysis using Volatility and Standard Deviation Calculations. The UR Vortex MT5 indicator is a technical analysis tool that uses volatility and standard deviation calculations to predict potential tops and bottoms in a market. It measures the strength of a trend by calculating the distance between the current price and a moving average, and then standardizing this distance by dividing it by the average
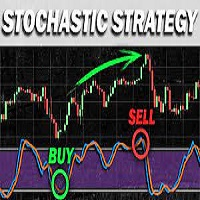
Stochastic cross alert signal overlay is indicator show signal buy and sell you can attach it easy in your chart mt5, it work all time frame it work all time frame Setting: input int KPeriod=5; input int DPeriod=3; input int Slowing=3; input ENUM_MA_METHOD MA_Method=MODE_SMA; Contact me immediately after the purchase to get the settings and a personal bonus!

Previous Period High Low . This indicator shows the previous Day, Week, Month and Years High and Low. It's great for price action strategies. : Provides clear and visible breaks in structure. : Easy to see breakout levels. : Easy to see gaps between previous high, low levels after breakouts have occurred. The indicator works on every time frame. Multiple periods can be selected and be seen on the same chart. Every line can be customized to Your liking. Color, style and thickness. Enjoy!
The MetaTrader Market is the only store where you can download a free demo trading robot for testing and optimization using historical data.
Read the application overview and reviews from other customers, download it right to your terminal and test a trading robot before you buy. Only on the MetaTrader Market you can test an application absolutely free of charge.
You are missing trading opportunities:
- Free trading apps
- Over 8,000 signals for copying
- Economic news for exploring financial markets
Registration
Log in
If you do not have an account, please register
Allow the use of cookies to log in to the MQL5.com website.
Please enable the necessary setting in your browser, otherwise you will not be able to log in.