MetaTrader 5용 Expert Advisor 및 지표 - 43

Volume Horizon is a horizontal volume indicator that allows you to observe the density of market participants' volumes across various price and time intervals. Volume histograms can be constructed based on ascending or descending market waves, as well as individual bars. This tool enables more precise determination of entry or exit points, relying on levels of maximum volumes or volume-weighted average prices (VWAP).
What makes Volume Horizon unique? 1. Segmentation into ascending and descendi

Long & Short Based on Cointegration Statistical and Quantitative Long-Short (Pair Trading) approach for long and short positions. Your CPU will always be safe and stable when using Multiple Linear Regression if you have a reliable indicator. Based on the results of this indicator, you can execute a long and short or a long and long/short and short trade between two separate assets. It can show you a Highly informative dashboard based on Cointegration Search you determine, with all statistical d

This panel brings convenient functionality - Virtual Stop Loss and Take Profit levels .
Peculiarities This panel allows to hide the Stop Loss and Take Profi t levels of your trades. The panel stores these levels in memory . When the market price reached one of the levels, a trade is closed and terminal generates a message indicating that a virtual level was triggered. there are 4 options for setting Stop Loss: Fixed Stop Loss - fixed Stop Loss Trailing Stop Loss - classic Trailing Stop Loss.

GM Bounty Hunter MT5 is a fully automated/semi-automatic, The robot trades according to the overbought and oversold levels of the market. The EA's unique trading strategy has a high probability of winning. GM Bounty Hunter MT5 is optimized for use with low spread currency pairs. Info:
Working symbol XAUUSD, EURUSD, GBPUSD, USDJPY,.... Working Timeframe: M1, .....(The larger the timeframe, the more stable the signal) Min deposit $125 with Stop Loss settings (or equivalent in cents ) The minimum

Quant PRO is a professional automatic trading system designed and optimized for the MT5 platform and multi currency pair. Uses genetic optimizations and all its settings are adjusted on an ongoing basis to this it does not require optimization, During its operation all parameters are adjusted to current trends and market volatility. EA automatically selects the currency pairs it works on, You only need to run them on AUDCAD symbol and you don't have to adjust anything. Tested in sample and in o

The Cipher Hybrid-HFT Gold Trader: The Power of Probability Theory and Price Action Principles
The vast majority of technical indicators are the same age as dinosaurs. Also, many retail traders are not aware of this fact: most technical indicators are developed for the stock market - not for the forex and not for the metals market. The apparent fact that you can not achieve consistent success in the metal market with old technical indicator theories and with the tools developed for stock market

TransitGhost Signal indicator, this is one of my best forex trading strategy. The strategy is based on the simple moving average cross, 5 SMA AND 200 SMA of which take a longer time to cross. Whenever the is a cross between the 5 SMA and 200 SMA a signal will be given, when the 5 SMA cross the 200 SMA to the upside ,a buying arrow will appear on chart, and push notification(alert) "Buy now, use proper risk management" will be sent on both the MT5 PC and mobile app, and when the 5 SMA cross the 2
FREE

Wura 2.set file in comment TimeFrame: M15 Wura , a fully automated Expert Advisor (EA) designed for trading Gold (XAUUSD) on the M15 timeframe. Named after the Yoruba word for "Gold, " this EA is meticulously crafted to capitalize on the precious metal's market dynamics. Key Features: High Win Rate: Wura boasts a remarkable win rate of over 80% for both buy and sell trades, demonstrating its consistent profitability. Minimal Drawdown: Since December 25, 2023, Wura has maintained a drawdown of l

Welcome to the Golden Sunrise Expert Advisor!!! The Latest Gold Expert with Advanced Trading Strategies Introducing the Golden Sunrise Expert Advisor!!! The latest gold expert featuring a new strategy , new signals , and designed for more trades than previous experts. This is a fully automated expert system engineered to have a higher profit-to-loss ratio average per trade while aiming for as many trades as possible . The EA will open up to 8 limit trades off of one signal in a grid pattern s

The TMA Centered Bands Indicator for MT5 draws bands on the chart and shows the overall price trend. It displays three bands - the lower and upper boundaries of the channel and the median. The bands are made up of moving averages, and each of them has an MA period. The name TMA comes from triangular moving averages, as the indicator draws triangular bands. The price will fluctuate between these ranges whenever the trend changes direction, thus creating entry and exit points. How to trade
FREE

This indicator is a straight port of a well known MetaTrader 4 indicator that is freely available on the Internet. It does not redraw at all. It implements a type of breakout strategy. The arrows indicate market direction. Use the indicator on M15 charts and higher. The indicator draws two bands near price action and generates signals when the price closes below the lower band and also above the upper band. The indicator uses periodic highs and lows to calculate upper and lower threshold bands.
FREE

A very useful Price Action point is the previous day Closing VWAP. We call it Big Players Last Fight . This indicator will draw a line showing on your chart what was the last VWAP price of the previous trading session. Simple and effective. As an additional bonus, this indicator saves the VWAP value on the Public Terminal Variables, so you EA could read easily its value! Just for the "Prefix + Symbol name" on the variables list and you will see!
SETTINGS How many past days back do you want to s
FREE

One of the best trend indicators available to the public. Trend is your friend. Works on any pair, index, commodities, and cryptocurrency Correct trend lines Multiple confirmation lines Bollinger Bands trend confirmation Trend reversal prediction Trailing stop loss lines Scalping mini trends Signals Alerts and Notifications Highly flexible Easy settings Let me know in the reviews section what you think about it and if there are any features missing.
Tips: Your confirmation line will predict tre
FREE
Level Box Tool is a powerful and user-friendly custom indicator designed for traders who utilize technical analysis tools like rectangles and trend lines to identify key support, resistance, and price zones. This tool simplifies and speeds up the process of marking chart levels, offering both visual clarity and precision with its fully customizable panel, and now includes price-cross alerts — so you’ll never miss a key level again. MT4 Version - https://www.mql5.com/en/market/product/136009/ Jo
FREE

This indicator is designed to help traders to help them Synchronize objects across all charts that have the same pair/currency.
Applicable objects: -Rectangle
-Trendlines
-Trendlines by Angle
-Horizontal Lines
-Vertical Lines
-Arrow Lines
-Channels
Known Issues : - Visualization is not copied to the other charts. - If indicator is only placed in one chart, other charts with the same pair/currency will have difficulty deleting the objects if there is not Sync Objects In Charts indicator in it.
FREE

When trading price action or using price action triggers such as Pbars, Inside Bars, Shaved Bars, etc. it is important to always wait for the bar/candle to close more than anything else.It is often the case (whether it’s the 4H, hourly, etc) that price action will be dominant in one direction for the majority of the candle only to reverse strongly at the end of the candle. Institutional traders know retail traders are less disciplined than they are. They know a good trading candle pattern coul
FREE

Mine Farm is one of the most classic and time-tested scalping strategies based on the breakdown of strong price levels.
Mine Farm is the author's modification of the system for determining entry and exit points into the market...
Mine Farm - is the combination of great potential with reliability and safety.
Why Mine Farm?!
- each order has a short dynamic Stop Loss
- the advisor does not use any risky methods (averaging, martingale, grid, locking, etc.)
- the advisor tries to get the most

Neuron Net DJIA is an integration of the Python programming language, deep learning machine and mql5 code to be able to predict Dow Jones Industrial Index(DJIA) price movements so as to produce entries and exits based on artificial intelligence.
Setfile Why Neuron Net DJIA ? + Neuron Net DJIA has been through the research and development stage for almost 1 year, and has passed the testing phase on demo accounts and real accounts. + Neuron Net DJIA d oes not use martingale
SET UP

"Introducing our cutting-edge Trading Expert Advisor Robot: A culmination of advanced algorithms and meticulous analysis, designed to navigate the dynamic landscape of financial markets with precision and proficiency.
Our Expert Advisor Robot is meticulously crafted to empower traders with unparalleled efficiency and insight. Leveraging sophisticated trading strategies and real-time data analysis, it operates seamlessly across various asset classes, including stocks, forex, commodities, and cr

Este Expert Advisor (EA) ha sido diseñado para operar en índices sintéticos y Forex. El EA automatiza las entradas mediante órdenes buystop y sellstop , asegurando un posicionamiento estratégico en momentos clave del mercado. Las salidas se gestionan en función del vencimiento de las velas y otras condiciones basadas en indicadores técnicos, lo que permite una gestión flexible y adaptable a las condiciones cambiantes del mercado. Los niveles de Take Profit (TP) y Stop Loss (SL) se calculan de fo

EMA Scalper Indicator is an indicator of EMA lines and reversal EMA lines. Each pair of EMA channels area that can be used to make reversal entry. After the EMA lines are widening because of major trend, the area can be used to find profitable entry and exit, especially after EMA reversal. Do the cut loss whenever candle closed outside the area.
The A, B, C, D, and E area are colored differently. Solid lines: Normal EMA lines. Dashed lines: Reversal EMA lines.

This cluster indicator is MT5 version of SuperIndices for MT4. It allows for processing mixed clusters, where symbols from various markets can be included. For example, it can handle Forex, indices, CFDs, spot at the same time. Number of visible lines increased to 16. An interactive ruler can be enabled to measure signals' strength on the history. The indicator creates a set of embedded cluster indicators (CCFpExtraIndices) with carefully selected periods and combines their results using smart w

Utilise our advanced Trading Robot to hasten your journey to become a funded trader. This Expert Advisor (EA) is your ticket to quicker funding because it is made to pass prop firm challenges in as few as two trading days (if both are profitable). What distinguishes it is as follows:
Optimised for Quick Challenge Completion: Our robot strives to pass evaluations quickly, enabling you to get financed more quickly. It uses a strategy designed to reach the 1:2 profit ratio. Strategic Trading Durin

Introducing: The Silver Bullet Pro Trade with Precision, Prosper with Power! Experience next-gen financial tech with the Silver Bullet Pro Trading Robot, inspired by the famed ICT Silver Bullet Strategy. Trade in the markets with an strategy tester over 10 years. Highlights: Optimized Performance : Harness the strength of the ICT Silver Bullet Strategy, known for its razor-sharp precision and unparalleled accuracy. Automated Excellence : Say goodbye to hours of screen time! Silver Bullet Pro ens

외환 시장에서의 궁극적인 동반자입니다. GBP 거래 쌍에만 집중하여, QuadroFX는 시장의 복잡성을 탐색하기 위해 최적의 시간대인 M15 의 힘을 활용합니다. 시장 움직임과 패턴의 복잡성을 깊이 파고드는 레인지 거래를 시작하도록 세심하게 설계되었습니다. QuadroFX 전략: 정확한 세부 정보를 공유할 수는 없지만, 기본적인 내용은 다음과 같습니다: QuadroFX는 MACD 다이버전스를 활용하여 가격이 MACD 지표의 반대 방향으로 움직일 때를 식별하여 잠재적인 반전을 알립니다. 이 고급 분석은 EA가 시장의 주요 전환점을 정확하게 포착하도록 하여 거래 집행의 정확성을 보장합니다. 20년 이상의 역사적 데이터를 통해, 희귀한 패턴(캔들 패턴 및 독창적인 지표 모두)을 결합하여 각 거래에 대한 최적의 결정을 내립니다.
매뉴얼 블로그로 가는 링크: https://www.mql5.com/en/blogs/post/757126
기호
GBPAUD,GBPNZD,GBPCHF,GBPUSD,

Pips Harvester This expert is the result of hard work and tests for a whole year and an extraordinary study of the most successful models. It is the next generation type that uses a very complex method to open and identify trades. It completely works on only one pair, which is the currency pair of the Australian dollar and the New Zealand dollar. It contains very complex codes that have been prepared. It was formulated and tested for more than a full year, and it is the best expert I have create

Only 1 copies at the price of 99 USD. Last price 999 USD EURUSD ecn - is a trading algorithm designed for trading on ecn accounts or any other accounts with small margins and small spread!
EURUSD ecn trading strategy is based on historical axioms of breaking the daily price range.
Why EURUSD ecn belongs to safe trading systems?! - each order has a short fixed Stop Loss
- the EA will not open an order if the trading account conditions do not match the recommendations (if orders are not opene

The Quantix EA is built on a robust trading strategy, designed to optimize trading performance through precise entry and exit points. It leverages a combination of multiple technical indicators to identify potential market movements, ensuring that each trade is backed by solid market data.
What sets this EA apart is its integration of Artificial Intelligence (AI) for trade confirmation. The AI analyzes historical and real-time market data to provide an additional layer of decision-making, enha

Only 2 copies at a price of 99 USD. Next price 149 USD
Pro Trade is a syndicator-free, fully automated scalping trading algorithm. The core of the trading strategy is based on one of the most ancient and reliable patterns, based on the basic axioms of the Forex market - it is a strategy of breaking through strong price zones. Price zones are formed and tracked on different TimeFrames, which increases the number of received signals and their accuracy. Always after opening an order, a short dynam

Future of BitCoin Scalper No.1:
We make this Ea on scalping strategy for short term trend. Ea is able to best works on BTCUSD pair. Current trend of BitCoin and current volatility of BTCUSD pair is most suitable to this scalping ea. We provide you full support to setup ea on chart. Contact us by sending massage in mql5 chat for Ea setups. We also stored our set files in comment area for easy use for you.This Ea's Mt4 version is also available in Mt4 expert area.(Comming Soon) Using of Ea: Indic

This version is a basic iteration, click the link below to access the full version: https://www.mql5.com/en/market/product/110060 "ICT, short for Inner Cycle Trade, revolutionizes your Forex trading experience by focusing on the intricacies of inner market dynamics. Built upon the principle of understanding and capitalizing on short-term market fluctuations, ICT utilizes advanced AI algorithms to provide traders with real-time insights into emerging opportunities within the Forex market. By com
FREE

Description This is an indicator for MT5 which has enhanced the "Fractals" indicator. "Fractals" indicator is included in MT5 by default but the draw line period is fixed at "5" and it cannot be modified. Thus I have reinvented the Fractals indicator with some useful function added. This tool will be useful especially for those who are learning how to draw good horizontal lines and wants to get some reference. Of course, those who are considering Fractals as an important horizontal line wil
FREE

Viking_Strategy_Signal Indicator is a solution I offer to beginner, amateur, and professional traders. My scalping robot : https://www.mql5.com/fr/market/product/133191 By purchasing this indicator, you will first save time because it automatically analyzes the market based on Dow Theory and the Smart Money Concept (High (H), Low (L), Higher High (HH), Lower Low (LL), Break of Structure (BOS) to determine market structure and trend). It is built on my strategy, which relies on the NRTR theory t

Investment Castle Support and Resistance Indicator has the following features: 1. Dictates the direction of Buy or Sell trades based on Support and Resistance Levels automatically . 2. Candles stick colors will change to Red for Sell and Blue for Buy (Default settings, user can change from the inputs). 3. This indicator is built-in the Support & Resistance based Investment Castle EA which works with Psychological Key Levels "Support & Resistance".
FREE

This universal advisor is based on its own Algorithm, which is an incredibly effective tool due to the simultaneous operation of a trading strategy based on our Indicator " Channel Sgnals ProfRoboTrading" and our proprietary signal filter system together with the Martingale method, which together work out a very interesting hedging system. Traders are also given the opportunity to set up their own risk management system with two filters to control deposit drawdowns . The advisor's algorithm is

Monster Harmonics Indicator is a harmonic pattern indicator. It recognizes Gartley, Bat, Crab, Butterfly, Cypher, White Swan, Black Swan, Shark and AB=CD patterns. Projected patterns that are not yet completed are recognized, too. Monster even shows the PRZ (Potential Reversal Zone). Users can add their own user defined patterns to Monster. Besides the current pattern, Monster also shows all patterns in the symbols history. Monster will provide alerts for developing patterns. Introduced by H.M.

The Price Action Finder indicator is an indicator of entry points, which is designed to search and display patterns of the Price Action system on a price chart. The indicator is equipped with a system of trend filters, as well as a system of alerts and push notifications. Manual (Be sure to read before purchasing) | Version for MT4 Advantages
1. Patterns: Pin bar, Outside bar, Inside bar, PPR, Power bar, Hanging man, Inverted hammer 2. Pattern filtering system. Removes countertrend patterns from

Description: The Range Breakout Catcher Indicator is a powerful tool known for its non-repainting, non-redrawing, and non-lagging capabilities, making it suitable for both manual and robot trading. This indicator utilizes a smart algorithm to calculate ranges and generate early signals for Buy and Sell positions at the breakout of these ranges, facilitating the capture of trends during ranging consolidations. The range calculation involves a comprehensive system based on various elements, prov

Introduction Harmonic Patterns are best used to predict potential turning point. Traditionally, Harmonic Pattern was identified manually connecting peaks and troughs points in the chart. Manual harmonic pattern detection is painfully tedious and not suitable for everyone. You are often exposed under subjective pattern identification with manual pattern detection. To avoid these limitations, Harmonic Pattern Plus was designed to automate your harmonic pattern detection process. The functionality

It is the very same classic Stochastic indicator, but with a little twist: we changed the Signal Line with a 2-color line, so we can use it with EAs as a filtering system. And that's it! I know it could seem stupid but I needed that, so I created it. The original formula is right from Metaquote's chest, no additions, no subtractions, it is Stochastics in its core.
So I will not publish here the Stochastics parameters as they are all the same as always... Enjoy!
If you like this indicator, all I
FREE

This all-in-one indicator displays real-time market structure (internal & swing BOS / CHoCH), order blocks, premium & discount zones, equal highs & lows, and much more...allowing traders to automatically mark up their charts with widely used price action methodologies. Following the release of our Fair Value Gap script, we received numerous requests from our community to release more features in the same category. "Smart Money Concepts" (SMC) is a fairly new yet widely used term amongst price a
This is an indicator to assist a trader on trend detection of any market. This indicator is made up of a blend of moving averages for trend detection. I know no indicator is 100% accurate , but this might help you. I'm giving it for free and also , there are important settings on the last screenshot. This indicator should be on a separate window after you set it up on the chart.
FREE

이 지표는 전일, 주, 월의 최고 및 최저 가격을 보여줍니다. 극한 지점의 돌파를 식별하고 거래 진입 방향을 결정하도록 설계되었습니다. 반전 수준을 보다 정확하게 결정하기 위해 피보나치 수준을 표시할 수 있습니다. 또한 이전 청구 기간 동안의 가격 변동을 보다 명확하게 보여주기 위해 최고 가격과 최저 가격 사이의 공간에 표시할 수도 있습니다. 현재 캔들(바)이 닫힐 때까지의 시간을 나타냅니다.
버전 2.0에는 3가지 새로운 지그재그 반전 신호 레벨이 추가되었으며 각 레벨에 대한 경보를 제공합니다. This indicator shows the maximum and minimum prices of the previous day, week and month. Designed to identify breakouts of extreme points and determine the direction of entry into a trade. To more accurately determine

Free for now, price is going to be 30 USD at Jan 1. 2025.
Features: Pin Bar Detection : The indicator is designed to identify bullish and bearish pin bars based on specific criteria, including the relative size of the candle’s body and shadow, as well as the position of the candle's body in relation to the 38.2% Fibonacci level. Customizable Labels : Custom text is displayed above each identified bullish or bearish pin bar, such as "[38.2]" for bullish and "[-38.2]" for bearish, helping traders
FREE

The Friday Gold Rush trading advisor for MetaTrader 5 implements a very simple and effective strategy used by Andre Stagge .
On the ForexFactory forum, I found a post with an elementary gold trading strategy: • Buy gold on Thursday and sell it on Friday. • This basic strategy has shown an advantage over simply holding gold in 2024. The advisor does not use Take Profit because the closing occurs forcibly at a specific time. Stop Loss can be set optionally or based on test results. Inputs 1. ENTE
FREE

Советник для скальпирования фьючерса BR на ММВБ. Внутридневный, в 23=45 закроет позицию. Работает на 15-ти минутках. По появлению отфильтрованного индикаторами сигнала на покупку/продажу выставляет отложенный ордер. Более короткий вариант таймфрейма выбирать не рекомендую из-за введенных ограничений для переменных в примененных индикаторов. Мартингейл не применён, EA тестирован на ММВБ на срочном рынке и только на фьючерсах BR. Для демонстрации результатов на склейке, параметры дооптимизир
FREE
The uniqueness of this expert is that he uses one common set. for most Expert Advisors, this is not applicable and will not work because most Expert Advisors have either sets that you can download yourself or embedded in the code for each currency pair. This Expert Advisor uses only 1 set for all 20 currency pairs.
I differ from many developers in that I continue. improve your products. The main goal is to make such products that users will be satisfied with. You can always write to me and

VWAP Bands 3 Camadas – Indicador para MetaTrader 5 O VWAP Bands 3 Camadas é um indicador avançado para MetaTrader 5 que combina o Volume Weighted Average Price (VWAP) com bandas de desvio padrão, proporcionando uma visão clara dos níveis de suporte e resistência dinâmicos no mercado. Principais Características: VWAP Dinâmico – Média ponderada pelo volume, ajustando-se ao comportamento do mercado.
3 Camadas de Bandas – Bandas baseadas em desvios padrão (+1, +2 e +3), ajudando a identifica
FREE

Macd Divergence with Smoothed Moving Averages. Divergence must occur when the moving averages are trending. Ea can ONLY open ONE long and one short trade at a time Please add smoothed averages to chart 30/60/100 in live chart VIEW COMMENTS SECTION FOR ALERT ONLY VERSION Test in strategy tester to visualize Ea setting
Default lot size 0.01 Default TP 50 pips Default SL 50 pips 2. Macd setting can be changed to default 12/26/9 Please backtest , for use in trending markets conditions .
FREE

Symbols: USDJPY- recomended other JPY pairs - please try in backtest Timeframe: M5 Recomended: M5 Money management: Fix TP and SL Backtest 2020- 2024 till now ,lot size:0.2 Recomended Lot size settings: Deposit. Lotsize 1000€. 0.02 2000€. 0.04 5000€. 0.1 10000€. 0.2 You can Multiply lot size by 1,5x (more risky) Recomended other settings: deafult Note: Please use good money management If you need help or other recomendations please ask me More
FREE
The Zero Lag Least Squares Moving Average (ZLSMA) is an advanced moving average indicator designed to provide fast and smooth trend analysis while eliminating lag. It is based on the Least Squares Moving Average (LSMA) but incorporates a zero-lag calculation, making it highly responsive to price changes. This indicator helps traders identify trend direction with minimal delay, making it ideal for both short-term and long-term trading strategies.
Key Features: • Zero-Lag Calculation – Red
FREE

If there is only one MT5 indicator you ever buy for trading forex – this has to be it.
Your success as a forex trader depends on being able to identify when a currency or currency pair is oversold or overbought. If it is strong or weak. It is this concept which lies at the heart of forex trading. Without the Quantum Currency Strength indicator, it is almost impossible. There are simply too many currencies and too many pairs to do this quickly and easily yourself. You need help!
The Quantum Cur

Of all the four principle capital markets, the world of foreign exchange trading is the most complex and most difficult to master, unless of course you have the right tools! The reason for this complexity is not hard to understand. First currencies are traded in pairs. Each position is a judgment of the forces driving two independent markets. If the GBP/USD for example is bullish, is this being driven by strength in the pound, or weakness in the US dollar. Imagine if we had to do the same thing
This EA can be used to trade the well known Turnaround Tuesday strategy. The original idea of the strategy is to wait for setbacks in the major indices and then benefit from recovery moves at the beginning of a new week. Many traders used (and still use) this strategy over the years. The EA will only open buy trades. Personally I use the program in index CFDs because these should tend to go up sooner or later. Economies are growing and so do the big indices. Even though nobody can guarantee thi

Alligator Window Indicator : Potencialize suas análises no MetaTrader com o Alligator Window. Este indicador coloca o clássico Alligator de Bill Williams em uma janela separada, permitindo uma visualização mais clara e organizada. Ideal para traders que buscam precisão e eficiência em suas operações, o Alligator Window proporciona insights nítidos e facilita a identificação de tendências sem poluir o gráfico principal. Experimente agora e leve suas estratégias de trading a um novo patamar!
FREE

An EA created to overclock a deposit within the short period of time. The EA uses accurate signals towards the trend to be able to enter the market. Together with the author’s optimization criterion, the EA allows you to choose appropriate settings to overclock your deposit. The EA works on 4 timeframes, which increases the accuracy of signals. Sometimes it can involve 3 timeframes. Attention! As you know, a trader's deposit is exposed to a risk in the Forex market. Especially, this should be ta

The indicator plots two lines by High and Low prices. The lines comply with certain criteria. The blue line is for buy. The red one is for sell. The entry signal - the bar opens above\below the lines. The indicator works on all currency pairs and time frames It can be used either as a ready-made trading system or as an additional signal for a custom trading strategy. There are no input parameters. Like with any signal indicator, it is very difficult to use the product during flat movements. You
FREE

ПОСМОТРИТЕ НАШ НОВЫЙ СОВЕТНИК : : https://www.mql5.com/ru/market/product/95095?source=Unknown#description
Индикатор стрелочник идеален для торговли в боковике, очень точно показывает моменты перекупленности и перепроданности инструмента, с дополнительными фильтрами также можно использовать для торговли по тренду. На экран выводятся стрелки сигнализирующие о развороте тренда, направление стрелки показывает дальнейшее направление торговли, также имеется звуковое оповещение. После закрытия бара
FREE

Experience the exhilarating world of trading with Boom or Bust, the groundbreaking MT5 trading game that takes your skills to the next level. Get ready to embark on a thrilling journey of virtual trading, where you can test your strategies and immerse yourself in the dynamic world of financial markets—all without risking real money. Experience the exhilarating world of trading with Boom or Bust, the groundbreaking MT5 trading game that takes your skills to the next level. Get ready to embark on
FREE

SI Connect is a utility that establishes the connection to our servers to use FX Volume or the SIEA trading systems.
Technical instructions to prepare your terminal for the usage of SI Connect Allow web requests and insert https://stein.investments to the list of allowed URLs in your Terminal Options -> Subcategory Expert Advisors . You need only one running EA instance per terminal, but it has to run constantly in the background to grab the latest data from our data centre.
In case of questio
FREE

Introduction to the Candle Time Indicator The Candle Time Indicator for MetaTrader 5, helps users know how much time on a candlestick is remaining.
Overview of Candle Time Indicator settings. TextColor: set the color of the countdown clock; FontSize: set the size of the font; Installation Guide Copy and paste the CandleTime.ex5 indicator files into the MQL5 folder of the Metatrader 5 trading platform. You can gain access to this folder by clicking the top menu options, that goes as follows: Fil
FREE

This indicator automatically draws horizontal lines at 00s, 20s, 50s and 80s levels. If you trade ICT concepts and are an ICT Student, then you know that these levels are used as institutional support/resistance levels and/or fibonacci retracement anchor points. Features
Draws horizontal lines at 00, 20, 50 and 80 levels above and below current market price . Choose the amount of levels to show on chart Customizable line colors Recommended for forex currency pairs. Saves time looking for thes
FREE

프로모션: 100달러부터 시작, 5개가 판매될 때마다 100달러씩 가격이 증가하며 최종 가격은 999달러입니다. 놓치지 마세요!
MomentumHunter 는 추세 추종 거래를 위해 특별히 설계된 EA입니다. 변동성 분석과 지능형 알고리즘을 결합하여 시장의 트렌드를 정확하게 포착합니다. EA를 차트에 로드하고 몇 가지 간단한 설정을 하면 EA가 모든 작업을 처리하므로 휴식을 취할 수 있습니다. 시간 프레임: M1 거래 쌍: XAUUSD (금) 전통적인 마틴게일 전략과 달리, MomentumHunter 는 견고한 리스크 관리 방식을 채택합니다. EA는 추세에 반하여 포지션을 두 배로 늘려 손실을 회복하려 하지 않으며, 대신 각 거래의 리스크 노출을 항상 제어합니다. 과학적인 포지션 계산과 자금 관리 방식 덕분에 더 큰 자금이 필요하지 않으며, 최소 10달러로 시작할 수 있습니다! EA 설정: 레버리지: >= 1:100 잔액: >= 10달러 (또는 동등한 통화) 계좌 유형: 모든 계

Индикатор Trade in trend предназначен для торговли по тренду. Сила тренда определяется шириной линии. Узкая линия - начало или конец тренда. Широкая линия свидетельствует о высокой силе тренда. Резкая смена ширины линии свидетельствует, с большой вероятностью, об окончании тенденции. Сигналы индикатора Не против покупки: переход с красной линии в белую цена отразилась от белой линии индикатора цена находится выше белой линии индикатора Не против продажи: переход с белой линии в красную цена отр
FREE
Attention - the indicator was initially developed for trading futures and the nuances of the Sunday session. This modification does not take into account the Sunday premarket, but is strictly tied to the time on the chart for correct operation on the spot market. Standard ATR indicator, you can enable ignoring abnormally large candles. It is possible to change the location of the displayed text in 4 corners of the chart. You can change the calculation period (days ago). Bonus - the indicator ha
FREE

As médias coiote automatizam a leitura de analise de médias rápidas e lentas no saldo do volume e preço. Quando as médias estão em modo compra, a coloração do candle fica azul.
Quando as médias estão em modo venda, a coloração do candle fica magenta. Quando a coloração fica verde ou vermelho, temos a tomada das médias no volume mas não no preço, quando isso ocorre é um sinal de atenção.
A concepção do indicador é ser utilizado para operações em saída de consolidações na direção da tendencia do
FREE
A Renko Tick chart based on continuously adjusting percentage.
Live Renko bricks formed by tick data
Adjustable brick width expert for indicator attached Scalp with a Renko, get weird.
The settings can and will break the script if you turn them up too high. Turning off outline mode will not look as nice, but can potentially allow for a larger number of bricks.
FREE
단계별로 "후행 중지"
이 유틸리티를 사용하면 "Trailing Stop" 도구를 사용할 때 가격에 따라 "손절매"를 이동하는 단계를 설정할 수 있습니다. 1핍 단위로 "손절매" 이동을 설정할 수 있는 "MetaTrader" 터미널에서 사용할 수 있는 "일반" "추적 손절매"와 달리 이 "추적 손절매"는 임의의 증분으로 구성됩니다. 이 설정을 사용하면 가격이 한 방향으로 오랫동안 이동한 후 약간의 수정을 위해 반전한 다음 다시 같은 방향으로 계속 이동하는 잘못된 추세 반전 중에 위치를 닫는 것을 방지할 수 있습니다. 가변적인 "손절매" 이동 단계가 있는 "Trailing Stop" 도구의 작업을 편리하게 관리하기 위해 개발자 Dmitry Fedoseev 가 도구의 작업을 구현하는 스크립트를 기존 거래 패널 "eInTradePane"에 적용했습니다. 거래 패널의 소스 코드는 https://www.mql5.com/en/code/220 에서 무료로 사용할 수 있습니다. "추적 손절매"가
FREE
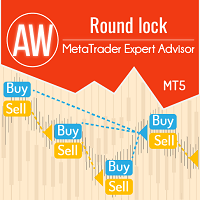
The EA opens two oppositely directed orders. When one of them is closed with profit, two orders are opened again, while the order volume is increased depending on Multiplier_Type and a number of orders opened by the EA. In each new open pair, orders are opened with an equal volume locking each other. Positions are opened till the number of same-type orders reaches the specified Limit_for_orders value. Afterwards, the EA only increases the grid excluding locking.
MT4 version -> HERE / Problem

INTRODUCTION : The breakout strength meter is a trading tool that is used to identify which currencies are the strongest to breakout, and which currencies are the weakest to breakout. The settings for the indicator are easy, and if you cannot find the settings, please leave a comment The tools are completely free to use Please, if you like the indicator, please leave a comment and rate the indicator in order to develop it
FREE
MetaTrader 플랫폼 어플리케이션 스토어에서 MetaTrader 마켓에서 트레이딩 로봇을 구매하는 방법에 대해 알아 보십시오.
MQL5.community 결제 시스템은 페이팔, 은행 카드 및 인기 결제 시스템을 통한 거래를 지원합니다. 더 나은 고객 경험을 위해 구입하시기 전에 거래 로봇을 테스트하시는 것을 권장합니다.
트레이딩 기회를 놓치고 있어요:
- 무료 트레이딩 앱
- 복사용 8,000 이상의 시그널
- 금융 시장 개척을 위한 경제 뉴스
등록
로그인
계정이 없으시면, 가입하십시오
MQL5.com 웹사이트에 로그인을 하기 위해 쿠키를 허용하십시오.
브라우저에서 필요한 설정을 활성화하시지 않으면, 로그인할 수 없습니다.