
MQL5의 드로잉 스타일
개요
MQL4는 6가지 드로잉 스타일을 지원합니다. MQL5는 18가지 드로잉 스타일을 지원하지요. 그러니까 MQL5의 드로잉 스타일을 알아 보면 되겠죠?
이번 글에서는 MQL5가 지원하는 드로잉 스타일에 대해 상세히 알아 보겠습니다. 그리고 인디케이터를 생성해서 드로잉 스타일도 설명하고 플롯도 개선해 보도록 할게요.드로잉 스타일
MQL4에는 플롯 개념이 없지만 SetIndexStyle() 함수의 첫 번째 변수인 라인 인덱스가 플롯 인덱스와 같은 역할을 한다고 생각하시면 됩니다.
void SetIndexStyle( int index, int type, int style=EMPTY, int width=EMPTY, color clr=CLR_NONE)
// The index is Line index.
MQL4는 6가지 드로잉 스타일만을 지원하는데요. DRAW_ZIGZAG는 2개의 버퍼를, 나머지 5가지 드로잉 스타일은 1개의 버퍼를 사용합니다.
따라서, MQL4의 경우, SetIndexStyle() 함수의 첫 번째 파라미터를 간단히 버퍼 인덱스로 이해할 수 있습니다. DRAW_ZIGZAG를 사용하지 않아도 아무런 문제가 없죠. 그나저나, MQL4에서 DRAW_ZIGZAG가 구현된 인디케이터를 보신 적이 있나요? 전 없거든요. (ZigZag.mq4는 DRAW_SECTION으로 구현됩니다).
MQL4와 MQL5의 드로잉 스타일을 비교해 봅시다.

표 1. MQL4와 MQL5의 드로잉 스타일 목록
뭐가 눈에 띄나요? MQL5는 12가지 드로잉 스타일을 지원하며 이 중 8가지는 컬러 버퍼를 가지고 있습니다. 다만 라인 인덱스의 개념을 혼동하기가 매우 쉽기 때문에 전처럼 모호하게 사용할 수는 없습니다.
그렇기 때문에 MQL5는 MQL4의 라인과 동일한 역할을 하는 플롯을 제공하여 인디케이터 창에서 그림을 그릴 수 있게 해줍니다.
MQL5에서는 선만 그릴 수 있는 것이 아니므로 플롯이라는 이름이 더 정확하죠.
버퍼 패턴
이번에는 버퍼 패턴에 대해 알아 보겠습니다. 드로잉 스타일의 버퍼 패턴에는 버퍼 넘버, 타입 및 어레인지먼트가 들어갑니다.
버퍼 패턴은 DataBuffer를 의미하는 D 또는 ColorBuffer를 의미하는 C의 문자열로 표현할 수 있으며 왼쪽에서 오른쪽으로 갈수록 상응하는 인덱스 넘버가 커집니다.
MQL5의 각 드로잉 스타일에 해당하는 버퍼 패턴은 다음 표에서 확인할 수 있습니다.
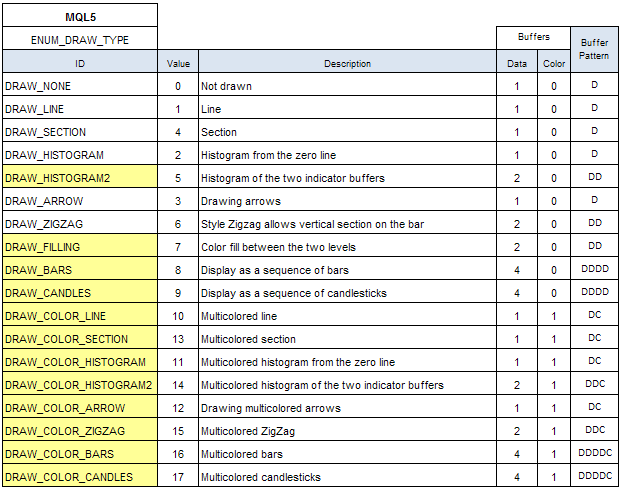
표 2 MQL5 드로잉 스타일별 버퍼 패턴
인디케이터에 복수의 플롯이 존재할 경우, 인디케이터의 버퍼 패턴은 플롯 버퍼 패턴의 순서를 따르며 SetIndexBuffer() 호출 시 버퍼 인덱스는 오름차순이어야 합니다.
연산에 필요한 데이터를 보조 버퍼에 임시로 저장한 경우 모든 보조 버퍼는 SetIndexBuffer()로 바인딩되어야 하며 디스플레이 가능한 버퍼 다음에 위치해야 합니다.
그것도 아니면...
직접 보여 드리고자 DemoBufferPattern 인디케이터를 생성했습니다. 한번 따라해 보세요.
DemoDrawType 인디케이터
DemoDrawType 인디케이터를 자세히 볼게요.
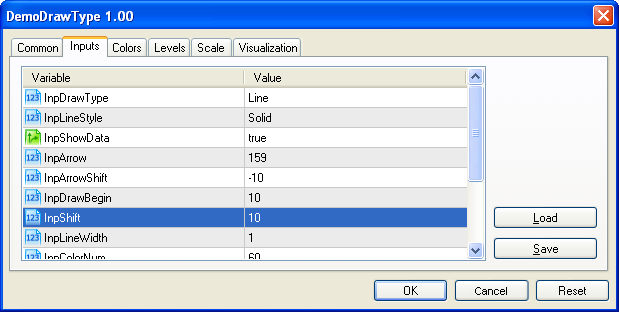
그림 1. 인디케이터 입력 변수
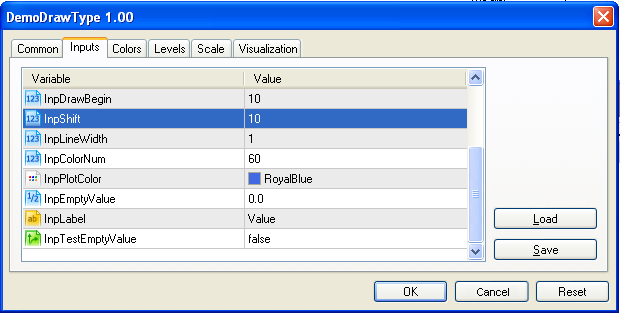
Figure 2. 인디케이터 입력 변수(계속)
'인풋' 탭에서 원하는 드로잉 스타일을 선택하고 플롯의 프로퍼티를 설정할 수 있습니다.
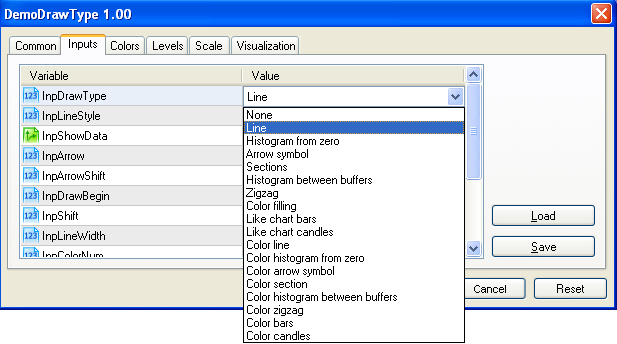
그림 3. 드로잉 스타일 목록
따라서, 각 속성별 입력 변수를 정의하고 각 변수의 합리성을 확인하는 함수를 구현해야 합니다.
또한 프로그램 상에서는 입력 변수를 수정할 수 없으므로 전역 변수 세트를 설정하여 확인된 입력 변수 값을 유지해야 합니다.
//--- input parameters
input ENUM_DRAW_TYPE InpDrawType    = DRAW_LINE;
input ENUM_LINE_STYLE InpLineStyle  = STYLE_SOLID;
input bool InpShowData        = true;
input uchar InpArrow          = 159;
input int InpArrowShift       = -10;
input int InpDrawBegin        = 10;
input int InpShift            = 10;
input int InpLineWidth        = 1;
input int InpColorNum         = 60;
input color InpPlotColor      = RoyalBlue;
input double InpEmptyValue    = 0.0;
input string InpLabel         = "Value";
input bool InpTestEmptyValue  = false;

//Note: Variables declared at global level must not be mixed up with the client terminal
//global variables that can be accessed using the GlobalVariable...() functions.
//--- you can not change input parameters in code, so you need Global Variables
ENUM_DRAW_TYPE iDrawType      = DRAW_LINE;
ENUM_LINE_STYLE iLineStyle    = STYLE_SOLID;
bool bShowData       = true;
uchar uArrow         = 181;
int iArrowShift      = -10;
int iDrawBegin       = 10;
int iShift           = 10;
int iLineWidth       = 1;
int iColorNum        = 60;
color iPlotColor     = RoyalBlue;
string sLabel        = "";
bool bTestEmptyValue = false;
double dEmptyValue   = EMPTY_VALUE;

//+------------------------------------------------------------------+
//| check input parameters.                                          |
//+------------------------------------------------------------------+
bool checkInput()
  {
   if(InpDrawType<DRAW_NONE || InpDrawType>DRAW_COLOR_CANDLES) return(false);
   else iDrawType = InpDrawType;
   if(InpLineStyle<STYLE_SOLID || InpLineStyle>STYLE_DASHDOTDOT) return(false);
   else iLineStyle = InpLineStyle;
   bShowData   = InpShowData;
   uArrow      = InpArrow;    //if uArrow>255, MQL5 will set Arrow as uArrow%256
   iArrowShift = InpArrowShift;
   iDrawBegin  = InpDrawBegin;
   iShift      = InpShift;
   iLineWidth  = InpLineWidth;
   iColorNum   = InpColorNum;
   iPlotColor  = InpPlotColor;
   //if(InpEmptyValue<=0.0) dEmptyValue=0.0;
   //else dEmptyValue=EMPTY_VALUE;
   dEmptyValue = InpEmptyValue;  // It may be not 0.0 or EMPTY_VALUE
   sLabel      = InpLabel;
   bTestEmptyValue = InpTestEmptyValue;
   return(true);
  }
그림 4-21. 18가지 드로잉 스타일의 예시
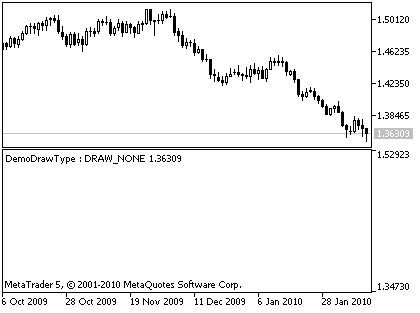
그림 4. DRAW_NONE의 예시
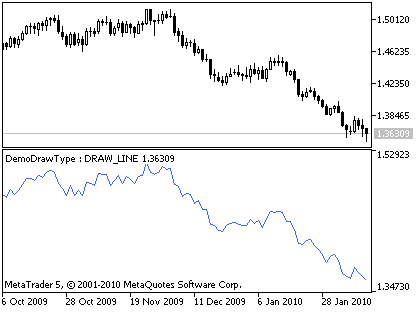
그림 5. DRAW_LINE의 예시
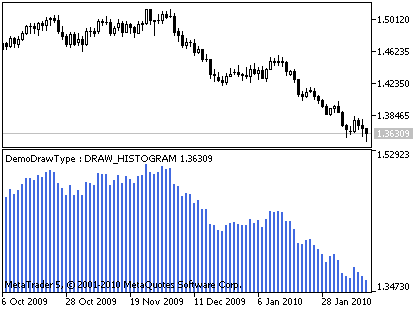
그림 6. DRAW_HISTOGRAM의 예시
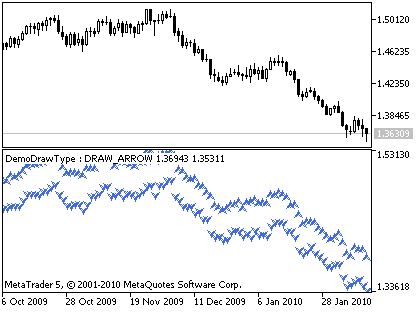
그림 7. DRAW_ARROW의 예시
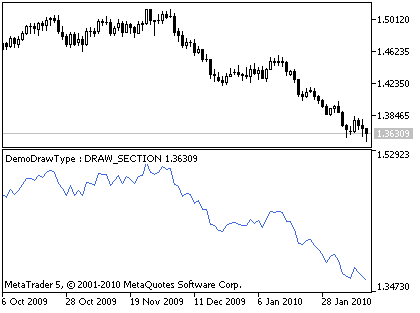
그림 8. DRAW_SECTION의 예시
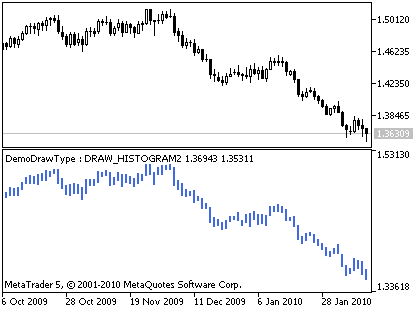
그림 9. DRAW_HISTOGRAM2의 예시
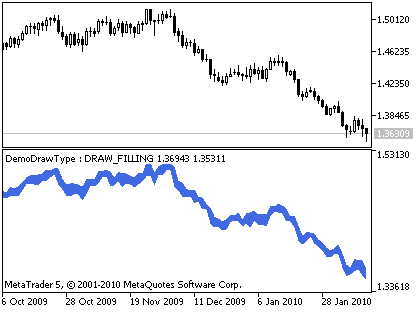
그림 10. DRAW_FILLING의 예시
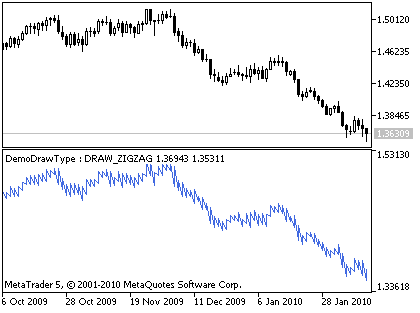
그림 11. DRAW_ZIGZAG의 예시
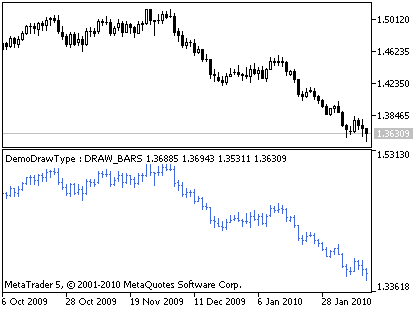
그림 12. Example of drawing style DRAW_BARS
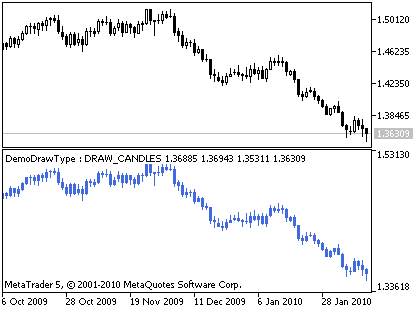
그림 13. DRAW_CANDLES의 예시
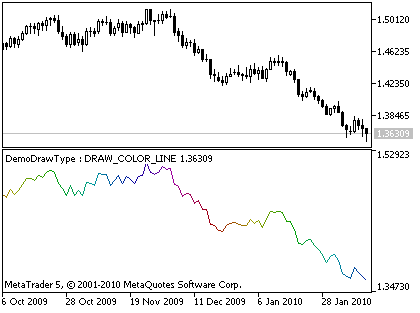
그림 14. DRAW_COLOR_LINE의 예시
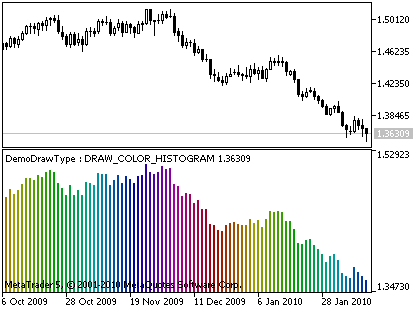
그림 15. DRAW_COLOR_HISTOGRAM의 예시
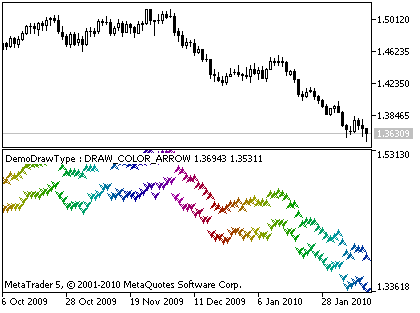
그림 16. DRAW_COLOR_ARROW의 예시
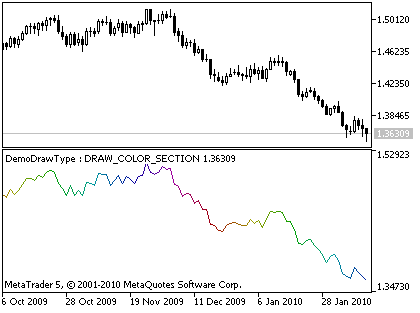
그림 17. DRAW_COLOR_SECTION의 예시
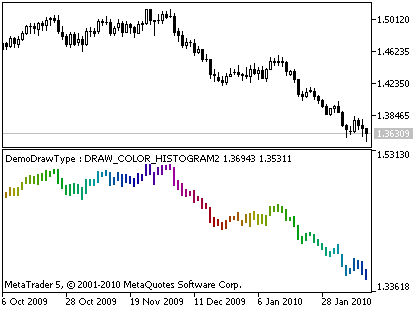
그림 18. DRAW_COLOR_HISTOGRAM2의 예시
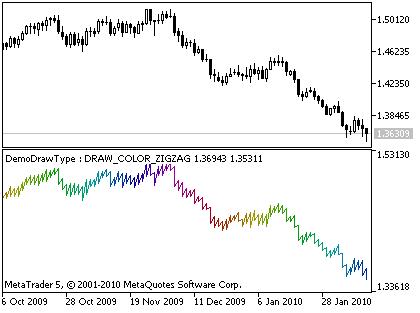
그림 19. DRAW_COLOR_ZIGZAG의 예시
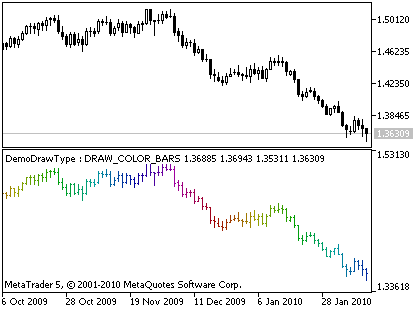
그림 20. DRAW_COLOR_BARS의 예시
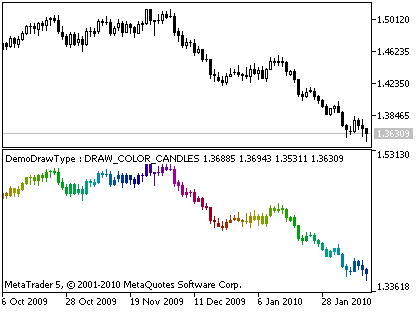
그림 21. DRAW_COLOR_CANDLES의 예시
빈 값 다루기
드로잉 스타일별로 차트가 다르므로 버퍼 패턴 또한 상이하죠.
버퍼 패턴을 제외하면 드로잉 스타일 사이의 가장 큰 차이점은 바로 빈 값을 다루는 방식이 됩니다.
그래서 빈 값을 삽입할 수 있게 해주는 입력 변수를 추가해 보았습니다. DrawType에 대한 설명이 본 인디케이터의 목적인 만큼 이번에는 빈 값을 설정해 보겠습니다.
빈 값 처리 방식을 기준으로 하면 전체 드로잉 스타일을 세 가지 카테고리로 분류할 수 있습니다.

표 3. 카테고리별 드로잉 스타일
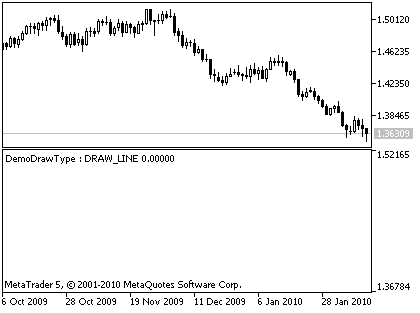
그림 22. DRAW_LINE의 예시(빈 값 포함 시)
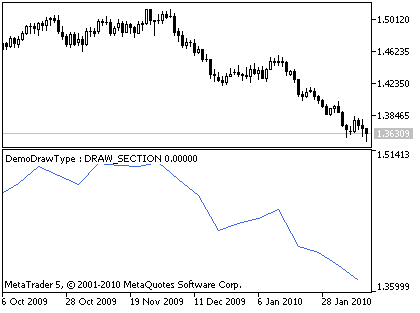
그림23. DRAW_SECTION의 예시(빈값 포함 시)
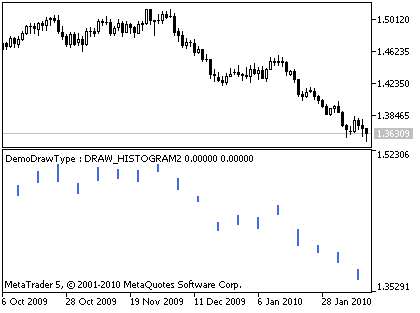
그림24. DRAW_HISTOGRAM2의 예시(빈값 포함 시)
그림 25. DRAW_BARS의 예시(빈값 포함 시)
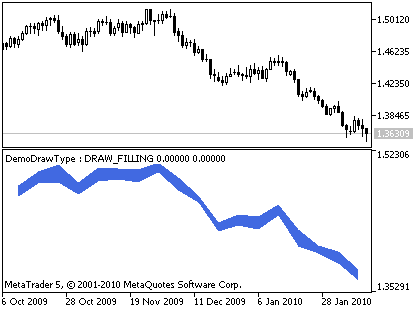
그림 26. DRAW_FILLING의 예시(빈값 포함 시)
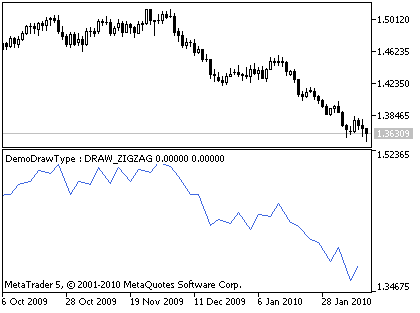
그림 27. DRAW_ZIGZAG의 예시(빈값 포함 시)
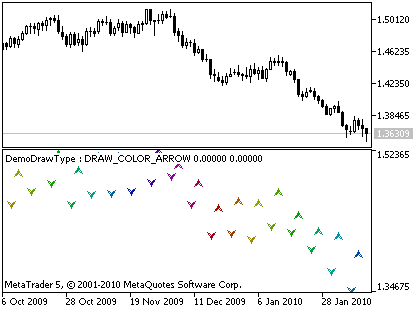
그림 28. DRAW_COLOR_ARROW의 예시(빈값 포함 시)
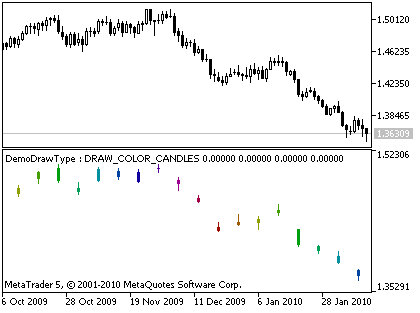
그림 29. DRAW_COLOR_CANDLES(빈 값 포함 시)
인디케이터 전체 소스 코드:
//+------------------------------------------------------------------+
//|                                                 DemoDrawType.mq5 |
//|                             Copyright 2010, Loong@forum.mql4.com |
//|                             http://login.mql5.com/en/users/Loong |
//+------------------------------------------------------------------+
#property copyright "2010, Loong@forum.mql4.com"
#property link      "http://login.mql5.com/en/users/Loong"
#property version   "1.00"

//#property indicator_chart_window
#property indicator_separate_window // in order to more clearly show
#property indicator_plots   1 //must set, can be bigger than necessary, can not be bigger than indicator_buffers
#property indicator_buffers 5 //must set, can be bigger than necessary
//+------------------------------------------------------------------+
//| DrawType struct, record info about DrawType and Buffer-Pattern   |
//+------------------------------------------------------------------+
struct SLoongDrawType                       // Draw Type
  {
   ENUM_DRAW_TYPE    eDrawType;             // enum of Draw Type
   int               iDrawType;             // value of Draw Type, only used to look
   int               iNumBufferData;        // number of Data Buffer
   int               iNumBufferColor;       // number of Color Buffer
   string            sDrawType;             // string of Draw Type
   string            sDrawTypeDescription;  // string of Draw Type Description, copy from document
  };
//+------------------------------------------------------------------+
//| const array, record info about DrawType and Buffer-Pattern       |
//+------------------------------------------------------------------+
const SLoongDrawType caDrawType[]=
  {
     { DRAW_NONE,              0,    1,    0,    "DRAW_NONE",             "Not drawn" },
     { DRAW_LINE,              1,    1,    0,    "DRAW_LINE",             "Line" },
     { DRAW_HISTOGRAM,         2,    1,    0,    "DRAW_HISTOGRAM",        "Histogram from the zero line" },
     { DRAW_ARROW,             3,    1,    0,    "DRAW_ARROW",            "Drawing arrows" },
     { DRAW_SECTION,           4,    1,    0,    "DRAW_SECTION",          "Section" },
     { DRAW_HISTOGRAM2,        5,    2,    0,    "DRAW_HISTOGRAM2",       "Histogram of the two indicator buffers" },
     { DRAW_ZIGZAG,            6,    2,    0,    "DRAW_ZIGZAG",           "Style Zigzag allows vertical section on the bar" },
     { DRAW_FILLING,           7,    2,    0,    "DRAW_FILLING",          "Color fill between the two levels" },
     { DRAW_BARS,              8,    4,    0,    "DRAW_BARS",             "Display as a sequence of bars" },
     { DRAW_CANDLES,           9,    4,    0,    "DRAW_CANDLES",          "Display as a sequence of candlesticks" },
     { DRAW_COLOR_LINE,       10,    1,    1,    "DRAW_COLOR_LINE",       "Multicolored line" },
     { DRAW_COLOR_HISTOGRAM,  11,    1,    1,    "DRAW_COLOR_HISTOGRAM",  "Multicolored histogram from the zero line" },
     { DRAW_COLOR_ARROW,      12,    1,    1,    "DRAW_COLOR_ARROW",      "Drawing multicolored arrows" },
     { DRAW_COLOR_SECTION,    13,    1,    1,    "DRAW_COLOR_SECTION",    "Multicolored section" },
     { DRAW_COLOR_HISTOGRAM2, 14,    2,    1,    "DRAW_COLOR_HISTOGRAM2", "Multicolored histogram of the two indicator buffers" },
     { DRAW_COLOR_ZIGZAG,     15,    2,    1,    "DRAW_COLOR_ZIGZAG",     "Multicolored ZigZag" },
     { DRAW_COLOR_BARS,       16,    4,    1,    "DRAW_COLOR_BARS",       "Multicolored bars" },
     { DRAW_COLOR_CANDLES,    17,    4,    1,    "DRAW_COLOR_CANDLES",    "Multicolored candlesticks" }
  };

//--- input parameters
input ENUM_DRAW_TYPE InpDrawType    = DRAW_LINE;
input ENUM_LINE_STYLE InpLineStyle  = STYLE_SOLID;
input bool InpShowData        = true;
input uchar InpArrow          = 159;
input int InpArrowShift       = -10;
input int InpDrawBegin        = 10;
input int InpShift            = 10;
input int InpLineWidth        = 1;
input int InpColorNum         = 60;
input color InpPlotColor      = RoyalBlue;
input double InpEmptyValue    = 0.0;
input string InpLabel         = "Value";
input bool InpTestEmptyValue  = false;

//Note: Variables declared at global level must not be mixed up with the client terminal
// global variables that can be accessed using the GlobalVariable...() functions.
//--- you can not change input parameters in code, so you need Global Variables
ENUM_DRAW_TYPE iDrawType      = DRAW_LINE;
ENUM_LINE_STYLE iLineStyle    = STYLE_SOLID;
bool bShowData       = true;
uchar uArrow         = 181;
int iArrowShift      = -10;
int iDrawBegin       = 10;
int iShift           = 10;
int iLineWidth       = 1;
int iColorNum        = 60;
color iPlotColor     = RoyalBlue;
string sLabel        = "";
bool bTestEmptyValue = false;
double dEmptyValue   = EMPTY_VALUE;

//--- indicator buffers
double DC[];   // color buffer
double D1[];   //  data buffer
double D2[];
double D3[];
double D4[];
//+------------------------------------------------------------------+
//| check input parameters.                                          |
//+------------------------------------------------------------------+
bool checkInput()
  {
   if(InpDrawType<DRAW_NONE || InpDrawType>DRAW_COLOR_CANDLES) return(false);
   else iDrawType=InpDrawType;
   if(InpLineStyle<STYLE_SOLID || InpLineStyle>STYLE_DASHDOTDOT) return(false);
   else iLineStyle=InpLineStyle;
   bShowData   =InpShowData;
   uArrow=InpArrow;    //if uArrow>255, MQL5 will set Arrow as uArrow%256
   iArrowShift = InpArrowShift;
   iDrawBegin  = InpDrawBegin;
   iShift      = InpShift;
   iLineWidth  = InpLineWidth;
   iColorNum   = InpColorNum;
   iPlotColor  = InpPlotColor;
//if(InpEmptyValue<=0.0) dEmptyValue=0.0;
//else dEmptyValue=EMPTY_VALUE;
   dEmptyValue=InpEmptyValue;  // It may be not 0.0 or EMPTY_VALUE
   sLabel=InpLabel;
   bTestEmptyValue=InpTestEmptyValue;
   return(true);
  }
//+------------------------------------------------------------------+
//| color well-distributed                                           |
//+------------------------------------------------------------------+
int ColorInc6section(int i,int iBase=63,int iI=0xFF)
  {
   int id  = (int)MathFloor((double)iBase/6.0);
   int ip  = (int)MathFloor((double)iI/id);
   int MA_Rinc=0;
   int MA_Ginc=0;
   int MA_Binc=0;
   color iColor=0;
   if(i<=0)        {iColor =       iI; MA_Rinc=0; MA_Ginc=0; MA_Binc=0;}
   else if(i<1*id) {iColor =       iI; MA_Rinc=  0; MA_Ginc= ip; MA_Binc=  0;}
   else if(i<2*id) {iColor =   257*iI; MA_Rinc=-ip; MA_Ginc=  0; MA_Binc=  0;}
   else if(i<3*id) {iColor =   256*iI; MA_Rinc=  0; MA_Ginc=  0; MA_Binc= ip;}
   else if(i<4*id) {iColor = 65792*iI; MA_Rinc=  0; MA_Ginc=-ip; MA_Binc=  0;}
   else if(i<5*id) {iColor = 65536*iI; MA_Rinc= ip; MA_Ginc=  0; MA_Binc=  0;}
   else if(i<6*id) {iColor = 65537*iI; MA_Rinc=  0; MA_Ginc=  0; MA_Binc=-ip;}
   else            {iColor =       iI; MA_Rinc=  0; MA_Ginc=  0; MA_Binc=  0;}
   int iColorInc=(MA_Rinc+256*MA_Ginc+65536*MA_Binc);
   return iColor+iColorInc*(i%id);
  }
//+------------------------------------------------------------------+
//| Set Plot Color Indexes                                           |
//+------------------------------------------------------------------+
void SetPlotColorIndexes(int plot_index)
  {
   int iIllumination=0xFF;
//color cBack=(color)ChartGetInteger(0,CHART_COLOR_BACKGROUND);
//Print("BACKGROUND is ",cBack);
//if(White==cBack) iIllumination=0x9F; //want to obtain a better visual effect
   PlotIndexSetInteger(plot_index,PLOT_COLOR_INDEXES,iColorNum);
   for(int i=0;i<iColorNum;i++)
      PlotIndexSetInteger(plot_index,PLOT_LINE_COLOR,i,ColorInc6section(i,iColorNum,iIllumination));
  }
//+------------------------------------------------------------------+
//| Set Plot Draw Type and other Properties                          |
//+------------------------------------------------------------------+
bool SetPlotProperties()
  {
//Print("iDrawType="+iDrawType);
   PlotIndexSetInteger(0,PLOT_DRAW_TYPE,iDrawType);
   PlotIndexSetInteger(0,PLOT_LINE_STYLE,iLineStyle);
   PlotIndexSetInteger(0,PLOT_SHIFT,iShift);
   PlotIndexSetInteger(0,PLOT_SHOW_DATA,bShowData);//--- if show indicator data in DataWindow
   PlotIndexSetInteger(0,PLOT_DRAW_BEGIN,iDrawBegin);
   PlotIndexSetInteger(0,PLOT_LINE_WIDTH,iLineWidth);
   PlotIndexSetDouble(0,PLOT_EMPTY_VALUE,dEmptyValue);
   PlotIndexSetString(0,PLOT_LABEL,sLabel);
   switch(iDrawType) //            Data  Color
     {
      case DRAW_COLOR_ARROW:       //1,    1,
         SetIndexBuffer(0,D1,INDICATOR_DATA);
         SetIndexBuffer(1,DC,INDICATOR_COLOR_INDEX);
         PlotIndexSetInteger(0,PLOT_ARROW,uArrow);
         PlotIndexSetInteger(0,PLOT_ARROW_SHIFT,iArrowShift);
         SetPlotColorIndexes(0);
         break;

      case DRAW_ARROW:             //1,    0,
         SetIndexBuffer(0,D1,INDICATOR_DATA);
         PlotIndexSetInteger(0,PLOT_ARROW,uArrow);
         PlotIndexSetInteger(0,PLOT_ARROW_SHIFT,iArrowShift);
         PlotIndexSetInteger(0,PLOT_LINE_COLOR,iPlotColor);
         break;

      case DRAW_COLOR_LINE:        //1,    1,
      case DRAW_COLOR_HISTOGRAM:   //1,    1,
      case DRAW_COLOR_SECTION:     //1,    1,
         SetIndexBuffer(0,D1,INDICATOR_DATA);
         SetIndexBuffer(1,DC,INDICATOR_COLOR_INDEX);
         SetPlotColorIndexes(0);
         break;

      case DRAW_NONE:              //1,    0,
      case DRAW_LINE:              //1,    0,
      case DRAW_HISTOGRAM:         //1,    0,
      case DRAW_SECTION:           //1,    0,
         SetIndexBuffer(0,D1,INDICATOR_DATA);
         PlotIndexSetInteger(0,PLOT_LINE_COLOR,iPlotColor);
         break;

      case DRAW_COLOR_HISTOGRAM2:  //2,    1,
      case DRAW_COLOR_ZIGZAG:      //2,    1,
         SetIndexBuffer(0,D1,INDICATOR_DATA);
         SetIndexBuffer(1,D2,INDICATOR_DATA);
         SetIndexBuffer(2,DC,INDICATOR_COLOR_INDEX);
         SetPlotColorIndexes(0);
         break;

      case DRAW_HISTOGRAM2:        //2,    0,
      case DRAW_ZIGZAG:            //2,    0,
         SetIndexBuffer(0,D1,INDICATOR_DATA);
         SetIndexBuffer(1,D2,INDICATOR_DATA);
         PlotIndexSetInteger(0,PLOT_LINE_COLOR,iPlotColor);
         break;

      case DRAW_FILLING:           //2,    0,
         SetIndexBuffer(0,D1,INDICATOR_DATA);
         SetIndexBuffer(1,D2,INDICATOR_DATA);
         PlotIndexSetInteger(0,PLOT_LINE_COLOR,iPlotColor);
         break;

      case DRAW_COLOR_BARS:        //4,    1,
      case DRAW_COLOR_CANDLES:     //4,    1,
         SetIndexBuffer(0,D1,INDICATOR_DATA);
         SetIndexBuffer(1,D2,INDICATOR_DATA);
         SetIndexBuffer(2,D3,INDICATOR_DATA);
         SetIndexBuffer(3,D4,INDICATOR_DATA);
         SetIndexBuffer(4,DC,INDICATOR_COLOR_INDEX);
         SetPlotColorIndexes(0);
         break;
      case DRAW_BARS:              //4,    0,
      case DRAW_CANDLES:           //4,    0,
         SetIndexBuffer(0,D1,INDICATOR_DATA);
         SetIndexBuffer(1,D2,INDICATOR_DATA);
         SetIndexBuffer(2,D3,INDICATOR_DATA);
         SetIndexBuffer(3,D4,INDICATOR_DATA);
         PlotIndexSetInteger(0,PLOT_LINE_COLOR,iPlotColor);
         break;
     }
   return(true);
  }
//+------------------------------------------------------------------+
//| Custom indicator initialization function                         |
//+------------------------------------------------------------------+
int OnInit()
  {
//--- ArrayInit
   bool bInitBuffer=true;
   if(bInitBuffer)
     {
      ArrayInitialize(D1,dEmptyValue);
      ArrayInitialize(D2,dEmptyValue);
      ArrayInitialize(D3,dEmptyValue);
      ArrayInitialize(D4,dEmptyValue);
      ArrayInitialize(DC,dEmptyValue);
     }
   checkInput();
   SetPlotProperties();
//--- set accuracy
   IndicatorSetInteger(INDICATOR_DIGITS,_Digits);
   IndicatorSetString(INDICATOR_SHORTNAME,"DemoDrawType : "+caDrawType[iDrawType].sDrawType);
   return(0);
  }
//+------------------------------------------------------------------+
//| Custom indicator iteration function                              |
//+------------------------------------------------------------------+
int OnCalculate(const int rates_total,
                const int prev_calculated,
                const datetime &time[],
                const double &open[],
                const double &high[],
                const double &low[],
                const double &close[],
                const long &tick_volume[],
                const long &volume[],
                const int &spread[])
  {
//--- auxiliary variables
   int i=0;
//--- set position for beginning
   if(i<prev_calculated) i=prev_calculated-1;
//--- start calculations
   while(i<rates_total)
     {
      switch(iDrawType) //            Data  Color   if(buffer contain dEmptyValue)
        {
         case DRAW_COLOR_LINE:        //1,    1,      all do not draw
            DC[i]=(double)(i%iColorNum);
         case DRAW_LINE:              //1,    0,      all do not draw
         case DRAW_NONE:              //1,    0,      draw nothing at first
            if(bTestEmptyValue)
              {
               if(i%5==1)D1[i]=high[i];
               else D1[i]=dEmptyValue;
              }
            else
               D1[i]=close[i];
            break;

         case DRAW_COLOR_SECTION:     //1,    1,      link between non-empty place
            DC[i]=(double)(i%iColorNum);
         case DRAW_SECTION:           //1,    0,      connecting adjacent non-empty value
            if(bTestEmptyValue)
              {
               if(i%5==1)D1[i]=close[i];
               else D1[i]=dEmptyValue;
              }
            else
               D1[i]=close[i];
            break;

         case DRAW_FILLING:           //2,    0,
            //DC[i]=(double)(i%iColorNum);
            if(bTestEmptyValue)
              {
               if(i%5==1)
                 {
                  D1[i]=high[i];
                  D2[i]=low[i];
                 }
               else
                 {
                  D1[i]=dEmptyValue;
                  D2[i]=dEmptyValue;
                 }
              }
            else
              {
               D1[i]=high[i];
               D2[i]=low[i];
              }
            break;

         case DRAW_COLOR_ZIGZAG:      //2,    1,
            DC[i]=(double)(i%iColorNum);
         case DRAW_ZIGZAG:            //2,    0,
            if(bTestEmptyValue)
              {
               if(i%5==1)D1[i]=high[i];
               else D1[i]=dEmptyValue;
               if(i%5==4)D2[i]=low[i];
               else D2[i]=dEmptyValue;
              }
            else
              {
               D1[i]=high[i];
               D2[i]=low[i];
              }
            break;

         case DRAW_COLOR_ARROW:       //1,    1,      draw arrow at non-empty value
         case DRAW_COLOR_HISTOGRAM:   //1,    1,      only draw at non-empty place
            DC[i]=(double)(i%iColorNum);
         case DRAW_ARROW:             //1,    0,      draw arrow at non-empty value
         case DRAW_HISTOGRAM:         //1,    0,      only draw at non-empty place
            if(bTestEmptyValue)
              {
               if(i%5==1)D1[i]=close[i];
               else D1[i]=dEmptyValue;
              }
            else
              {
               D1[i]=close[i];
              }
            break;

         case DRAW_COLOR_HISTOGRAM2:  //2,    1,      only draw at non-empty place
            DC[i]=(double)(i%iColorNum);
         case DRAW_HISTOGRAM2:        //2,    0,      only draw at non-empty place
            if(bTestEmptyValue)
              {
               if(i%5==1)
                 {
                  D1[i]=high[i];
                  D2[i]=low[i];
                 }
               else
                 {
                  D1[i]=dEmptyValue;
                  D2[i]=dEmptyValue;
                 }
              }
            else
              {
               D1[i]=high[i];
               D2[i]=low[i];
              }
            break;

         case DRAW_COLOR_BARS:        //4,    1,      only draw at non-empty place
         case DRAW_COLOR_CANDLES:     //4,    1,      only draw at non-empty place
            DC[i]=(double)(i%iColorNum);
         case DRAW_BARS:              //4,    0,      only draw at non-empty place
         case DRAW_CANDLES:           //4,    0,      only draw at non-empty place
            if(bTestEmptyValue)
              {
               if(i%5==1)
                 {
                  D1[i]=open[i];
                  D2[i]=high[i];
                  D3[i]=low[i];
                  D4[i]=close[i];
                 }
               else
                 {
                  D1[i]=dEmptyValue;
                  D2[i]=dEmptyValue;
                  D3[i]=dEmptyValue;
                  D4[i]=dEmptyValue;
                 }
              }
            else
              {
               D1[i]=open[i];
               D2[i]=high[i];
               D3[i]=low[i];
               D4[i]=close[i];
              }
            break;
        }
      //---
      i++;
     }
//--- return value of prev_calculated for next call
   return(rates_total);
  }
//+------------------------------------------------------------------+
그럴 줄 알고 미리 준비한 Q&A
Q: 아무 것도 안 나오는데요.
A: 이 인디케이터의 목적은 코드를 작성하지 않고 드로잉 스타일을 테스트하는 것이므로 잘못된 매개 변수 값을 입력하면 당연히 아무 것도 안 나와요. 진정하세요.
Q: caDrawType[]은 아무짝에도 쓸모없어 보이는데요. 문자열 이름이나 쓰라고 만든 겁니까?
A: 아이고. 사실 제가 귀찮아서 예전에 썼던 글 복사한거라... 물론 caDrawType[]이 굉장히 유용하게 쓰일 수도 있는데, 다음에 설명할게요.
결론
그리고 싶은 건 다 그릴 수 있다.
코드가 함께하길.
MetaQuotes 소프트웨어 사를 통해 영어가 번역됨
원본 기고글: https://www.mql5.com/en/articles/45
 MQL5로 틱 인디케이터 만들기
 MQL5에서 인디케이터를 호출하는 방법
 MetaTrader5가 주는 새로운 기회
 Expert Advisor에서 OnTrade() 함수를 이용한 거래 이벤트 처리