
The Drawing Styles in MQL5

Introduction
There are 6 drawing styles in MQL4. And there are 18 drawing styles in MQL5. Therefore, it may be worth writing an article to introduce MQL5's drawing styles.
In this article we will consider the details of drawing styles in MQL5. In addition, we will create an indicator to demonstrate how to use these drawing styles, and refine the plotting.Drawing Styles
In MQL4, there isn't Plot concept, but the first parameter of SetIndexStyle() function, Line index, is equivalent to Plot index.
void SetIndexStyle( int index, int type, int style=EMPTY, int width=EMPTY, color clr=CLR_NONE)
// The index is Line index.
In MQL4 there are only 6 drawing styles, in addition to DRAW_ZIGZAG need two buffers, the other 5 drawing styles need only one buffer.
Therefore, in MQL4, the first parameter of SetIndexStyle() function can easily be understood as the buffer index. It is no problem if you don't use DRAW_ZIGZAG. By the way, have you seen MQL4 indicators implemented with DRAW_ZIGZAG? I haven't seen. (ZigZag.mq4 is implemented with DRAW_SECTION).
Let's compare drawing styles in MQL4 and MQL5:

Table 1. List of drawing styles in MQL4 and MQL5
What do you see? In MQL5 new 12 drawing styles has been added, and there are 8 new drawing styles with a color buffer. It can't be used vaguely as before, the concept of Line index is too easily confused.
Therefore, MQL5 gives you a Plot, it's equivalent to Line in MQL4, that you can draw in the indicator window.
You can draw not only the line in MQL5, so the name is more accurate with the Plot.
Buffer-Pattern
Here we define the concept of Buffer-Pattern. The Buffer-Pattern of a drawing style is that it needs Buffer number, type and arrangement.
We can represent the Buffer-Pattern of drawing style with a string, letter D for DataBuffer, letter C for ColorBuffer, from left to right correspond to the index number from small to large.
So, the Buffer-Pattern of MQL5 drawing styles is presented in the following table:

Table 2. Buffer-Patterns for drawing styles in MQL5
If you have multiple Plots in your indicators, then the Buffer-Pattern of the indicators is arrangement in order of these Plots' Buffer-Pattern, the index of Buffer should be in ascending order when call SetIndexBuffer().
If you used some auxiliary buffers to save the temporary data that is required by calculation, then these auxiliary buffers should be bound with SetIndexBuffer(), and placed after all buffer that can be displayed.
Otherwise ...
I published an Indicator, DemoBufferPattern, to demo buffer-pattern. Try it youself.
The indicator DemoDrawType
Let's consider the indicator DemoDrawType.

Figure 1. Indicator input parameters
")
Figure 2. Indicator input parameters (continue)
It allows you to select any drawing style from the "Inputs" tab, and set the various properties of Plot.

Figure 3. Drawing styles list
Therefore, we need to define an input variable for each attribute, and to implement a function to check the reasonableness of these variables.
Because the input variables can not be modified in the program, it also need to define a set of global variables to hold the checked input variable value.
//--- input parameters
input ENUM_DRAW_TYPE InpDrawType    = DRAW_LINE;
input ENUM_LINE_STYLE InpLineStyle  = STYLE_SOLID;
input bool InpShowData        = true;
input uchar InpArrow          = 159;
input int InpArrowShift       = -10;
input int InpDrawBegin        = 10;
input int InpShift            = 10;
input int InpLineWidth        = 1;
input int InpColorNum         = 60;
input color InpPlotColor      = RoyalBlue;
input double InpEmptyValue    = 0.0;
input string InpLabel         = "Value";
input bool InpTestEmptyValue  = false;

//Note: Variables declared at global level must not be mixed up with the client terminal
//global variables that can be accessed using the GlobalVariable...() functions.
//--- you can not change input parameters in code, so you need Global Variables
ENUM_DRAW_TYPE iDrawType      = DRAW_LINE;
ENUM_LINE_STYLE iLineStyle    = STYLE_SOLID;
bool bShowData       = true;
uchar uArrow         = 181;
int iArrowShift      = -10;
int iDrawBegin       = 10;
int iShift           = 10;
int iLineWidth       = 1;
int iColorNum        = 60;
color iPlotColor     = RoyalBlue;
string sLabel        = "";
bool bTestEmptyValue = false;
double dEmptyValue   = EMPTY_VALUE;

//+------------------------------------------------------------------+
//| check input parameters.                                          |
//+------------------------------------------------------------------+
bool checkInput()
  {
   if(InpDrawType<DRAW_NONE || InpDrawType>DRAW_COLOR_CANDLES) return(false);
   else iDrawType = InpDrawType;
   if(InpLineStyle<STYLE_SOLID || InpLineStyle>STYLE_DASHDOTDOT) return(false);
   else iLineStyle = InpLineStyle;
   bShowData   = InpShowData;
   uArrow      = InpArrow;    //if uArrow>255, MQL5 will set Arrow as uArrow%256
   iArrowShift = InpArrowShift;
   iDrawBegin  = InpDrawBegin;
   iShift      = InpShift;
   iLineWidth  = InpLineWidth;
   iColorNum   = InpColorNum;
   iPlotColor  = InpPlotColor;
   //if(InpEmptyValue<=0.0) dEmptyValue=0.0;
   //else dEmptyValue=EMPTY_VALUE;
   dEmptyValue = InpEmptyValue;  // It may be not 0.0 or EMPTY_VALUE
   sLabel      = InpLabel;
   bTestEmptyValue = InpTestEmptyValue;
   return(true);
  }
The examples of all 18 drawing styles are presented at figures 4-21:
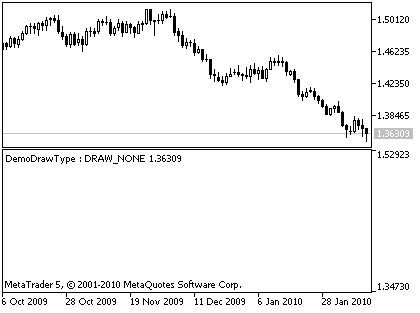
Figure 4. Example of drawing style DRAW_NONE
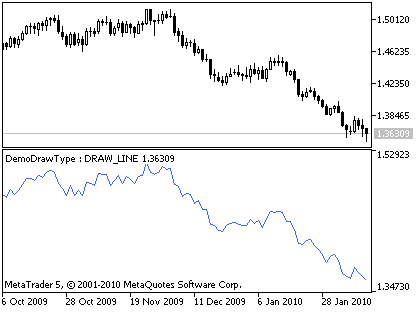
Figure 5. Example of drawing style DRAW_LINE
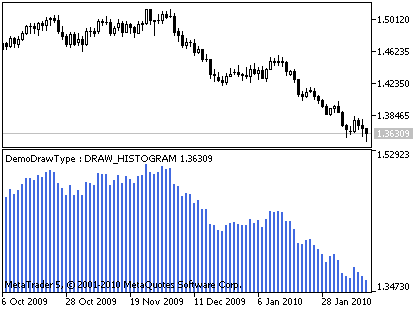
Figure 6. Example of drawing style DRAW_HISTOGRAM
![]()
Figure 7. Example of drawing style DRAW_ARROW
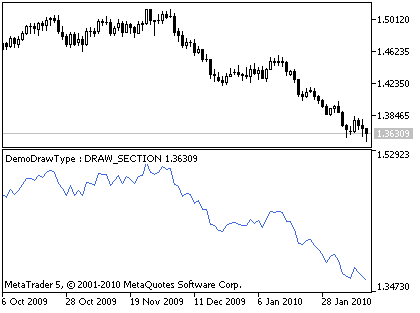
Figure 8. Example of drawing style DRAW_SECTION
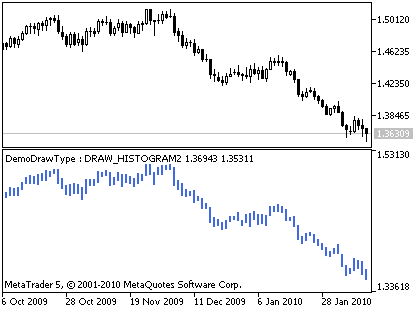
Figure 9. Example of drawing style DRAW_HISTOGRAM2
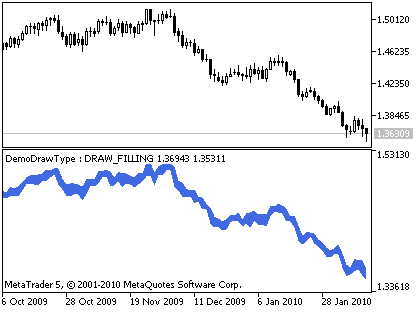
Figure 10. Example of drawing style DRAW_FILLING
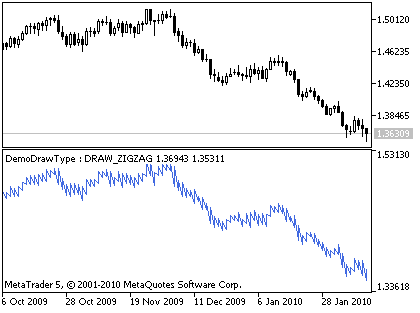
Figure 11. Example of drawing style DRAW_ZIGZAG
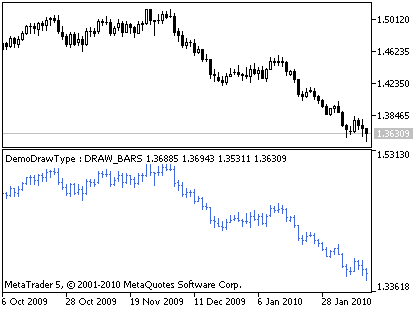
Figure 12. Example of drawing style DRAW_BARS
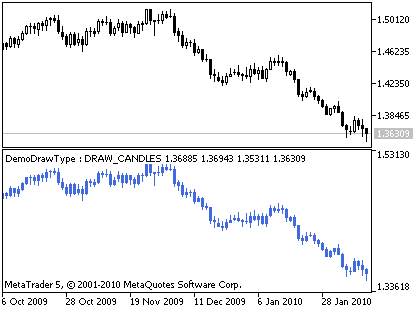
Figure 13. Example of drawing style DRAW_CANDLES
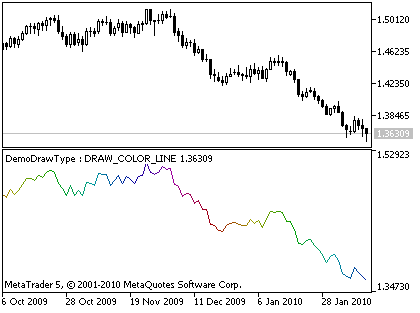
Figure 14. Example of drawing style DRAW_COLOR_LINE
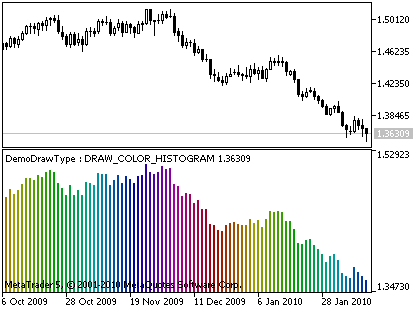
Figure 15. Example of drawing style DRAW_COLOR_HISTOGRAM
![]()
Figure 16. Example of drawing style DRAW_COLOR_ARROW
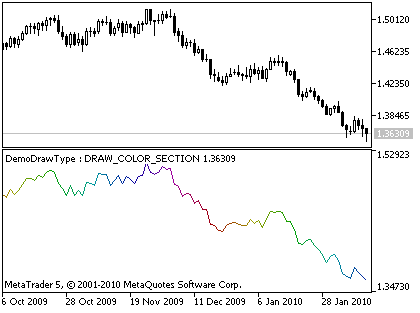
Figure 17. Example of drawing style DRAW_COLOR_SECTION
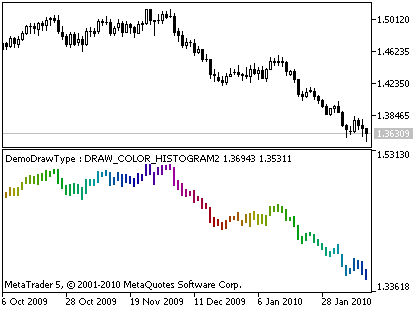
Figure 18. Example of drawing style DRAW_COLOR_HISTOGRAM2

Figure 19. Example of drawing style DRAW_COLOR_ZIGZAG
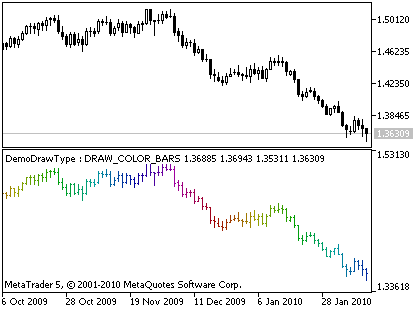
Figure 20. Example of drawing style DRAW_COLOR_BARS

Figure 21. Example of drawing style DRAW_COLOR_CANDLES
How To Approach Empty Value
The different drawing styles show the different charts, so they require the different Buffer-Patterns.
Besides the different Buffer-Patterns, the biggest difference between the drawing-styles is how it approaches the empty values.
So I added an input parameter, that allows you to insert an empty value. Because the aim of this indicator is to demonstrate DrawType, therefore, simply a time to set up part of the null value.
Based on the difference of approach the empty values, all drawing styles can be divided into three categories:

Table 3. Drawing styles divided by categories

Figure 22. Example of drawing style DRAW_LINE (with empty values)
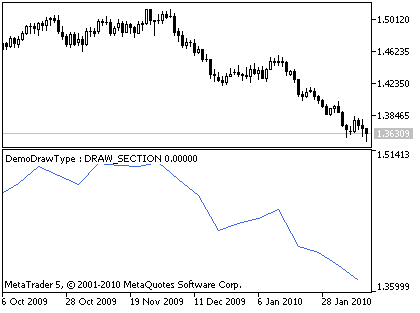
Figure 23. Example of drawing style DRAW_SECTION (with empty values)
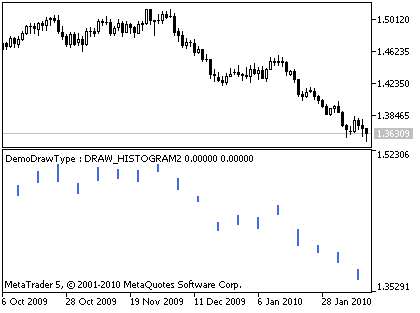
Figure 24. Example of drawing style DRAW_HISTOGRAM2 (with empty values)
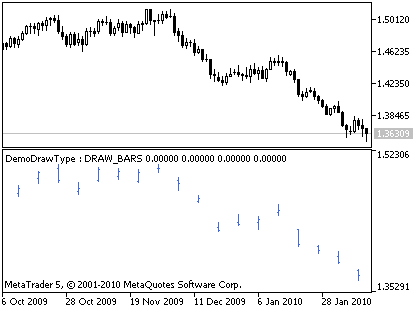
Figure 25. Example of drawing style DRAW_BARS (with empty values)
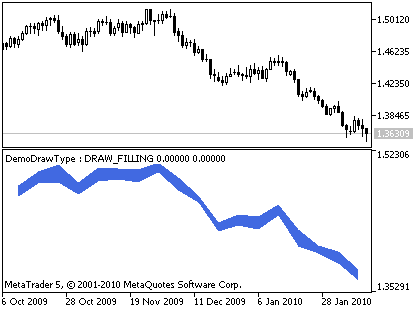
Figure 26. Example of drawing style DRAW_FILLING (with empty values)
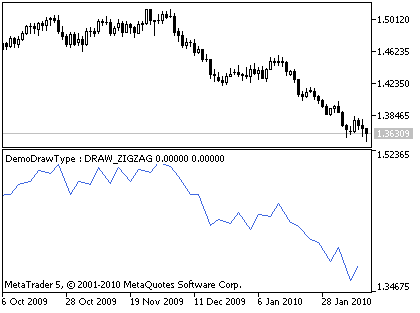
Figure 27. Example of drawing style DRAW_ZIGZAG (with empty values)
![]()
Figure 28. Example of drawing style DRAW_COLOR_ARROW (with empty values)
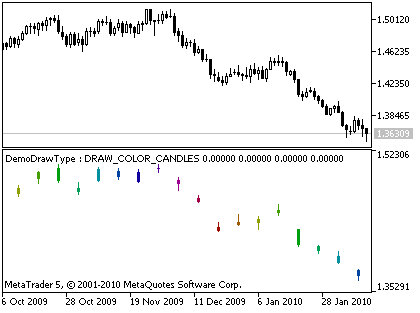
Figure 29. Example of drawing style DRAW_COLOR_CANDLES (with empty values)
The full source code of the indicator:
//+------------------------------------------------------------------+
//|                                                 DemoDrawType.mq5 |
//|                             Copyright 2010, Loong@forum.mql4.com |
//|                             http://login.mql5.com/en/users/Loong |
//+------------------------------------------------------------------+
#property copyright "2010, Loong@forum.mql4.com"
#property link      "http://login.mql5.com/en/users/Loong"
#property version   "1.00"

//#property indicator_chart_window
#property indicator_separate_window // in order to more clearly show
#property indicator_plots   1 //must set, can be bigger than necessary, can not be bigger than indicator_buffers
#property indicator_buffers 5 //must set, can be bigger than necessary
//+------------------------------------------------------------------+
//| DrawType struct, record info about DrawType and Buffer-Pattern   |
//+------------------------------------------------------------------+
struct SLoongDrawType                       // Draw Type
  {
   ENUM_DRAW_TYPE    eDrawType;             // enum of Draw Type
   int               iDrawType;             // value of Draw Type, only used to look
   int               iNumBufferData;        // number of Data Buffer
   int               iNumBufferColor;       // number of Color Buffer
   string            sDrawType;             // string of Draw Type
   string            sDrawTypeDescription;  // string of Draw Type Description, copy from document
  };
//+------------------------------------------------------------------+
//| const array, record info about DrawType and Buffer-Pattern       |
//+------------------------------------------------------------------+
const SLoongDrawType caDrawType[]=
  {
     { DRAW_NONE,              0,    1,    0,    "DRAW_NONE",             "Not drawn" },
     { DRAW_LINE,              1,    1,    0,    "DRAW_LINE",             "Line" },
     { DRAW_HISTOGRAM,         2,    1,    0,    "DRAW_HISTOGRAM",        "Histogram from the zero line" },
     { DRAW_ARROW,             3,    1,    0,    "DRAW_ARROW",            "Drawing arrows" },
     { DRAW_SECTION,           4,    1,    0,    "DRAW_SECTION",          "Section" },
     { DRAW_HISTOGRAM2,        5,    2,    0,    "DRAW_HISTOGRAM2",       "Histogram of the two indicator buffers" },
     { DRAW_ZIGZAG,            6,    2,    0,    "DRAW_ZIGZAG",           "Style Zigzag allows vertical section on the bar" },
     { DRAW_FILLING,           7,    2,    0,    "DRAW_FILLING",          "Color fill between the two levels" },
     { DRAW_BARS,              8,    4,    0,    "DRAW_BARS",             "Display as a sequence of bars" },
     { DRAW_CANDLES,           9,    4,    0,    "DRAW_CANDLES",          "Display as a sequence of candlesticks" },
     { DRAW_COLOR_LINE,       10,    1,    1,    "DRAW_COLOR_LINE",       "Multicolored line" },
     { DRAW_COLOR_HISTOGRAM,  11,    1,    1,    "DRAW_COLOR_HISTOGRAM",  "Multicolored histogram from the zero line" },
     { DRAW_COLOR_ARROW,      12,    1,    1,    "DRAW_COLOR_ARROW",      "Drawing multicolored arrows" },
     { DRAW_COLOR_SECTION,    13,    1,    1,    "DRAW_COLOR_SECTION",    "Multicolored section" },
     { DRAW_COLOR_HISTOGRAM2, 14,    2,    1,    "DRAW_COLOR_HISTOGRAM2", "Multicolored histogram of the two indicator buffers" },
     { DRAW_COLOR_ZIGZAG,     15,    2,    1,    "DRAW_COLOR_ZIGZAG",     "Multicolored ZigZag" },
     { DRAW_COLOR_BARS,       16,    4,    1,    "DRAW_COLOR_BARS",       "Multicolored bars" },
     { DRAW_COLOR_CANDLES,    17,    4,    1,    "DRAW_COLOR_CANDLES",    "Multicolored candlesticks" }
  };

//--- input parameters
input ENUM_DRAW_TYPE InpDrawType    = DRAW_LINE;
input ENUM_LINE_STYLE InpLineStyle  = STYLE_SOLID;
input bool InpShowData        = true;
input uchar InpArrow          = 159;
input int InpArrowShift       = -10;
input int InpDrawBegin        = 10;
input int InpShift            = 10;
input int InpLineWidth        = 1;
input int InpColorNum         = 60;
input color InpPlotColor      = RoyalBlue;
input double InpEmptyValue    = 0.0;
input string InpLabel         = "Value";
input bool InpTestEmptyValue  = false;

//Note: Variables declared at global level must not be mixed up with the client terminal
// global variables that can be accessed using the GlobalVariable...() functions.
//--- you can not change input parameters in code, so you need Global Variables
ENUM_DRAW_TYPE iDrawType      = DRAW_LINE;
ENUM_LINE_STYLE iLineStyle    = STYLE_SOLID;
bool bShowData       = true;
uchar uArrow         = 181;
int iArrowShift      = -10;
int iDrawBegin       = 10;
int iShift           = 10;
int iLineWidth       = 1;
int iColorNum        = 60;
color iPlotColor     = RoyalBlue;
string sLabel        = "";
bool bTestEmptyValue = false;
double dEmptyValue   = EMPTY_VALUE;

//--- indicator buffers
double DC[];   // color buffer
double D1[];   //  data buffer
double D2[];
double D3[];
double D4[];
//+------------------------------------------------------------------+
//| check input parameters.                                          |
//+------------------------------------------------------------------+
bool checkInput()
  {
   if(InpDrawType<DRAW_NONE || InpDrawType>DRAW_COLOR_CANDLES) return(false);
   else iDrawType=InpDrawType;
   if(InpLineStyle<STYLE_SOLID || InpLineStyle>STYLE_DASHDOTDOT) return(false);
   else iLineStyle=InpLineStyle;
   bShowData   =InpShowData;
   uArrow=InpArrow;    //if uArrow>255, MQL5 will set Arrow as uArrow%256
   iArrowShift = InpArrowShift;
   iDrawBegin  = InpDrawBegin;
   iShift      = InpShift;
   iLineWidth  = InpLineWidth;
   iColorNum   = InpColorNum;
   iPlotColor  = InpPlotColor;
//if(InpEmptyValue<=0.0) dEmptyValue=0.0;
//else dEmptyValue=EMPTY_VALUE;
   dEmptyValue=InpEmptyValue;  // It may be not 0.0 or EMPTY_VALUE
   sLabel=InpLabel;
   bTestEmptyValue=InpTestEmptyValue;
   return(true);
  }
//+------------------------------------------------------------------+
//| color well-distributed                                           |
//+------------------------------------------------------------------+
int ColorInc6section(int i,int iBase=63,int iI=0xFF)
  {
   int id  = (int)MathFloor((double)iBase/6.0);
   int ip  = (int)MathFloor((double)iI/id);
   int MA_Rinc=0;
   int MA_Ginc=0;
   int MA_Binc=0;
   color iColor=0;
   if(i<=0)        {iColor =       iI; MA_Rinc=0; MA_Ginc=0; MA_Binc=0;}
   else if(i<1*id) {iColor =       iI; MA_Rinc=  0; MA_Ginc= ip; MA_Binc=  0;}
   else if(i<2*id) {iColor =   257*iI; MA_Rinc=-ip; MA_Ginc=  0; MA_Binc=  0;}
   else if(i<3*id) {iColor =   256*iI; MA_Rinc=  0; MA_Ginc=  0; MA_Binc= ip;}
   else if(i<4*id) {iColor = 65792*iI; MA_Rinc=  0; MA_Ginc=-ip; MA_Binc=  0;}
   else if(i<5*id) {iColor = 65536*iI; MA_Rinc= ip; MA_Ginc=  0; MA_Binc=  0;}
   else if(i<6*id) {iColor = 65537*iI; MA_Rinc=  0; MA_Ginc=  0; MA_Binc=-ip;}
   else            {iColor =       iI; MA_Rinc=  0; MA_Ginc=  0; MA_Binc=  0;}
   int iColorInc=(MA_Rinc+256*MA_Ginc+65536*MA_Binc);
   return iColor+iColorInc*(i%id);
  }
//+------------------------------------------------------------------+
//| Set Plot Color Indexes                                           |
//+------------------------------------------------------------------+
void SetPlotColorIndexes(int plot_index)
  {
   int iIllumination=0xFF;
//color cBack=(color)ChartGetInteger(0,CHART_COLOR_BACKGROUND);
//Print("BACKGROUND is ",cBack);
//if(White==cBack) iIllumination=0x9F; //want to obtain a better visual effect
   PlotIndexSetInteger(plot_index,PLOT_COLOR_INDEXES,iColorNum);
   for(int i=0;i<iColorNum;i++)
      PlotIndexSetInteger(plot_index,PLOT_LINE_COLOR,i,ColorInc6section(i,iColorNum,iIllumination));
  }
//+------------------------------------------------------------------+
//| Set Plot Draw Type and other Properties                          |
//+------------------------------------------------------------------+
bool SetPlotProperties()
  {
//Print("iDrawType="+iDrawType);
   PlotIndexSetInteger(0,PLOT_DRAW_TYPE,iDrawType);
   PlotIndexSetInteger(0,PLOT_LINE_STYLE,iLineStyle);
   PlotIndexSetInteger(0,PLOT_SHIFT,iShift);
   PlotIndexSetInteger(0,PLOT_SHOW_DATA,bShowData);//--- if show indicator data in DataWindow
   PlotIndexSetInteger(0,PLOT_DRAW_BEGIN,iDrawBegin);
   PlotIndexSetInteger(0,PLOT_LINE_WIDTH,iLineWidth);
   PlotIndexSetDouble(0,PLOT_EMPTY_VALUE,dEmptyValue);
   PlotIndexSetString(0,PLOT_LABEL,sLabel);
   switch(iDrawType) //            Data  Color
     {
      case DRAW_COLOR_ARROW:       //1,    1,
         SetIndexBuffer(0,D1,INDICATOR_DATA);
         SetIndexBuffer(1,DC,INDICATOR_COLOR_INDEX);
         PlotIndexSetInteger(0,PLOT_ARROW,uArrow);
         PlotIndexSetInteger(0,PLOT_ARROW_SHIFT,iArrowShift);
         SetPlotColorIndexes(0);
         break;

      case DRAW_ARROW:             //1,    0,
         SetIndexBuffer(0,D1,INDICATOR_DATA);
         PlotIndexSetInteger(0,PLOT_ARROW,uArrow);
         PlotIndexSetInteger(0,PLOT_ARROW_SHIFT,iArrowShift);
         PlotIndexSetInteger(0,PLOT_LINE_COLOR,iPlotColor);
         break;

      case DRAW_COLOR_LINE:        //1,    1,
      case DRAW_COLOR_HISTOGRAM:   //1,    1,
      case DRAW_COLOR_SECTION:     //1,    1,
         SetIndexBuffer(0,D1,INDICATOR_DATA);
         SetIndexBuffer(1,DC,INDICATOR_COLOR_INDEX);
         SetPlotColorIndexes(0);
         break;

      case DRAW_NONE:              //1,    0,
      case DRAW_LINE:              //1,    0,
      case DRAW_HISTOGRAM:         //1,    0,
      case DRAW_SECTION:           //1,    0,
         SetIndexBuffer(0,D1,INDICATOR_DATA);
         PlotIndexSetInteger(0,PLOT_LINE_COLOR,iPlotColor);
         break;

      case DRAW_COLOR_HISTOGRAM2:  //2,    1,
      case DRAW_COLOR_ZIGZAG:      //2,    1,
         SetIndexBuffer(0,D1,INDICATOR_DATA);
         SetIndexBuffer(1,D2,INDICATOR_DATA);
         SetIndexBuffer(2,DC,INDICATOR_COLOR_INDEX);
         SetPlotColorIndexes(0);
         break;

      case DRAW_HISTOGRAM2:        //2,    0,
      case DRAW_ZIGZAG:            //2,    0,
         SetIndexBuffer(0,D1,INDICATOR_DATA);
         SetIndexBuffer(1,D2,INDICATOR_DATA);
         PlotIndexSetInteger(0,PLOT_LINE_COLOR,iPlotColor);
         break;

      case DRAW_FILLING:           //2,    0,
         SetIndexBuffer(0,D1,INDICATOR_DATA);
         SetIndexBuffer(1,D2,INDICATOR_DATA);
         PlotIndexSetInteger(0,PLOT_LINE_COLOR,iPlotColor);
         break;

      case DRAW_COLOR_BARS:        //4,    1,
      case DRAW_COLOR_CANDLES:     //4,    1,
         SetIndexBuffer(0,D1,INDICATOR_DATA);
         SetIndexBuffer(1,D2,INDICATOR_DATA);
         SetIndexBuffer(2,D3,INDICATOR_DATA);
         SetIndexBuffer(3,D4,INDICATOR_DATA);
         SetIndexBuffer(4,DC,INDICATOR_COLOR_INDEX);
         SetPlotColorIndexes(0);
         break;
      case DRAW_BARS:              //4,    0,
      case DRAW_CANDLES:           //4,    0,
         SetIndexBuffer(0,D1,INDICATOR_DATA);
         SetIndexBuffer(1,D2,INDICATOR_DATA);
         SetIndexBuffer(2,D3,INDICATOR_DATA);
         SetIndexBuffer(3,D4,INDICATOR_DATA);
         PlotIndexSetInteger(0,PLOT_LINE_COLOR,iPlotColor);
         break;
     }
   return(true);
  }
//+------------------------------------------------------------------+
//| Custom indicator initialization function                         |
//+------------------------------------------------------------------+
int OnInit()
  {
//--- ArrayInit
   bool bInitBuffer=true;
   if(bInitBuffer)
     {
      ArrayInitialize(D1,dEmptyValue);
      ArrayInitialize(D2,dEmptyValue);
      ArrayInitialize(D3,dEmptyValue);
      ArrayInitialize(D4,dEmptyValue);
      ArrayInitialize(DC,dEmptyValue);
     }
   checkInput();
   SetPlotProperties();
//--- set accuracy
   IndicatorSetInteger(INDICATOR_DIGITS,_Digits);
   IndicatorSetString(INDICATOR_SHORTNAME,"DemoDrawType : "+caDrawType[iDrawType].sDrawType);
   return(0);
  }
//+------------------------------------------------------------------+
//| Custom indicator iteration function                              |
//+------------------------------------------------------------------+
int OnCalculate(const int rates_total,
                const int prev_calculated,
                const datetime &time[],
                const double &open[],
                const double &high[],
                const double &low[],
                const double &close[],
                const long &tick_volume[],
                const long &volume[],
                const int &spread[])
  {
//--- auxiliary variables
   int i=0;
//--- set position for beginning
   if(i<prev_calculated) i=prev_calculated-1;
//--- start calculations
   while(i<rates_total)
     {
      switch(iDrawType) //            Data  Color   if(buffer contain dEmptyValue)
        {
         case DRAW_COLOR_LINE:        //1,    1,      all do not draw
            DC[i]=(double)(i%iColorNum);
         case DRAW_LINE:              //1,    0,      all do not draw
         case DRAW_NONE:              //1,    0,      draw nothing at first
            if(bTestEmptyValue)
              {
               if(i%5==1)D1[i]=high[i];
               else D1[i]=dEmptyValue;
              }
            else
               D1[i]=close[i];
            break;

         case DRAW_COLOR_SECTION:     //1,    1,      link between non-empty place
            DC[i]=(double)(i%iColorNum);
         case DRAW_SECTION:           //1,    0,      connecting adjacent non-empty value
            if(bTestEmptyValue)
              {
               if(i%5==1)D1[i]=close[i];
               else D1[i]=dEmptyValue;
              }
            else
               D1[i]=close[i];
            break;

         case DRAW_FILLING:           //2,    0,
            //DC[i]=(double)(i%iColorNum);
            if(bTestEmptyValue)
              {
               if(i%5==1)
                 {
                  D1[i]=high[i];
                  D2[i]=low[i];
                 }
               else
                 {
                  D1[i]=dEmptyValue;
                  D2[i]=dEmptyValue;
                 }
              }
            else
              {
               D1[i]=high[i];
               D2[i]=low[i];
              }
            break;

         case DRAW_COLOR_ZIGZAG:      //2,    1,
            DC[i]=(double)(i%iColorNum);
         case DRAW_ZIGZAG:            //2,    0,
            if(bTestEmptyValue)
              {
               if(i%5==1)D1[i]=high[i];
               else D1[i]=dEmptyValue;
               if(i%5==4)D2[i]=low[i];
               else D2[i]=dEmptyValue;
              }
            else
              {
               D1[i]=high[i];
               D2[i]=low[i];
              }
            break;

         case DRAW_COLOR_ARROW:       //1,    1,      draw arrow at non-empty value
         case DRAW_COLOR_HISTOGRAM:   //1,    1,      only draw at non-empty place
            DC[i]=(double)(i%iColorNum);
         case DRAW_ARROW:             //1,    0,      draw arrow at non-empty value
         case DRAW_HISTOGRAM:         //1,    0,      only draw at non-empty place
            if(bTestEmptyValue)
              {
               if(i%5==1)D1[i]=close[i];
               else D1[i]=dEmptyValue;
              }
            else
              {
               D1[i]=close[i];
              }
            break;

         case DRAW_COLOR_HISTOGRAM2:  //2,    1,      only draw at non-empty place
            DC[i]=(double)(i%iColorNum);
         case DRAW_HISTOGRAM2:        //2,    0,      only draw at non-empty place
            if(bTestEmptyValue)
              {
               if(i%5==1)
                 {
                  D1[i]=high[i];
                  D2[i]=low[i];
                 }
               else
                 {
                  D1[i]=dEmptyValue;
                  D2[i]=dEmptyValue;
                 }
              }
            else
              {
               D1[i]=high[i];
               D2[i]=low[i];
              }
            break;

         case DRAW_COLOR_BARS:        //4,    1,      only draw at non-empty place
         case DRAW_COLOR_CANDLES:     //4,    1,      only draw at non-empty place
            DC[i]=(double)(i%iColorNum);
         case DRAW_BARS:              //4,    0,      only draw at non-empty place
         case DRAW_CANDLES:           //4,    0,      only draw at non-empty place
            if(bTestEmptyValue)
              {
               if(i%5==1)
                 {
                  D1[i]=open[i];
                  D2[i]=high[i];
                  D3[i]=low[i];
                  D4[i]=close[i];
                 }
               else
                 {
                  D1[i]=dEmptyValue;
                  D2[i]=dEmptyValue;
                  D3[i]=dEmptyValue;
                  D4[i]=dEmptyValue;
                 }
              }
            else
              {
               D1[i]=open[i];
               D2[i]=high[i];
               D3[i]=low[i];
               D4[i]=close[i];
              }
            break;
        }
      //---
      i++;
     }
//--- return value of prev_calculated for next call
   return(rates_total);
  }
//+------------------------------------------------------------------+
Answers Prepared Before Your Questions
Q: It doesn't plot anything.
A: The purpose of this indicator is to make you can test all the drawing styles without writing of code, so if you will enter the wrong parameters, it will not plot, and must not make a fuss.
Q: The caDrawType[] seems useless, it only used to take the name string of DrawType?
A: Ok, I admit, this is my lazy elsewhere copy the past. caDrawType[] in some cases very useful, but we will consider it in the next article.
Conclusion
You can draw anything you wanted to draw.
May the Code be with you.
Warning: All rights to these materials are reserved by MetaQuotes Ltd. Copying or reprinting of these materials in whole or in part is prohibited.
This article was written by a user of the site and reflects their personal views. MetaQuotes Ltd is not responsible for the accuracy of the information presented, nor for any consequences resulting from the use of the solutions, strategies or recommendations described.

 Drawing Indicator's Emissions in MQL5
 Practical Implementation of Digital Filters in MQL5 for Beginners
 Introduction to MQL5: How to write simple Expert Advisor and Custom Indicator
 MQL5 for Newbies: Guide to Using Technical Indicators in Expert Advisors
- Free trading apps
- Over 8,000 signals for copying
- Economic news for exploring financial markets
You agree to website policy and terms of use
>>> You can draw what you want.
I want to draw bicolored candles to additional display the trend.
Bullish candle during uptrend: green border with green filling,
Bullish candle during downtrend: green border with red filling,
Bearish candle during uptrend: red border with green filling,
Bearish candle during downtrend:red border with red filling.
How is this possible? You can find this kind with other platforms.
Unfortunately, this is not possible: when using the DRAW_CANDLES (or DRAW_COLOR_CANDLES) styles, the candle body is obtained WITHOUT a border.
Unfortunately, this is not possible: when using the DRAW_CANDLES (or DRAW_COLOR_CANDLES) styles, the candle body is obtained WITHOUT a border.