YouTubeにあるマーケットチュートリアルビデオをご覧ください
ロボットや指標を購入する
仮想ホスティングで
EAを実行
EAを実行
ロボットや指標を購入前にテストする
マーケットで収入を得る
販売のためにプロダクトをプレゼンテーションする方法
MetaTrader 5のための有料のエキスパートアドバイザーとインディケータ - 26

支持線と抵抗線、そしてローソク足のギャップをチャート上に自動的に表示するため、価格が次に向かう可能性のある場所や反転する可能性のある場所を確認することができます。
このインジケーターは、私のウェブサイト(The Market Structure Trader)で教えているポジショントレード手法の一部として使用するように設計されており、ターゲットとエントリーの可能性のための重要な情報を表示します。 MT4 Version: https://www.mql5.com/en/market/product/97246/ このインジケーターには、2つのコア機能と4つの追加機能があります: コア機能1 - 日足、週足、月足のサポートラインとレジスタンスラインの自動表示 このインジケーターは、直近2日間、最大6週間前、数ヶ月前のサポートレベルとレジスタンスレベルを自動的に引き込みます。これらのレベルの見た目は完全にカスタマイズすることができ、いくつ表示されるかを表示することもできます。これらの重要な水準は、しばしば主要な支持線と抵抗線として機能し、価格が転換して引き戻されたり反転したりする場所
警告、このEAはテスターでは動作しません。 デモアカウントまたは実際のアカウントでのみ動作します。 デモを試してみたい場合は、こちらからお問い合わせください: https://www.mql5.com/en/users/abudabi MT4 version
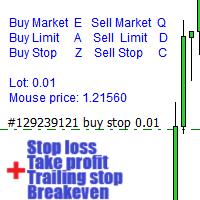
MetaTrader 5でキーボードとマウスから迅速な注文を送信(配置): 希望の価格にカーソルを移動し、キーを押します: 市場で購入:E リミット注文:A ストップ注文:Z 売却市場:Q リミット売却:D ストップ売却:C (キーはカスタマイズ可能) 注文が送信(配置)されたとき、Fast Keyboard Orders MT5は以下で注文を管理できます: ストップロス テイクプロフィット トレーリングストップロス ブレイクイーブン 機能やバグ修正の提案がある場合、または質問がある場合は、 https://www.mql5.com/ru/users/abudabi/ から直接メッセージを送っていただければ幸いです。 「Fast Keyboard Orders MT5」をアップデートします。 完全なパラメータ: boo

MT5からDiscordに完全にカスタマイズ可能なシグナルを送信して、シグナルプロバイダーになりましょう! この製品は、使いやすく視覚的に魅力的なグラフィカルインターフェースで提供されています。設定をカスタマイズして、数分で製品を使用開始できます!
ユーザーガイド+デモ | MT4バージョン | Telegramバージョン デモを試してみたい場合は、ユーザーガイドを参照してください。 MT5からDiscordへの送信者は、戦略テスターで機能しません。
MT5からDiscordへの機能 さまざまなオプションでシグナルを完全にカスタマイズします シグナルの前後に独自のカスタムメッセージを追加します。これには、タグ、リンク、チャンネルなどが含まれます シグナルで絵文字を追加、削除、カスタマイズします。また、すべて削除することもできます シンボルまたはマジックナンバーによって送信する取引をフィルタリングします 特定のシンボルの送信を除外します 特定のマジックナンバーの送信を除外します シグナルと一緒に送信する取引の詳細をカスタマイズします シグナルと一緒にスクリーンショットを送信しま

フラットとトレンドを決定するための指標。 価格が2つのヒストグラムと2つの線(赤と青)のいずれかを下回っている場合、これは売りゾーンです。 このバージョンのインジケーターを購入するときは、1つの実際のアカウントと1つのデモアカウント用のMT4バージョン-ギフトとして(受け取るには、プライベートメッセージを書いてください)!
価格が2つのヒストグラムと2つの線(赤と青)のいずれかを上回っている場合、これは購入ゾーンです。
MT4バージョン: https//www.mql5.com/en/market/product/3793
価格が2つの線の間、またはいずれかのヒストグラムのゾーンにある場合、市場に明確な傾向はありません。簡単に言えば、市場は横ばいです。
インジケーターの動作は、スクリーンショットでより明確に示されています。

現在の、すべての、または選択されたチャートの取引手段を変更し、時間枠を変更し、すべてのチャートを履歴内で(自動的にまたはクリックして)同時に移動するように設計されたユーティリティ。シンボルのリストは、「市場の概要」から読み取られます。ボタンの色、サイズ、位置を変更できます。チャートの同期は、同期ボタンをクリックしたとき、またはマウス/キーボードを自動モードで移動したときに、アクティブなチャートの最初の表示バーの時点で発生します。 TFは、カーソルキー(左/右)と取引記号(上/下)を使用して変更できます。 8つの主要通貨のボタンを使用すると、通貨ペアのリストからチャートを開くことができます(市場の概要またはユーザー文字列から取得)。新しいチャートのテンプレートは、「新しいチャートのテンプレート名」パラメーターで指定できます。通貨を変更すると、現在のチャートのテンプレートが保存され、インジケーターによって開かれたチャートでペアの通貨が置き換えられます。通貨を再度選択すると、対応するテンプレートが読み込まれます。
複製モードでは、オブジェクトを現在のツールのすべてのチャートに一度にコピーでき
Pipfinite creates unique, high quality and affordable trading tools. Our tools may or may not work for you, so we strongly suggest to try the Demo Version for MT4 first. Please test the indicator prior to purchasing to determine if it works for you. We want your good reviews, so hurry up and test it for free...we hope you will find it useful.
Attention This trading tool is specifically designed to help grid, martingale, averaging, recovery and hedging strategies. If you are not familiar with th

MACDインジケーターのトレーディングロボット これはトレーディングロボットの簡易バージョンであり、1つのエントリー戦略のみを使用します(高度なバージョンには10を超える戦略があります)
専門家のメリット:
スキャルピング、マーチンゲール、グリッド取引。
1つの注文または注文のグリッドのみで取引を設定できます。動的、固定、または乗数のステップと取引ロットを備えた高度にカスタマイズ可能な注文グリッドにより、エキスパートアドバイザーをほぼすべての取引手段に適合させることができます。
ドローダウン回復システム、重複する損失注文とバランス保護
グリッド取引がリバウンドしない価格変動に対して脆弱であることは周知の事実ですが、注文回収システムのおかげで、アドバイザーはほとんどのドローダウンから抜け出すことができます。ドローダウンからの脱出は、最も遠い不採算の注文を、利益のある市場に最も近い注文とオーバーラップさせることによって実行されます。取引ロボットは、手動取引または他の専門家によって開かれた取引のために、アカウントの負けたポジションを回復するために使用できます。マジックナンバ

VeMAs インジケータは、出来高動態と市場構造を分析することにより、あなたの取引戦略を強化するために設計された革新的な取引ツールです。 あなたが初心者であろうと経験豊富なトレーダーであろうと、VeMAs はあなたに優位性を与えます。 インジケーターVeMAsが50$ドルで入手可能。オリジナル価格299$
を期間限定でご提供。 価格は上がるだろう。 20.04.2025 日以降、価格はすでに 60 $ Version MT4 Great entry points with VeMAs indicator on XAUUSD for March
各購入者には、 VeMAs インジケータで動作するシンプルな Expert Advisor をプレゼントします。 Expert Advisor はインジケータのシグナルに従って取引を開始するため、インジケータをテストして最適化することができます。 VeMAs インジケーターを購入後、プライベートメッセージでご連絡ください。
市場の出来高と構造は、注視すべき数少ない主要な事柄である。
VeMAsは、出来高の変化と価格の動きを評価するために高度

INTRODUCTION TO GPT SPIKES INDICATOR The GPT Spikes Indicator is a revolutionary trading tool specifically engineered for the Boom and Crash markets on the Deriv platform. It leverages cutting-edge algorithms to provide traders with precise market insights, helping them to detect market spikes and reversal points with unparalleled accuracy. Whether you're new to trading or an experienced professional, the GPT Spikes Indicator offers the precision and customization you need to succeed in the vola
The CAP Equity Guard MT5 is an expert advisor that constantly monitors the equity of your trading account and prevents costly drawdowns. The CAP Equity Guard EA MT5 is a useful tool for money managers! When an emergency procedure takes place, you are notified by visual, email and push alerts. The EA performs the following tasks: It monitors your entire trading account. Easy to use! Just drag it to a random empty chart. It will work perfectly, if MetaTrader restarts. It can be workable with y

This is advanced Multi-Symbol and Multi-Timeframe version of the "Candle Pattern Finder" indicator (search for candlestick patterns based on the book by Gregory L. Morris "Candlesticks charting explained. Timeless techniques for trading stocks and futures" ). The indicator searches for candlestick patterns for ALL symbols of the "Market Watch" window and for ALL standard timeframes from M1 to MN1. When patterns appear on any symbol / timeframe, the indicator gives a signal (text, sound, sending
XC Trade Manager for MT5 Manage Your Trades with Precision and Ease
Welcome to XC Trade Manager, the ultimate solution for traders seeking efficient and intuitive trade management on the MT5 platform. Developed by xignalcoding.com, our seventh product in the MQL5 Market lineup, the XC Trade Manager is designed to streamline your trading experience, allowing you to focus on what truly matters—making informed trading decisions. Key Features 1. Orders Tab Effortlessly place and manage your trades

This is a predictive indicator ( leading indicator ) that uses Bayes' formula to calculate the conditional probability of price increases given the angular coefficient. The indicator calculates the angular coefficient and its regression and uses it to predict prices.
Bayes' theorem is a fundamental result of probability theory and is used to calculate the probability of a cause causing the verified event. In other words, for our indicator, Bayes' theorem is used to calculate the conditional pro

One of the most powerful and important ICT concepts is the Power of 3. It explains the IPDA (Interbank Price Delivery Algorithm) phases. PO3 simply means there are 3 things that the market maker's algorithm do with price:
Accumulation, Manipulation and Distribution
ICT tells us how its important to identify the weekly candle expansion and then try to enter above or below the daily open, in the direction of the weekly expansion.
This handy indicator here helps you keep track of the weekly and
Fundamental Signals Indicator is a Non-Repaint Indicator with a powerful calculation engine that can predict market movement over 3000 pips (30000 points). The indicator does not analyze the market fundamentally, it is named fundamental because it can predict trends with large movements, no complicated inputs and low risk. Also Indicator can alert on market trend changes.
Using Indicator :
The Indicator is very simple and without complicated input parameters. (No need to optimize anything.)T

Unlock the Power of Market Analysis with Precision Are you ready to take your trading to the next level? The "Institutional Volume Profile" indicator is here to empower your trading decisions like never before. Key Features: Custom Volume Profiles : Plot volume profiles effortlessly by simply adding horizontal lines or Fibonacci tools on your MetaTrader 5 chart. There's no limit to how many profiles you can create. Insightful Visualization : The indicator beautifully displays crucial information

Very powerful indicator! converted from TradingView with upgraded alerts and added notifications. Ideal use in EAs.
Use as a supplementary Indicator to confirm your entries, but it is as good on it's own.
The indicator consists of 3 different Trend Meters and a 2 Trend Bars which are used to confirm trend
How to Use:
The more Trend meters are lit up the better =>>
-more GREEN COLOR at one bar means more confirmation to open buy trade,
- more RED COLOR signals for one bar = more confirmat

简介: 六彩神龙指标【MCD Hot Money】进是一种常用的技术指标,被广泛应用于股票交易中。它由六人不同的指标组成,包括均线、相对强弱指标井、移动平均收盘线等。这人指标可以有效地帮助投资者确定股票的买入和卖出时机。 六彩神龙用来看筹码了解庄家动向。看个股买卖少踩炕,少被套;跟庄吃肉,用于判断个股趋势!
指标设置 : hot_money_sensitivity = 0.7; // Hot Money Sensitivity hot_money_period = 40; // Hot Money Period hot_money_base = 30; // Hot Money Base banker_sensitivity = 1.5; // Banker Sensitivity banker_period = 50; // Banker Period banker_base = 50;

| Seamless portfolio of trading systems in your palm - Powered by ONNX Neural network | Built by a grid trader >> for grid traders. This is MT5 version, click here for Blue GAIA MT4 (settings and logics are same in both versions) Real monitoring signal --> Cosmic 2 | GAIA Intro Blue GAIA EA (' GAIA ') - is the latest edition of BlueAlgos family, uniting all the best algos and features under one-roof. Its is the true 4xMulti Systems: +------------------------------------------------
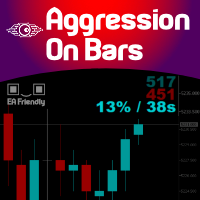
Imagine a Buy and Sell Pressure monitor on your chart that shows in REAL-TIME this data, bar by bar? Well, imagine no more. We present you an exclusive creation of Minions Labs : Aggression On Bars indicator. On every new bar on you chart this indicator will start counting in real-time the BUY/SELL pressure and present this data statistics directly inside your chart. As soon as a new bar is created in your chart, the counter restarts. Simple and effective. Just watch the video to see it running

NEW : integration with Ofir Signals to send personalized alerts Ofir Notify is a tool which send alerts on trades to Telegram Alert on any event concerning a position : Opening, Closing, modification (SL, TP) Send alerts to Chats, Groups and Channel Alert on Equity change Display Risk, Reward and progress of profit/lost for each position Customization of alerts Sending charts screenshots with alerts Send signals from your indicators or experts Multi-lingual NEW : version 2 brings integrati

G-Labs Market Maker Dashboard - Exclusive Seasonal Offer Elevate your trading with the original G-Labs Market Maker Dashboard, available for a limited time at just $70 USD. Ideal for starter traders, this dashboard has been enhanced with new features and now includes a comprehensive training video. This indicator is for people trading the market makers method and is the entry level dashboard for that strategy is available for both mt4 and mt5. its a market scanner in real time showing peak forma

Adaptive Volatility Range [AVR] - is a powerful tool for identifying key trend reversals. AVR - accurately displays the Average True Volatility Range taking into account the Volume Weighted Average price. The indicator allows you to adapt to absolutely any market volatility by calculating the average volatility over a certain period of time - this provides a stable indicator of positive transactions. Thanks to this , Adaptive Volatility Range has a high Winrate of 95% There are two ways t
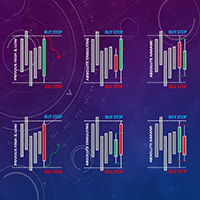
Configuration for XAUUSD is in the provided image below:
!!RULE: Spread Must Be Maximum at 30points, Leverage 1:500 or HIGHER!!
Simple describe follow the above configuration(100$ open 0.1Lot): 1, Fixed lot size 2, Always use SL 3, Always use Trailing SL (to maximize PROFIT) 4, Only one trade(one BUY or one SELL) per day 5, No Grid 6, No Hedge 7, No Arbitrage 8, No Martingale 9, No Compound 10, Another many function and many more to do the back test This EA is so simple to use and especially n
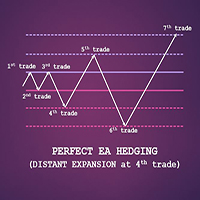
Hedging was known as "100% Winning Strategy" in many decade before. But it doesn't seem right in the side-way market. If you put Hedging distant too close, it will entry as more as the side-way stay. If you put Hedging distant too far, it would never hit the BEP before the account blown.
So, now "EA by CAPO" brought to you the new generation of Hedging that help user avoid the Risk from side-way market. We let the EA observe first 3trades with the same distant and it increase the distant at 4th

"Volality 75 Boom Crash VIX" is an advanced analysis tool designed to identify key breakout zones in volatile asset pairs and boom crashes. Its focus is on highlighting moments of high volatility in the market.
This indicator is perfect for both scalping and swing trades.
"Volality 75 Boom Crash VIX is not just an indicator, but a trading strategy in itself.
The most recommended timeframe for using the indicator is 15M MINUTES.
The breakout levels represent the balance between bullish and b

Capture Spikes and hold for a long time. Let the Trailing stop follow the Price into profit. Not for Both Boom and Crash, Just for Boom Only. Once it spots a Setup, the EA will enter and you do not need to worry much about drawdown, this EA was tested on a $100 account and maximum drawdown was 9%, with the maximum consecutive losses recorded of $36. Those who ever bought from me know that I provide support promptly if you want to set up or need a Customized approach. Please note that the EA

Volatility Master for MetaTrader is a real-time dashboard tool that scans up to 30 symbols to identify high-volatility, trending markets instantly. With clear bullish/bearish signals, customizable alerts, and a user-friendly interface, it helps you avoid range-bound conditions and focus on high-probability trades. Clarity leads to confidence. This is your chance to trade confidently and protect your capital effectively, don't miss the opportunity that you might regret later! Download Metatrade

BW Automate - советник для автоматической торговли по сигналам системы Билла Вильямса:
Пробой уровня фрактала Линия Баланса Торговля в зоне !!! Позиции будут открываться только когда цена находится ЗА линиями Аллигатора
Основные возможности советника . Торговля в следующих режимах:
Безостановочная торговля в направлениях - Buy/Sell/Или обоих Торговля от уровня и до бесконечности
Торговля от уровня до уровня Варианты 2 и 3, плюс фильтр по заданной МА (торговать только когда цена находится выше/н

Trailing Stop Universal MT4 / MT5 utility is a multifunctional tool for protecting floating profit on open positions and reducing possible risks in trading. To realize these goals, the tool offers the user the following features. Breakeven function - transfers a position to breakeven when the profit of the position allows it. If this function is enabled and the conditions of its operation are met, it moves the StopLoss order to the opening price of the position or even to the profitable
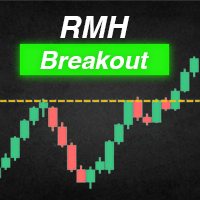
RMH Breakout is a high-performance Expert Advisor developed based on a trend-following strategy. This EA is specifically optimized for index markets and offers fully automated trading capabilities. Key Features: Strategy Type: Trend-following strategy Defines entry conditions using RSI and price high values. Filters: EMA Filter: Checks whether the price is above or below the EMA. Daily Bias Filter: Opens trades in the direction of the daily bias. Time-Based Filtering: Operates only during speci
Deriv Volatility Bot は、 Derivのボラティリティ・インデックス資産 向けに特別に設計された、強力で使いやすいトレーディングアルゴリズムです。広範なバックテストとリアル市場での使用を経て、このEAは シンセティックインデックスの特性 に適応するよう慎重に調整されました。 このEAは Derivのボラティリティ・インデックス資産向けに最適化 されていますが、 通貨ペアや金(ゴールド)などの他の金融商品 にも使用できます。ただし、特殊な設計により、 Derivのシンセティックインデックスで最高のパフォーマンス を発揮します。 このEAは 非常に使いやすく、4つの入力パラメータのみで設定可能 なため、初心者から経験豊富なトレーダーまで幅広く利用できます。これらのパラメータにより、さまざまな設定でバックテストを実行し、各資産に最適な構成を見つけることができます。ただし、説明に添付されているスクリーンショットは デフォルト設定 で実施されたものです。 入力パラメータ: 1回の取引でいくら($)リスクを取るか? – 取引ごとのリスク額(米ドル)を設定します。 RRR(リスク

メタトレーダー用ボリュームプロファイルインジケーターで、ボリューム分析の威力を実感してください! / MT4バージョン
ベーシックボリュームプロファイルは、取引の最適化を目指すマニュアルトレーダーのために特別に設計されたインジケーターです。ボリューム・プロファイル・インジケータは、市場の動きをより深く理解したい本格的なトレーダーにとって不可欠なツールです。当社の革新的なソリューションにより、取引量が価格にどのように分布しているかを明確かつ簡潔に視覚化することができます。これにより、支持線・抵抗線、集積・分配ゾーン、重要なコントロール・ポイントなど、主要な注目エリアを特定することができます。特定の日の取引量を表示する通常の出来高インジケーターとは異なり、ベーシック・ボリューム・プロファイルは特定の価格における取引量を表示します。
当社のインジケータは、直感的でカスタマイズ可能なインターフェイスを備えており、お客様の取引の好みに合わせてカスタマイズすることができます。
特徴 価格チャート上に出来高プロフィールを明確に表示。 出来高の多いエリアと少ないエリアを素早く識別。 取引ス
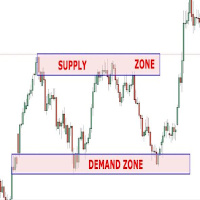
This Expert Advisor can be applied to many markets because It exploits basic supply/demand and price action concepts. It identifies the major rotation zones (PRZ), supply and demand zones and supports and resistances within major price trends. It buys at discount zones and sells at premium prices. It can and should be optimized through the Metatrader tester to find the best parameters to use for current market conditions. This is not a fixed strategy rather a full trading algo that will find whi

[signal] [ back test $10k to $94million ] [ back test risk% = 0.10 ] [ back test risk% = 0.2 0 ] [single symbol settings] [set files] [ inputs explained ] ******Live Signal +107.00% (26/02/2025)********** RTR No Hard Stop Losses algo EA for MT5 Load this EA onto any Forex M5 chart like EURUSD/GBPUSD/USDJPY has to be a 24hr market . High win rate approx. 78.00% Trend following with high % win rate . No Martingale . There is a trailing stop for all trades on the higher timeframe . Multiple Symbo

このアドバイザーは次の機能を提供します。 ポジションをオープンする: 価格がトレンドラインを超えたら、ロング注文またはショートオーダーをオープンします。 クローズ: 価格がトレンドラインを超えたら、ロングポジションまたはショートポジションをクローズします。 トレーリングストップロス – EA はトレンドラインに沿って、ロング注文のストップロスを増加させたり、ショート注文のストップロスを減少させ続けます。 ラインはトレンドラインでも水平線でも構いません。 傾向線は半径または線分にすることができます。線分には、その線が存在する期間のみ取引するという特別な機能があります。 ポジションをオープンおよびクローズできるこれらのラインには、特定の名前が付いています。 EA では、手動で線を描画する代わりに、線描画パネルを提供します。 すべてのオープンポジションとクローズポジションのスクリーンショットは、MQL5/Files/Cross Trend Line to Trade フォルダーに保存されます。 EA はヘッジ口座でのみ機能します
バージョンMT4 : https://www.m

The market is unfair if only because 10% of participants manage 90% of funds. An ordinary trader has slim changes to stand against these "vultures". This problem can be solved. You just need to be among these 10%, learn to predict their intentions and move with them. Volume is the only preemptive factor that faultlessly works on any timeframe and symbol. First, the volume appears and is accumulated, and only then the price moves. The price moves from one volume to another. Areas of volume accumu
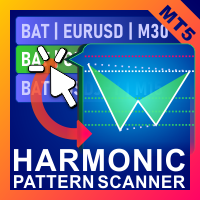
高調波パターン EA 説明を読む代わりにライブチャートでこれを確認したい場合は、 ここから無料のデモをすぐにダウンロードできます。 含まれているパターン:
ABCDパターン ガートレーパターン バットパターン 暗号パターン 3ドライブパターン ブラックスワンパターン ホワイトスワンパターン カジモドパターンまたはオーバーアンダーパターン Altバットパターン 蝶のパターン 深いカニ柄 カニ柄 サメ柄 FiveOパターン 頭と肩のパターン 昇順の三角形のパターン ワンツースリーパターン そして8つのカスタムパターン Voenixは、マルチタイムフレームおよびマルチペアのハーモニックパターンスキャナーであり、25のチャートおよびフィボナッチパターンをサポートします。カスタムブロック光学アルゴリズムを利用し、再描画なしで、確認ステップに依存せずに可能なパターンを迅速に発見できます(ジグザグ計算とは異なります)。 )。 選択したパターンを自動的に交換したり、通知を送信したり、テーブルに収集して簡単にアクセスして評価したりできます。 取引には最大3つの利益目標があり、各目標で成約された注文の
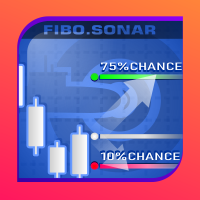
フィボナッチ ソナー
フィボナッチ ソナーには、28 のシンボルと 7 つの時間枠から収集された価格アクション パターンの内部ライブラリがあります。 各パターンは 2 つのサイドに分割されます。前サイドと後サイドです。フィボナッチ ソナーは前サイドを使用して類似パターンを認識します。最新のバーの始値までの最新の価格アクション (任意の時点) が、ライブラリの検索に前サイドとして使用されます。
後サイドには、各パターンで発生したすべてのアクティビティの集計が保持されます。ここでフィボナッチ項が登場します。過去の各パターンのすべてのインスタンスの始値から、始値の上と下の価格レベルをフィボナッチ シーケンスで展開しました。次に、価格レベルに到達した回数を測定しました。価格レベルに到達した回数を、1 つの個別の価格パターンに存在するインスタンスの数で割ると、パーセンテージ (%) として抽出できます。
当然、各パターンには、上部のフィボナッチ価格と下部のフィボナッチ価格にパーセンテージがあることが想像できます。これにより、% 値を指定して価格を見つけるメソッドが可能になります。たとえば、
CAP Stochastic EA Pro MT5 trades using the Stochastic Indicator. It offers many customizable Stochastic trading scenarios and flexible position management settings, plus many useful features like customizable trading sessions, a martingale and inverse martingale mode. [ Installation Guide | Update Guide | Submit Your Problem | All Products ]
Before buy Pro version? You can buy alternation pro version, our powerfull EA, CAP Strategy Builder EA . This is strategy builder EA. It product

The Gann Box (or Gann Square) is a market analysis method based on the "Mathematical formula for market predictions" article by W.D. Gann. This indicator can plot three models of Squares: 90, 52(104), 144. There are six variants of grids and two variants of arcs. You can plot multiple squares on one chart simultaneously.
Parameters Square — selection of a square model: 90 — square of 90 (or square of nine); 52 (104) — square of 52 (or 104); 144 — universal square of 144; 144 (full) — "full" v
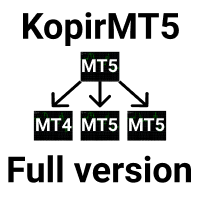
KopirMT5 (CopierMT5) - transaction copier for the MetaTrader 5 terminal, copies (synchronizes, duplicates) transactions from hedge accounts (copier, copy dealers).
Supports copying: MT5 <-> MT5, MT4 -> MT5 Hedge, MT5 Hedge -> MT4 Does not support copying MT5 Hedging < - > MT5 Netting, MT4 < - > MT5 Netting Free version for test
Why exactly our product? The copier has a high speed and is not dependent on ticks. Copy speed - less than 0.5 sec. Transactions are copied with high accuracy, the

注意! 購入後はすぐにご連絡ください。詳細な設定手順やおすすめをご提供します! Maksimus EA MT5 は、高度にプロフェッショナルな外国為替トレーディングエキスパートアドバイザーで、自動化されたトレーディングを可能にします。このエキスパートは、強力なトレンド分析アルゴリズムと柔軟なポジション管理ツールを組み合わせており、資金の安定性と成長を目指すトレーダーにとって欠かせない存在です。 固定ロットでのトレーディングにも、資金残高とリスクレベルに基づいた動的ロット計算にも対応しています。この柔軟性により、トレーダーは自身の好みや戦略に合わせて調整が可能です。 GBPUSD以外の通貨ペアで運用するには、個別の最適化が必要です。これにより、それぞれの通貨の特性に合わせた戦略が可能となり、トレーディングの結果を向上させることができます。 アドバイザーの特徴: トレンド分析: Maksimus EA MT5は、信頼性の高いWPR(Williams Percent Range)などの指標を用いて、トレンドを正確に識別しポジションを開きます。 損失なしのトレーディング: このア

Dominate the Bitcoin Market with Our M15-Optimized EA! Are you looking for an automated trading system that combines advanced technical analysis with professional risk management? Introducing BTC High Ratio , an Expert Advisor designed to trade Bitcoin on the M15 timeframe , using a volatility and trend-based strategy. Check out the results and join the traders already achieving consistent profits! Statistical Results of the System Our EA has been thoroughly backtested, and the resul

Binance Trade Manager — is an utility that allows you to transmit trade orders from your MetaTrader 5 to the Binance exchange. It will suite you if you want to use your favorite MetaTrader 5, getting all the benefits of trading cryptocurrencies directly on the exchange (low commission, high liquidity, absolute transparency, etc.) Binance Trade Manager can work in two modes: copying trades from a demo-account , which your MetaTrader 5 is connected to (cryptocurrencies must be available on this ac

This service is designed to stream online cryptocurrency quotes from the Binance exchange to your MetaTrader 5 terminal. You will find it perfectly suitable if you want to see the quotes of cryptocurrencies in real time — in the Market watch window and on the MetaTrader 5 charts. After running the service, you will have fully featured and automatically updated cryptocurrency charts in your MetaTrader 5. You can apply templates, color schemes, technical indicators and any non-trading tools to

**Verve AI** Reversal Pro Indicator Pro – The powerful AI tool that accurately detects market reversals. With precision, it identifies key turning points and highlights crucial support and resistance levels. Whether you're navigating volatile trends or finding the perfect entry or exit, **Verve AI** simplifies complex data into clear, actionable signals. Trade smarter with the most reliable reversal indicator, powered by advanced artificial intelligence.

This indicator allows you to enjoy the two most popular products for analyzing request volumes and market deals at a favorable price: Actual Depth of Market Chart Actual Tick Footprint Volume Chart This product combines the power of both indicators and is provided as a single file. The functionality of Actual COMBO Depth of Market AND Tick Volume Chart is fully identical to the original indicators. You will enjoy the power of these two products combined into the single super-indicator! Below is

This EA is for small(100$ to 1000$) or Big account trading , No martingual, No grid , No Hedging , only price action and advance money managment with trailing stop and stable account risk per trade! . As I am new to the platform, I allow you to try my tool starting from: Reduced price of $119.99. The price will increase by $150 after 100 purchases. Final price $999. Scalping Crypto Forex Indices EA is designed to trade on your personnal account and on pro firm account , and the EA is designed

What is this indicator?
このFX検証ソフトは MT5でリアルトレードのように過去検証するためのインジケーター です。 共通の垂直線を移動するごとに、 全てのチャートの表示位置を共通の垂直線を基準に同期します 。 チャートモードを切り替えれば、 リアルトレードのように過去検証することも、チャート全体を見て過去検証することも可能 です。
How to set up
1. 対象の通貨ペアのチャートを過去方向に最後までスクロールして ヒストリカルデータを全てダウンロード します。 2. このインジケーターを各チャートの メインウィンドウにインストール します。 3. このインジケーターのプロパティ画面のインプットタブで 各パラメーターをカスタマイズ します。
How to use
1. 共通の垂直線を同期したい位置のローソク足に重ねて チャート位置を同期 します。 2. 必要に応じて チャートモードを変更 します。 3. 各チャートを比較して チャートパターンを検証 します。
Unique objects Common Thread : 各チャートの位置を同期

CAP Moving Average Pro EA trades using the Moving Averages Indicator. It offers many customizable Moving Averages trading scenarios and flexible position management settings, plus many useful features like customizable trading sessions, a martingale and inverse martingale mode. [ Installation Guide | Update Guide | Submit Your Problem | FAQ | All Products ]
Before buy Pro version? You can buy alternation pro version, our powerfull EA, CAP Strategy Builder EA . This is strategy bu
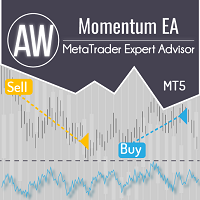
完全に自動化された取引システム。現在の値動きの方向に働きます。価格変動の継続方向のモメンタム指標レベルの内訳は、シグナルとして使用されます。取引の平均化と、バスケットの最初と最後の注文を閉じる機能を使用します。高度なダッシュボードと 3 種類の通知があります。 問題解決 -> こちら / MT4版 -> こちら / 説明書 -> ここ 利点:
バスケット注文の高度なフィルタリング 簡単なセットアップと直感的なパネル インターフェイス 完全自動取引システム
あらゆる種類の商品とあらゆる時間枠に適しています 3種類の通知があります 内蔵オートロット ストラテジー: ポジションオープン オシレーターレベルが下から上へのモメンタムの上限境界を破ると、EA はロングポジションを開きます。
EA は、上から下へのモメンタム レベルの下限境界線のブレイクアウトでショート ポジションを開きます。 ポジションを閉じる ポジションを決済するには、ポイント単位で仮想テイクプロフィットを使用します。仮想テイクプロフィットはブローカーには見えません
注文が損失になると、平均化が開始さ

TW Trend Sniper:最高のトレンド戦略
TW Trend Sniper インジケーターは、高度なテクニカル分析技術を巧みに組み合わせて、市場動向を正確に特定し、利益を生む取引のタイムリーなシグナルを受け取るのに役立ちます。Trade Wizards の独自の方式と、プライス アクション分析、フィボナッチ レベル、その他のテクニカル分析ツールにより、正確で信頼性の高い取引シグナルが提供されます。このインジケーターは、プロのトレーダーと熟練したプログラマーの共同作業の結果であり、トレーダーに強力で効率的なツールを提供するように設計されています。
金融市場における参入ポイントと退出ポイントを正確に予測し特定するための強力なツールをお探しですか? 「TW Trend Sniper」製品は、最先端のテクノロジーと人工知能アルゴリズムを活用し、正確で信頼性の高い取引シグナルを提供します。
金融市場でのテクニカル分析と利益創出のためのプロフェッショナルで強力なツールをお探しなら、この製品が最適です。この製品を使用すると、次のことが可能になります。 時間を節約: 正確な信号に頼るこ
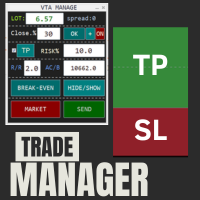
This is a trade manager which is designed to simplify your trading experience and allow you to enter any type of trade with the set risk management within seconds. This trade manager has two modes. (1) The Market order which opens instant orders and the pending orders which consists of buy stop order, buy limit orders, sell stop orders, sell limit order, all these trades can be achieved by moving your stop loss and entry to the desired point and the givn trade will be opened. You do not need to

This is a simple and very effective utility for closing orders with one click. You will need it if you have a number of open orders on your balance and it takes too long to close them manually, which might lead to an extra loss of money on the account. The utility consists of an external panel with two buttons " Close by Filter" and " Close ALL" , which is convenient to move around the graph. You can set the Close ALL utility so that orders are closed as soon as the specified profit or loss va

グローバル・マーケット・ヒドゥン・トレンドEAは、隠れた市場パターンや資産の価格の非効率性を特定することを目的とした統計的アービトラージ戦略に基づいています。ビッグデータ分析を用いて市場を包括的に分析し、EAは異常値や過大評価または過小評価された資産を特定します。このEAは、市場の非効率性とそれがもたらす機会を活用することに重点を置いています。
プロ モーションオファー: 割引価格: $1,000(通常価格: $1,500) 1か月サブスクリプション: $50(通常価格: $150) このプロモーションオファーは、 2025 年 1 月 25 日まで有効です 。 重要なお知らせ: 私たちのアルゴリズムは、強化学習を含む高度な機械学習技術を通じて、毎日新しいデータから学び、市場の変化に適応し続けます。このプロセスは、当社のサーバー上で行われる大規模な計算分析を伴います。最新の市場データに基づいて、毎週アルゴリズムの更新をリリースします。最適なパフォーマンスを確保するために、最新バージョンをダウンロードし、取引ターミナルに適用することでEAを定期的に更新することが重要です。 主要な機能:
This is Boleta Long & Short NT-HDG, an Expert Advisor created with the function that will make operations carried out in Long & Short much easier.
> With just one click it is possible to mount a position in two assets simultaneously, further accelerating your actions right after the decision has been made.
> With it, it is also possible to operate in Hedge accounts, being able to set up positions in the same asset, for those who have strategies for this purpose.
> Can be used in multiple mar

Identify Pinbar Candle Pattern with Arrows & Alert (built-in RSI filter).
This indicator helps you to identify Pin bar Candlestick Pattern (or shooting star & hammer pattern) on the chart with arrows, along with an alert when a new Pin bar appears. Pin bar pattern is one of the most important reversal Price Action signals.
You can set Minimum Percent of Wick (or Tail) Length over full bar length (Recommended: 60%, 70%, 75%).
Alerts can be turned on and off: Popup Email Push Notification Soun

This indicator paints any Inside Bar found on the attached chart in a Dark Gray Colour with Black Borders and Wicks. If there are multiple consecutive Inside Bars, then they would also be successively painted Dark Grey with Black Borders and Wicks as well. You may opt to change the colours set by default in order to better contrast with your chosen background and chart colours. I made this Indicator out of necessity as my trading required it. But I know there may be others out there who may need

O indicador precisa do times and trades (time and salles) para seu correto funcionamento.
O Volume é composto por ordens à mercado compradoras e vendedoras que agrediram o book de ofertas, o Delta é a diferença das ordens a mercado compradoras e vendedoras.
O CoioteDeltaCandle monitora o time and trades e à partir dos dados de agressão forma candles temporais em 4 formatos diferentes, possível selecionar à partir de configurações.
São elas:
Modo com acumulação.
Modo com pavio.
Modo inverter.
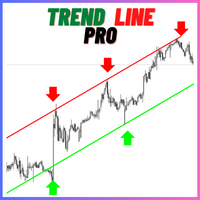
Description: For a comprehensive understanding of our indicators, we invite you to explore the entire Q&A section within this MQL5 blog post here . The Trend Line Detector Indicator is a powerful tool designed to assist traders in identifying and drawing trendlines with precision and efficiency. This indicator simplifies the process of trendline analysis by automatically detecting significant price levels and drawing trendlines based on these levels.
Key features of the Trend Line Detector
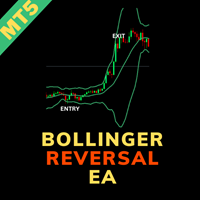
The Bollinger Band Strategy EA MT5 is an automated trading tool tailored to capture trading opportunities based on Bollinger Bands' reversal conditions. This EA executes buy or sell trades upon detecting a bullish reversal near the lower band or a bearish reversal near the upper band. A bullish reversal is identified when the previous candle closes below the lower band, and the current candle closes above the lower band, transitioning from a red to a green candle. Conversely, a bearish reve

Advanced Trading Chaos The main purpose of the indicator is to help the trader detect the signals described by Bill Williams in his books to make a quick and correct trading decision.
1)Bullish/Bearish Reversal Bar(BDB) 2) Divergent Bar(DB) 3) Second Sage Signal — the third consecutive Awesome Oscillator bar 4) Working fractals (Fractals that worked above/below the red forehead 5) Three bar coloring modes
5.1) Coloring of bars according to the AO indicator (Including the squatting bar)
5.2

Big Candle Scanner Dashboard MT5 The Big Candle Scanner Dashboard is a powerful tool for detecting significant bullish and bearish candles across multiple currency pairs and timeframes. Designed for professional and retail traders, it provides real-time insights into market movements with customizable alerts and a user-friendly interface. For detailed documentation click here For MT5 version check here Big Candle Scanner Dashboard MT4
Multi-Currency Scanning: The scanner supports all major
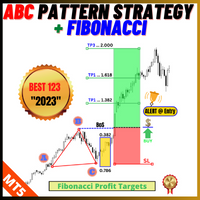
Description: The "ABC Pattern Strategy With Fibonacci" Indicator is a sophisticated technical analysis tool meticulously designed to recognize and leverage the power of the ABC chart patterns in combination with Fibonacci levels. This cutting-edge strategy empowers traders to make well-informed decisions in the dynamic forex market. By making spotting ABC patterns on price charts an easy task, the indicator offers insights into potential trend reversals or continuations. It seamlessly incorpora
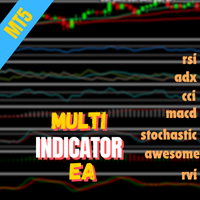
Multi Indicator Strategy EA for MetaTrader 5 Introduction: The Multi Indicator Strategy EA for MetaTrader 5 is an advanced tool designed to automate trading activities by combining multiple indicator signal confirmations. This EA executes buying or selling actions based on specific conditions: when the enabled/selected indicator conditions satisfied for buy or sell. It allows efficient management of trades within these predefined parameters. For detailed documentation Overall Settings/Input Gui

Orders SL and TP Values Show これは、メインチャートの線上に利益と損失の値を表示するインジケーターです。さらに、ポイントでの距離も表示されます。
このインジケーターの特徴は次のとおりです。
スワップ値を含めるオプション。これにより、注文のストップロスとテイクプロフィット値をより正確に計算できます。(デフォルトで有効) 価格値の左側にチケット番号を含めるオプション。これは、ターミナルのツールボックスに従ってレベルを識別するのに役立ちます。(デフォルトで無効) 値がストップロスかテイクプロフィットかに関係なく、利益が出ている場合は青で塗りつぶされ、損失が出ている場合は赤で塗りつぶされます。 同じ値の異なるチケットのストップロスまたはテイクプロフィットが2つ以上存在する場合、それぞれを正しく識別できるように、チケット番号とともに情報がランダムに回転されます。 値は、アカウントにある通貨で表示されます。ポイントも表示されます。 色または距離は、入力パラメータを使用して調整できます。 カウンターには、一致したチケットの合計数(ストップロスまたはテイクプロフィット値
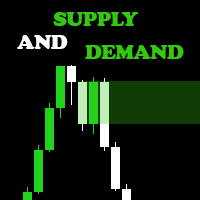
Are you ready to elevate your Forex trading game? Introducing the Supply and Demand Indicator , a powerful tool designed to help traders identify key market zones and make informed decisions with confidence! Key Features: Accurate Zone Identification : Our indicator pinpoints critical supply and demand zones, allowing you to spot potential reversal points and areas of price consolidation. User-Friendly Interface : With an intuitive design, you'll easily navigate through the settings and customiz

This utility ensures a real-time synchronization of multiple charts. Any event of a graphical object creation/modification/deletion, chart scrolling and zooming is copied from the current source chart to one or more receiving charts. Note: demo-version of this product doesn't work in the backtester! ______________________________________________________________ Settings: Synchronize with - select the receivers: Same symbol - all charts with the same symbol; Same symbol - all charts with the same
A simple indicator to help showing the remaining time until the candle closes for all pre-defined chart periods with the following formats depending on which timeframe the chart is on. DD:HH:MM:SS - in case of W1, and MN period HH:MM:SS - in case of other periods Included with some of configurations as follows (please see attached inputs screenshot) X/Y distance to the upper right corner of the chart window Text size Text color Show/hide
MetaTraderマーケットは、履歴データを使ったテストと最適化のための無料のデモ自動売買ロボットをダウンロードできる唯一のストアです。
アプリ概要と他のカスタマーからのレビューをご覧になり、ターミナルにダウンロードし、購入する前に自動売買ロボットをテストしてください。完全に無料でアプリをテストできるのはMetaTraderマーケットだけです。
取引の機会を逃しています。
- 無料取引アプリ
- 8千を超えるシグナルをコピー
- 金融ニュースで金融マーケットを探索
新規登録
ログイン