适用于MetaTrader 5的付费EA交易和指标 - 26

Welcome! We are delighted to introduce our latest expert, which is a semi-automatic trading system that includes all the features you need for position management. Simply draw a line on a significant trend or supply-demand level, and the expert will take care of the rest for you. It comes with a wide range of risk management and position management tools, such as trailing stop, partial closure, break even, determination of stop loss and take profit levels using ATR, as well as automatic lot sizi

Do you believe that financial markets and celestial bodies operate in separate realms? Our indicator begs to differ! Based on the innovative theory of William Gann, which emphasizes the influence of celestial planet movements on financial market dynamics, we present to you the "Gann Planetary Lines Indicator". Features of the Indicator : Precision : Accurate projection of the 360 degrees of planetary orbits onto price charts. Advanced Customization : Ability to display or hide any planet line,

Buy and Sell Grid is an expert advisor that uses mechanical strategy to trade on any timeframe and any currency pair. BUY and SELL GRID EA lets you choose between three types of grid trading strategies whether you want to trade sideways, uptrend or downtrend market. To make things easier for our users, we developed a interactive graphical panel that shows you all relevant information about EA inputs and your account.
STRATEGY Grid strategy is pure mechanical strategy, this EA has three types

本指标可以让您享受两个最流行的产品来分析在感兴趣的价位的请求量和市场成交量: 真实市场深度图表 真实报价足迹成交量图表 本产品结合两个指标的效力,并以单个文件提供。
反危机出售。今日低价。赶紧! 真实的 COMBO 市场深度功能和报价成交量图表,完全等同于原始指标。您将享受这两款产品结合为单一超级指标的力量!下面是您将得到的功能:
真实市场深度图表 股民专用工具现已在 MetaTrader 5 上可用。 真实市场深度图表 指标在图表上以直方条的形式显示可视化的市场深度,并在实时模式下刷新。 利用 真实市场深度图表 指标您可以正确评估市场请求并从图表上看到大的市场。这可以 100% 的精确剥头皮和设置持仓止损。 指标以两种相应颜色的水平直方条形式显示买和卖的请求 (买-卖)。价格图表上给定级别的显示条和它们的长度与请求的交易量相应。此外, 它指示买卖请求的最大交易量。 此指标显示买卖请求总数量作为堆积面积图。这可以评估当经过下一价位时将会执行的请求总量。买卖请求总数量也显示在图表上。 省缺, 指标显示在图表背景上, 且它不会干扰任何其它指标。当使用指标交易时, 建议使用实际交易量。

EquityProtect provides hidden StopLoss, TakeProfit or TrailingStop based on the account equity. All orders of all symbols can be closed or just the chosen currency and/or just buys or sells or pending orders deleted. EquityProtect closes all or just defined orders when the account equity falls under or rises over a certain level. Besides EquityProtect can use the account equity as trailing stop. A comment in the chart shows the equity where the robot will react. An Alert can be activated and ope

Основные параметры EURUSD - в значении true используется валюта; ... AUDCHF - в значении true используется валюта; Magic_Start - Идентификатор сделок; Magic_Finish - Идентификатор сделок; Symbols_Prefix(Suffix)_Name - введите ТОЛЬКО префикс (суффикс), если брокер использует его в названии символа (например: "m."(".m"), если имя пары "m.EURUSD"("EURUSD.m")); Custom_Risk - при true размер лота увеличивается при росте баланса счета (риск-менеджмент); User_Balance - Пользовательский баланс; A

Create and trade timeframes in seconds. The bar time duration is freely adjustable from 1 second and up. The chart is accurately constructed using real ticks from the broker's server. Main characteristics The indicator is an overlay on the main chart, making it possible to utilize one-click trading and on-chart order manipulation. History calculated using real tick data. Built-in technical studies: 4 moving averages (Simple, Exponential, Smooth, Linear-weighted, Volume-weighted using tick or rea

The indicator is designed to close positions on the market in time. For example: to take profits ahead of schedule if the price has not reached TakeProfit, and the market is turning around. The indicator analyzes the momentum, not the trend. He does not give any information about the trend. The indicator is well suited for finding divergence. The Ershov 38 Parrots indicator dynamically adjusts to the market and detects price movement impulses of medium and high amplitude. It almost does not rea

This is diamond!
Diamond Pattern is based on Read The Market(RTM) concepts. The purpose of this model is to face the big players of the market (financial institutions and banks), As you know in financial markets, big traders try to fool small traders, but RTM prevent traders from getting trapped. This style is formed in terms of price candles and presented according to market supply and demand areas and no price oscillator is used in it. RTM concepts are very suitable for all kinds of inves

Automatic cataloging of probabilistic strategies for Binary Options.
Including: * MHI 1, 2 and 3, "MHI potencializada", M5 variation, Five Flip, "Padrão do Milhão", "Três Vizinhos", C3 and Turn Over. * Analysis by time range, date, and days of the week. * Function that brings results from other pairs. * Analysis only following trend and / or side market. * Operation analysis filtering only entries after hit. * Alert after x number of hits, after loss in martingale, or in each new quadrant ent

该系统擅长识别市场的短期逆转。 它基于对市场结构的机器学习研究,可以成为扫描市场或直接交易的绝佳工具。 一切都没有100%的胜率,但这个指标有时总是准确的。
当它认为反转会发生时,它会给蜡烛涂上特定的颜色,画一个箭头,然后提醒你是否购买或出售即将到来的蜡烛。
1. 简单的设置 A.在任何时间段拖放到任何图表上。 B.启用警报(可选) c.你就完了! 2. 视觉和音频警报 A.警报直接发送到您的手机 b.弹出发送到您的终端的警报 3. 多用途 A.股票、外汇、期权、期货 4. 灵活 A.适用于任何时间范围
重要提示:指标会在超过50%确定会发生某些事情时绘制箭头,但只有当它已经确定时,它才会通过改变蜡烛颜色,绘制箭头并提醒您来向您发出信号。 只有在这三件事都发生的时候才会发出信号。

This indicator combines double bottom and double top reversal chart patterns together with RSI divergence detection.
Features Easily detect strong reversal signals. Allows to use double top/bottom and RSI divergence signals combined or independently. Get email and/or push notification alerts when a signal is detected. Custom colors can be used. The indicator is not repainting. Can easily be used in an EA. (see below)
Inputs ENABLE Double Top - Bottom: Enable the double top - bottom indicator

該顧問使用 Course Crystal 指標來做出交易決策。以下是重點:
路線水晶指標:此指標有助於確定市場趨勢的方向。它分析價格變動並將結果顯示在圖表上的彩色區域中。藍色表示買入機會,紅色表示賣出機會。
交易系統:EA 交易分析當前和過去的價格資料以確定趨勢的總體方向。如果數據顯示價格上漲,則該指示器變為藍色。如果數據顯示價格下跌,則指示器變為紅色。
進入交易的訊號:
指示器顏色從紅色變為藍色可能是買入訊號。 顏色從藍色變為紅色可能是賣出訊號。 風險管理:為每筆交易設定停損和獲利非常重要。建議將停損設定在高於(如果買入)或低於(如果賣出)最後高點或低點的水平。
交易完成:當達到停盈或停損水平,或當指標向相反方向改變顏色時,交易關閉。
顧問不使用危險的方法 無網格 不加倍 無平均 不增加 顧問採用經典交易方法,讓交易安全
請記住,沒有任何指標是 100% 準確的,將它們與其他技術分析和風險管理工具結合使用始終很重要。交易愉快!

DYJ TRADINGVIEW 是一个多指标评级系统,使用评级信号数量和分析工具来发现入场的机会。 DYJ TRADINGVIEW 有10个内置的市场分析指标。 我们使用几种不同的类型,可以很好地相互补充。 使用我们的评级系统关注您喜欢的品种,您可以找到更准确的交易。 参与评级的趋势指标包括 DYJ POWERSIGNAL 、ADX、SMA、布林带。 参与评级的震荡指标包括 MACD、RSI、随机指标、鳄鱼。 当有3个指示器有显示同一方向买入或卖出信号数量大于等于3或更高时,我们开始进入市场交易。 参数
[GENERAL] InpMaxTrendeds = 3 -> 当信号数量大于等于 InpMaxTrendeds 时 此货币对可入场 [TRADINGVIEW] InpPowerSignalMinPercent = 90 -> TradeView 最低趋势百分比 InpPowerSignalStrongPercent = 100 -> TradeView 强烈趋势百分比 InpPowerSignalMaxPercent = 100 ->

使用该工具快速分析市场结构,并利用重要的价格水平。
市场结构
该自定义指标绘制重要价位,可用作进场点或盈利目标。
确定交易范围
利用该指标,根据市场转折点进行剥头皮。
突破交易机会
使用该指标发现突破机会。这种交易策略具有极佳的风险回报比。
自定义警报
当价格突破特定交易区间时,您可以在手机上收到通知或电子邮件。如果您觉得需要根据自己的交易策略定制这些警报,请随时给我发信息。
智能资金概念
该指标是与自营交易商合作开发的,以遵循他们的智能资金理念。
设计简单
我们没有在图表上绘制所有可能的区域,而是决定只绘制我们认为需要关注的主要水平。因此,该指标非常简单,也是初学者的好工具
开放式支持
我们愿意根据您的交易需求定制该指标。如果您有任何建议或需求,请随时给我发消息。
输入: 警报: 信号形成时发送警报--启用后,每次指标形成新的支撑/阻力区时都会收到警报。
突破时发送警报 - 启用后,每当蜡烛收盘突破支撑/阻力区时,都会收到警报。
允许每个信号发出多个警报--发生突破警报时,如果打开此设置,当价格收盘回到突破

What was IFM created for Our goal in creating IFM was to provide the tool to manage your Fibonacci Retrecements and other Fibo tools in MetaTrader 5. This indicator allows you to edit all of the settings without getting into it by right click on the tool. That is faster and easiest way to manage objects on your chart.
Inputs Font size - change font size of texts on the IFM panel. This is necessary, because some of users change font size in Windows settings Description of the Fibo levels (varia

Here we have the Start Midas Fibo Bands , I confess that it is an indicator that excited me enough to operate because I was able to find more defined rules. Well, the indicator has the functions of the other indicators of the Start line , which is a possibility to plot several Midas on the screen, you can move the anchor point using keyboard shortcuts and use the legend to differentiate one anchor from another. The rules that I have analyzed for my possible setup are recommended to the entry, st

The Basket expert advisor can open up to 10 trades at once. It was developed for basket traders who need to open a lot of trades on many different pairs. Expert advisor allows to set a take profit and stop loss as a value in money for each basket trade. This EA is also equipped with hedge functions and allows traders to use the Classic hedge strategy or Sure-Fire strategy, also known as "Always in profit".
Main features Opening multiple trades simultaneously EA Works on any market (forex,

The price is 45 USD for a short time for promotional purposes, the next price will be 300 USD
Fair Value Gap Judge EA uses a special calculation formula between price differences and thus determines whether the parity is above or below the required price. It does not use the MA and RSI system, instead it detects sudden fomo SELLs and BUYs in prices. In this way, it enters trade only when there are HIGH opportunities.
-It is suitable for all FX parities and stock market, but I do not recomm

FFx Patterns Alerter gives trade suggestions with Entry, Target 1, Target 2 and StopLoss .... for any of the selected patterns (PinBar, Engulfing, InsideBar, OutsideBar) Below are the different options available: Multiple instances can be applied on the same chart to monitor different patterns Entry suggestion - pips to be added over the break for the entry 3 different options to calculate the SL - by pips, by ATR multiplier or at the pattern High/Low 3 different options to calculate the 2 TPs -

Percentile of Historical Volatility and Correlation Coefficient shows if the asset is cheap or expensive based on the volatility. It is used to determine a good entry point. It has two indicators built in: Historical Volatility is ranked percentile wise and its correlation to price action which gives an indication of the direction of a possible future move. Together the both indicators can give good entries and direction. Historical Volatility is a statistical measure of the dispersion of retu

Elevate your trading to new heights with Boom and CrashX, the advanced Expert Advisor (EA) designed with precision to enhance your trading experience. This EA leverages powerful indicators to provide accurate signals, streamline risk management, and boost profitability, ensuring a smooth operation in the ever-changing financial markets. Boom and CrashX is the perfect ally for both experienced traders looking to improve their strategies and newcomers embarking on their trading journey.
Enhanced

This product is converted form Trading View of Kivanc Ozbilgic to be used on MT5 and below are descriptions of developer on Trading View:
Anıl Özekşi's latest development on his precious OTT - Optimized Trend Tracker:
In this version, there are two lines of OTT which are derived from HIGHEST price values (HOTT) and LOVEST price values (LOTT) which were originally sourced to CLOSE values on default OTT.
Another significant difference is there is no Support Line (Moving Average) in this ver

BestPointOfInitiation是一个很好的短线交易指示器,能与 ShortBS ( https://www.mql5.com/zh/market/product/96796 )完美的配合,可以很好的指出最佳的buy和sell位置,指标不含有未来函数,不会重新绘制,不仅能够应用到自己的手动交易过程中,还能完全可以写入到自己的EA中。(如果你感觉到这个指标能够帮助你进行更准确的交易,请帮忙给个好评,希望我的作品能够帮助更多多有需要的人) ===================参数列表===================== fastPeriod: 9 slowPeriod:30 PassivationCoefficient:5 =================参考使用方法=================== 此指标可以适用于任何交易品种,能够用在任何周期。

Volality 75 Fractal Scalper Non-repaint The arrows appear on the current candle. momentum and trend based strategy Works on all timeframes from the 1 Minute to the Monthly timeframe Bollinger bands have been added to show the trend direction whether its bullish or bearish Blue fractal arrow is your buy entry Orange fractal arrow is your sell entry you can use the Vix 75 fractal scalper in combination with other indicators.

Эксперт - торговый помощник, созданный по одноимённой торговой стратегии Оракул в сотрудничестве с ее автором Нео. Определяет на графиках в автоматическом режиме разворотные импульсные модели и строит по ним Вилки Нео - авторский инструмент, позволяющий определять циклы движения цены и указывающий на ожидаемую цель TakeProfit . Поиск ведется на всех заданных периодах графиков одновременно с фильтрацией совпадений. Осуществляется фильтрация неверных Вилок с указанием кода ошибки. Утилита имеет
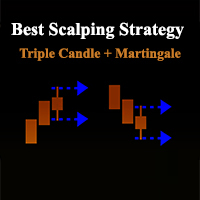
Best MT5 Scalping Strategy 3 Candle Parámetros recomentados H1 lotaje 0.01. Gestión del riesgo profesional Descubre el Robot de Scalping basado en la Estrategia de las 3 Velas. Este robot de trading de Forex ha sido desarrollado por MRBEAST como una herramienta para facilitar el trading intradía. Tenga en cuenta que el uso de este robot implica ciertos riesgos y no garantiza ganancias consistentes en el mercado de divisas. El robot de trading se basa en algoritmos y estrategias que he diseñado,

Chart Notes = MULTI LINE TEXT INPUT ON CHART FOR MT5 is finally here! # sticky notes This indicator is a powerful text editor for placing notes on chart, similarly like the feature on Tradingview.
There are 2 types of messages: anchored (on screen ) and free (on chart).
1. Anchored = stays on the same place on screen (x point, y point) -this text can be EDITED on click (first line is for dragging the message around- this line is edited via right clicking- >properties) -move the messages by

1. Why did I develop this series of indicators
I found that most traders need to use multiple time frame indicators. They usually switch time frame to see indicators. However, once the timeframe is switched, you cannot see the corresponding relationship between the price in the smaller timeframe and the indicator in the larger timeframe . For example: if your price chart is in H1 timeframe, you can see H4, D1 and W1 indicators in H1 timeframe Chart. This is more helpful for you to find t

Indicator that will show your Balance , and your Equity . Really simple to use, no specific requirements to install it. However you can deeply configure it for your own wishes. The pannel has 4 buttons. Only current will display the information of the chart you linked the indicator. If this is deselected, you will have the information of the whole account. Only Buys will display only the BUY orders and Only Sells will display only the SELL orders. Show Zero will display the 0

The Boy Plunger Gold EA is a revolutionary scalping Expert Advisor (EA) designed for the Gold and Silver markets. This EA does not require a low spread account and offers smart take profit and stop loss levels, without the need for trailing features.
The EA is intended for use and backtesting specifically in 2023.
Main EA setting: Timeframe: The timeframe used for market analysis. It is set to PERIOD_H4, which represents the 4-hour timeframe. ATR_Period: The number of bars used for calcul
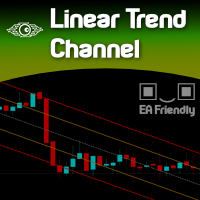
Imagine a way to automatically and clearly recognize the direction of the current market. Uptrend or Downtrend?
Forget about moving averages, there is a simple way to determine that. Welcome to the world of statistics. Welcome to the simple yet powerful world of Linear Regression. Just a complicated name for a genius and simple measurement.
Calibrating this indicator is pretty clear and obvious since the degree of freedom is total and deep.
Once calibrated to your desired Symbol/Asset,

MT5 Version Dashboard: Free scanner to monitor All pairs and timeframes. Please contact me after purchase, i will send it to you! MT4 version indicator: https://www.mql5.com/en/market/product/59127 Tip: This is an indicator for real-time signal display. When the indicator is loaded and running on the chart, the past signal cannot be displayed Market structure changes as price reverses And filter with all import features built inside one tool. Breaker's smart algorithm detects the reverses,

The Relative Strenght Index presented to the world in 1978 by J. Welles Wilder Jr. in his book " New Concepts in Technical Trading Systems " is widely used around the world in several ways, not only with the traditional approach of Overbought and Oversold states, which in several cases and depending on the assets and timeframes it just simply doesn't work anymore . BUT, this indicator has its value when used, for instance, looking for divergences between its measuring system and the Prices appea

The Volume indicator is an excellent tool for measuring tick volume or real volume activity. It quickly and easily helps traders evaluate the volume's current size. The indicator for classification of the volume size uses the moving average and its multiples. Accordingly, the area where the volume is located (relative to the moving average) is labeled as ultra-low, low, average, high, very high, or ultra-high. This indicator can calculate the moving average by four methods: SMA - Simple Moving

For those traders who really care about Volume as an important vector information on Price Action, here is an exclusive idea & creation from Minions Labs: Volume Speed . The Volume Speed indicator shows you visually how much time (in seconds, minutes, hours, you choose) the Volume took to reach the Average Volume of the past bars. This way you can have the exact idea of "what is happening right now with the Volume of the current bar..." and take action accordingly with your strategy, having even

The GTradeView tool is indicator designed to visualize the position and its information, such as Reward to risk ratio, Risk percent, Profit, Target and stop-loss and recalculate the reward to risk ratio and risk% in real time on the chart. This tool useful in your trading journal. you can take screenshot of your position, entry, target and stop-loss so you have a visual representation of the trade then you can save it in the journal. And you can visualize EA's trade with associated risks and rew

This indicator shows when user set sessions are active and returns various tools + metrics using the closing price within active sessions as an input. Users have the option to change up to 4 session times.
The indicator will increasingly lack accuracy when the chart timeframe is higher than 1 hour.
Settings
Sessions
Enable Session: Allows to enable or disable all associated elements with a specific user set session.
Session Time: Opening and closing times of the user set session

This is the Full Version, to get the free version please contact me.
The free version works on “AUDNZD” and “XAUUSD” charts.
All symbols and time frames scanner
Head and Shoulder
One of the most popular Price Action patterns is the Head and Shoulders pattern. The pattern has three local tops that resemble the left shoulder, head, and right shoulder. The head and shoulders chart pattern appears in all kinds of markets, including Forex, cryptocurrency, commodities, stocks, and bonds. The

This is the Full Version, to get the free version please contact me. The free version works on “GBPCHF” charts. All symbols and time frames scanner. Harmonic Pattern
Harmonic patterns are used in technical analysis that traders use to find trend reversals. They are considered one of the most accurate technical analysis tools, as they allow traders to predict the future price movement direction and the potential trend targets. Also, unlike many other technical tools, the number of false signal

本指标用于在图表上识别和标记 1-2-3 多头和空头形态。本指标可辅助确定交易的开始和分形信号,以及 МetaTrader 5 所有时间帧内的可能入场点。在图表上绘制的菲波纳奇线用来指示在波浪理论基础上价格移动的可能目标。 在价格顶部或底部形成 1-2-3 形态尤其重要,它的出现可作为离散 (聚合)。 本指标可以调整射线和菲波纳奇线的颜色。 本指标对于任何交易系统或模板都是一个极好的补充。

This tool is designed to measure the distance between two points on a chart and much more.
List of measured values:
Distance in points Profit (with and without spread) Time difference Percentage price change Slope angle Number of bars (various variations) Ratio of distance in points to the reference value Features:
Snap to OHLC prices Automatic color profile setting based on chart background color Various types of pointers to choose from Display of values of selected points o
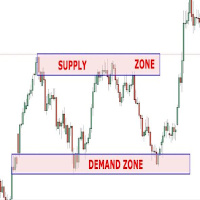
This Expert Advisor can be applied to many markets because It exploits basic supply/demand and price action concepts. It identifies the major rotation zones (PRZ), supply and demand zones and supports and resistances within major price trends. It buys at discount zones and sells at premium prices. It can and should be optimized through the Metatrader tester to find the best parameters to use for current market conditions. This is not a fixed strategy rather a full trading algo that will find whi
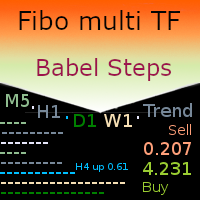
MT5 netting the “Babel Steps” robot uses the ZigZag indicator to generate Fibonacci levels on M1, M5, M15, H1, H4, D1, W1 periods of the charts , calculates the strength of trends for buying and selling. It opens a position when the specified trend level is exceeded plus Bollinger indicators and Stochastic indicators inform about oversold / overbought market. Stochastic and Bollinger indicators help to increase or decrease the position. If market moves into favorable direction the Robot genera

INTRODUCTION
Unleash the power of our brand new EA "Frankenstein" and conquer the forex market like never before! Our revolutionary expert advisor combines the strength of a price channel strategy with a sophisticated machine learning algorithm, allowing you to navigate the ever-changing market with precision and confidence. And the best part? For a limited time, you can get "Frankenstein" at a jaw-dropping 80% off during our exclusive launch promotion, priced at just $99! FEATURES
Trade p

Yggdrasil is a fully automated hedging system . The EA opens orders in both direction on the chosen pairs by the user. Currency pairs aren't traded individually, all trades opened are part of the system. The algorithm will close the unprofitable orders with the available profit. It prevents drawdown to increase if a big trend occurs on a currency pair.
The EA is designed to be efficient with minimal settings . No need fine tuning parameters, it's a long term "set & forget" expert advisor.
A
INTRODUCTION
After observing the markets for years and developing a strategy that can truly beat the market, we, a team of experienced traders, are ready to share with the trading community an expert advisor that have shown outstanding results in current market conditions. Introducing "Nebula FX" – an exceptional Forex expert advisor designed to capitalize on market trends with precision, delivering a remarkable trading experience. Nebula FX employs a sophisticated algorithm that carefully an
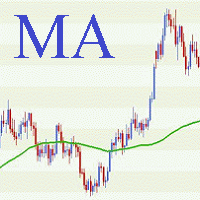
专业的机器人,实现贸易和过境价格滑动的经典策略。
当穿越移动和价格买入或卖出的信号之间形成的。该信号的方向被设置在该设置。
法官正确处理错误,工作可靠,在市场上。 100元的营运资金!选择工作的方向或双方,或只是购买或出售是很重要的。
专家使用的基本概念,盈亏平衡点,拖网,止损和止盈,以及关闭相反的信号。
参数概述:
魔术 - 魔术数字,任意整数。
工作周期 - 在其上专家的工作时间。
风险 - 即进入市场的风险,定义为存款项目的总损失的百分比是指相对于止损和允许亏损时止损。
LotRounding - 四舍五入很多(以小数)。
偏差 - 重新报价。
卧具 - 等待打开,关闭或修改的位置。
止损 - 止损。
止赢 - 平仓。
结尾句点 - 运行拖网的时间。
尾随盈亏平衡 - bezubytka0级 - 关闭。
尾部开始 - 级开始拖网0 - 关闭。
追踪止损 - 0级拖网 - 拖网下车点,较积极的拖网时期
TrailingStep时期 - 二尖瓣时期
禁止新系列 - 如果你想完成的当

Void is an advanced grid system that has been operational on real accounts for several years. Unlike many systems that rely on historical data, Void was specifically created to capitalize on existing market inefficiencies, utilizing real market mechanics to generate profits effectively. It supports currency pairs like any currencies in any timeframe. It enters trades without any rules. So, it will direct enter a new trade when you attach to the chart. #1 AUDCAD, NZDCAD, AUDNZD Performance

Initial price - $299, subsequent price - $399. Trinity MT5 - an advanced solution for automated trading!
Trinity MT5 is an automatic trading system based on the basic principle of Forex - return to the average price. The average price reversion principle works best on three currency pairs: AUDCAD, NZDCAD, AUDNZD. Live signal(2 years+) : https://www.mql5.com/en/signals/2228001 After purchasing EA, be sure to write to me in private messages, I will send you the set files. The robot settings are

Session Volume Profile is an advanced graphical representation that displays trading activity during Forex trading sessions at specified price levels. The Forex market can be divided into four main trading sessions: the Australian session, the Asian session, the European session and the favorite trading time - the American (US) session. POC - profile can be used as a support and resistance level for intraday trading.
VWAP - Volume Weighted Average Price.
ATTENTION ! For the indicator to

股票交易者的专业工具现已登陆 MetaTrader 5 。 真实市场深度图表 指标在图表上以直方条的形式显示可视化的市场深度,并在实时模式下刷新。 根据用户需要提供更新!
现在真实市场深度指标显示买卖交易请求的交易量比率 (B/S 率)。它显示每种请求类型占全部请求流的份额,以及绝对交易量。
怎么使用它?一般高频交易者的观点, 当某种请求占显著支配地位, 价格趋势将往请求方向倾斜, 即交易量大的。观察并使用我们的真实市场深度指标! 利用 真实市场深度图表 指标您可以正确评估市场请求并从图表上看到大的市场。这可以 100% 的精确剥头皮和设置持仓止损。 指标以两种相应颜色的水平直方条形式显示买和卖的请求 (买-卖)。价格图表上给定级别的显示条和它们的长度与请求的交易量相应。此外, 它指示买卖请求的最大交易量。 反危机出售。今日低价。赶紧! 此指标显示买卖请求总数量作为堆积面积图。这可以评估当经过下一价位时将会执行的请求总量。买卖请求总数量也显示在图表上。 省缺, 指标显示在图表背景上, 且它不会干扰任何其它指标。当使用指标交易时, 建议使用实际交易量。 本指标仅与提供市场深度的品种

The Multi Asset Monitor Panel is a game-changer for traders who need to keep an eye on multiple markets simultaneously. This innovative panel allows you to monitor any symbol and any timeframe you need, all within a single, organized interface. With up to three lists of symbols and customizable MT5 templates, you can tailor your monitoring setup to fit your specific trading strategy. What sets the Multi Asset Monitor Panel apart is its flexibility and customization options. You can control the s

RUBFX Trend histo mt5 , indicator works on synthetic indices, Currencies , Indices ,Stocks Gold etc , good for follwoing trend on the markets suitable for scalping Buy Rules; When the histo changes to Blue you place buy order ,stop loss just below the previous swing low Sell Rules; When the histo changes to Red you place sell order ,stop loss just below the previous swing high Trade on a timeframe which best suits your trading style

BeST_Trend Exploiter is a Metatrader Indicator based on a smart proprietary algorithm which can detect the market Median Trend while it filters out the noise providing Buy and Sell Signals and also wherever it is applicable it provides us with TP Levels of High Probability. Additionally as it has Built Inside all the necessary features it can be used as a Complete Strategy of very Impressive Results. Essential Advantages of the Indicator
Clear and Easily Understandable trading rules. Real

This is a multi-timeframe indicator that detects and displays support and resistance (S&R) lines using the ZigZag indicator.
Features
The support and resistance lines are not redrawing. The indicator is capable of adding new support and resistance levels as they appear. Each S&R line has a tooltip that displays the price level and start time. Shows the start time, price level and number of touches of all S&R lines when pressing the shortcut Shift+I Save time for multi-timeframe analysis on

OPTIMIZE EA BEFORE TEST AND USE. Bitcoin M5 is for trading BTC/USD on 5 min charts. SL and TP should Start with 50000. OPTIMIZE BEFORE USE The trading strategy uses Bollinger Bands and Envelopes indicators to trade from. Trading to catch some breakout points of where the price breaches the bands and then exiting when the price crosses the envelopes. Every trade uses a fixed lot amount and has a SL and TP. The EA does not use martingale or hedging in the logic.

Breakouts with strong momentum are challenging to catch. The purpose of the Super Breakouts Monitor is to identify such market conditions. This indicator is inspired by a concept from renowned Technical Analyst Tushar Chande, who combines two highly adaptive indicators, VIDYA and the Dynamic Momentum Index (both his creations), to capture the early stages of a successful breakout. At Minions Labs, we've added our unique enhancements to adapt these great ideas for modern markets like stocks, cryp

i-Orders is a simple indicator to monitor your own trade/analyze others' trades. I use it for a long time and do not imagine a chart without these arrows, lines and trade result numbers. The features allow you to: change the size and location of the control buttons ( Control buttons size , Control buttons corner ), disable display of opened and closed positions ( Show OPENED , Show CLOSED , Show PENDING ), change colors of arrows and lines for profitable and unprofitable buy and sell positions s

MA Alert Indicator
You do not need anymore to constantly and tediously look at the chart . If your strategy uses any type of moving average with any settings, just add this indicator to the chart according to your required settings
You will be notified whenever the price hits your MA , whether touch or candle close by crossing it. Also, an arrow symbol will be displayed on the chart based on movement.
If you d o not have access to your computer, just set your MetaTrader notification by t
线性回归人工智能驱动指标:
线性回归是一种简单而有效的人工智能技术,是复杂神经网络的基础,该指标基于线性回归分析构建,并试图对市场即将发生的事件做出预测
输入:
train_bars:这控制了价格信息将被收集并用于训练其中的 AI 的柱数,该值越大越好,而且指标在初始化期间变得越慢,我建议值为 1000 Predict_next_bars:这决定了您希望指标接下来预测的蜡烛数量,默认情况下该值设置为 10。因为该指标尝试预测接下来 10 个蜡烛的上涨位置。 如果指标预测高于当前价格,则意味着指标预测市场将看涨,否则将看跌 include_ precision:设置为 true 时,指标会计算之前在预测过程中所犯的错误,并将这些错误的平均值包含在新的预测中,以使指标更加准确 在右下角,指示器显示有关训练和测试准确性、精度误差和平均/平均误差的有价值的信息。 在使用指标之前,请确保训练和测试准确度均为 0.6 至 0.9 范围内的良好值,分别代表 60% 至 90% 的准确度。如果指标没有为特定交易品种提供良好的准确度值,则该指标 可能不适合这样的符号。
该指标最适合所有

London Breakout MT5
is the risk-reduced and not overpriced Breakout Expert that trades morning session breakouts of GBPUSD, here offered by the original developer. !!!Just rent it riskless for only $30 and decide later to buy the unlimited license finally by getting reimbursed by the $30 rental fee!!! Watch this video before you intend to buy a much more expansive Breakout Expert Advisor: https://www.youtube.com/watch?v=c0UwKrWnoEE&t=2s Compare current performance with top rated, high

It makes it easier for you to trade by providing trend charts in all frames from bottom to top. If it touches the upward trend, it is a good opportunity to sell, and the target is the downward trend, and vice versa. If it touches the downward trend, it is a good opportunity to buy, and the target is the upward trend. It can automatically redraw the trend. You can monitor higher frames and trade on lower frames for speculation .

DETECT THE TREND AND THE BEST PRICE TO ENTER A TRADE
Trend Detection for perfect entry - Distinguish the direction of thetrend and its strength, showing a line of different colors depending on whether the trend is strong bullish, weak bullish, strong bearish or weak bearish.- Best Entry point for perfect entry - Shows an area with the best entry in favor of trend. Never trade against the trend again.
Entry signals and alerts - When the price is in a valid zone, it sends pop up alerts, teleph

Oil trading. This version uses Stop and Take Profit orders, unlike Oil Investor, where entering and exiting a position is carried out only by a signal, after calculating the overall balance of the correlated markets. The markets you need are available in FXPro. These are quotes from BP, Chevron and Total. The Expert Advisor must be fixed in the window with Brent on any timeframe from M1 to H1. Minimum deposit is $500. Options:
"------------------------MagicNumber-----------------------"
Mn

The best quality application of the famous Super Trend indicator that requires no introduction. It is completely faithful to the original algorithm and powered by the CCI indicator.
- easy to trade - It implements all kinds of warnings. - It implements a multi-timezone dashboard. - It cannot be repainted or backpainted.
Input parameters - ATR Period – This is the average true range period. - ATR Multiplier - The ATR multiplier that defines the trend. - CCI - Makes trend following powerful. -

You can see Binance Futures data instantly in Metatrader 5 and it allows you to use all the features that Metatrader has provided to you.
You can access the data of all symbols listed on Binance Futures. Don't forget to set the timezone. Binance it's 00:00 UTC. You need to fix it according to your own country You need to pre-install the free Binance Future Symbol List plugin. https://www.mql5.com/tr/market/product/82891 After loading, it automatically downloads the data of the cryptos in the
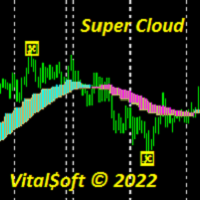
The Super Cloud indicator helps to determine the direction of the trend when trading. Shows on the chart signals about a possible upcoming trend change. The indicator provides an opportunity to detect various features and patterns in price dynamics that are invisible to the naked eye. Based on this information, traders can anticipate further price movement and adjust their strategy accordingly. Works on all timeframes except MN.

Expert advisor based on Bollinger Bands Indicator Since it is not easy to predict when the trend reversal will occur, this Expert can place additional orders at different distances from the first order, and with different lots, so that positions can be averaged and profit taking is more easily achieved. Since the over-buy or over-sell conditions apply to any currency pair in the Forex market, this expert can be used with any pair by adjusting the step and the size of the Lot. The default parame

The Average Price indicator calculates the average prices of BUY (LONG) and SELL (SHORT) open positions, taking into account the size of open positions, commissions and swaps.
The indicator builds the average line of LONG open positions, after crossing which, from the bottom up, the total profit for all LONG positions for the current instrument becomes greater than 0.
The indicator builds the average line of SHORT open positions, after crossing which, from top to bottom, the total profit f
MetaTrader市场提供了一个方便,安全的购买MetaTrader平台应用程序的场所。直接从您的程序端免费下载EA交易和指标的试用版在测试策略中进行测试。
在不同模式下测试应用程序来监视性能和为您想要使用MQL5.community支付系统的产品进行付款。
您错过了交易机会:
- 免费交易应用程序
- 8,000+信号可供复制
- 探索金融市场的经济新闻
注册
登录