MetaTrader 5용 유료 Expert Advisor 및 지표 - 26

CAP Wabot Scalper EA is a fully automated Expert Advisor for Forex trading that uses advance price movement. Indicators are not used in operation. The EA uses Take Profit and Stop Loss. Averaging and Martingale are not used. This EA is basically designed to trade EURUSD, GBPUSD and USDJPY which implements a complete and fully-functional trading strategy. But EA can be working any of pair. This EA will need a good broker with small spread to work successfully. CAP Wabot Scalper EA is backtest

Introducing "Congestion Breakout MT5" - the indicator that helps you identify congestion zones in your chart and alerts you when the price breaks through them. Traders know that congestion zones can be key areas of price action and can indicate potential turning points in the market. However, spotting these zones and anticipating breakouts can be a difficult and time-consuming task. That's where "Congestion Breakout" comes in. This powerful indicator uses advanced algorithms to analyze the pri

Here’s the problem: the default zigzag indicator given in MT5 trading platform does not really capture the most of the highs and lows on chart do draw zigzags. On chart below, notice that some of ther high, low of price have been missed to draw zigzags by this default zigzag indicator (picture 1). It is not so apparent until you compare default zigzag indicator to this SwingZZ indicator. Have a look on picture 2 and 3. The swing zigzag indicator is best because it captures most of the swing high

This indicator converted from 5 min Buy and Sell Range Filter - guikroth version on TradingView Popularity of the Range Filter
The Range Filter is a very popular and effective indicator in its own right, with adjustments to the few simple settings it is possible to use the Range Filter for helping filter price movement, whether helping to determine trend direction or ranges, to timing breakout or even reversal entries. Its practical versatility makes it ideal for integrating it's signals into

Welcome! We are delighted to introduce our latest expert, which is a semi-automatic trading system that includes all the features you need for position management. Simply draw a line on a significant trend or supply-demand level, and the expert will take care of the rest for you. It comes with a wide range of risk management and position management tools, such as trailing stop, partial closure, break even, determination of stop loss and take profit levels using ATR, as well as automatic lot sizi

Do you believe that financial markets and celestial bodies operate in separate realms? Our indicator begs to differ! Based on the innovative theory of William Gann, which emphasizes the influence of celestial planet movements on financial market dynamics, we present to you the "Gann Planetary Lines Indicator". Features of the Indicator : Precision : Accurate projection of the 360 degrees of planetary orbits onto price charts. Advanced Customization : Ability to display or hide any planet line,
Buy and Sell Grid is an expert advisor that uses mechanical strategy to trade on any timeframe and any currency pair. BUY and SELL GRID EA lets you choose between three types of grid trading strategies whether you want to trade sideways, uptrend or downtrend market. To make things easier for our users, we developed a interactive graphical panel that shows you all relevant information about EA inputs and your account.
STRATEGY Grid strategy is pure mechanical strategy, this EA has three types

This indicator allows you to enjoy the two most popular products for analyzing request volumes and market deals at a favorable price: Actual Depth of Market Chart Actual Tick Footprint Volume Chart This product combines the power of both indicators and is provided as a single file. The functionality of Actual COMBO Depth of Market AND Tick Volume Chart is fully identical to the original indicators. You will enjoy the power of these two products combined into the single super-indicator! Below is

Gann 9+ Indicator Introduction The "Gann Matrix Chart" is the most simple and clear technical analysis in Gann theory, which is the calculation tool that Gann has always been committed to using. It is the essence of Gann's whole life. The Gann 9+ indicator uses the matrix chart to find the future high or low points of stocks or futures. Indicator Input: The base and step size can be set as 1 by default; When the multiple is -1, the multiple will be automatically obtained, or it can be filled in

EquityProtect provides hidden StopLoss, TakeProfit or TrailingStop based on the account equity. All orders of all symbols can be closed or just the chosen currency and/or just buys or sells or pending orders deleted. EquityProtect closes all or just defined orders when the account equity falls under or rises over a certain level. Besides EquityProtect can use the account equity as trailing stop. A comment in the chart shows the equity where the robot will react. An Alert can be activated and ope

Attention!!! Do not try to test the EA in the MT4 Tester, it is simply impossible, because the EA opens positions on 27 different instruments and 8 timeframe . The tester is able to test only one pair. Multi-currency tester is possible only in MT5. Instructions for launching a multi-currency tester in MT5: https://youtu.be/WrQQwMQclrY How EA works: 1. The main strategy for the breakdown of local extremes is used. 2. An additional algorithm is used to control losing trades and redistribute loss

Create and trade timeframes in seconds. The bar time duration is freely adjustable from 1 second and up. The chart is accurately constructed using real ticks from the broker's server. Main characteristics The indicator is an overlay on the main chart, making it possible to utilize one-click trading and on-chart order manipulation. History calculated using real tick data. Built-in technical studies: 4 moving averages (Simple, Exponential, Smooth, Linear-weighted, Volume-weighted using tick or rea

The indicator is designed to close positions on the market in time. For example: to take profits ahead of schedule if the price has not reached TakeProfit, and the market is turning around. The indicator analyzes the momentum, not the trend. He does not give any information about the trend. The indicator is well suited for finding divergence. The Ershov 38 Parrots indicator dynamically adjusts to the market and detects price movement impulses of medium and high amplitude. It almost does not rea

This is diamond!
Diamond Pattern is based on Read The Market(RTM) concepts. The purpose of this model is to face the big players of the market (financial institutions and banks), As you know in financial markets, big traders try to fool small traders, but RTM prevent traders from getting trapped. This style is formed in terms of price candles and presented according to market supply and demand areas and no price oscillator is used in it. RTM concepts are very suitable for all kinds of inves

MT5 RSI Experiment: This indicator leverages the Relative Strength Index (RSI) and floating levels to pinpoint potential buy and sell signals.
The code uses enums for prices and RSI calculation methods. These enums define indicator parameters.
Input variables include RSI period, price type for RSI calculation, smoothing method, and look-back period with levels for floating levels.
Index buffers store RSI fill, RSI up line, RSI middle line, RSI down line, and trend line data.
For each ba
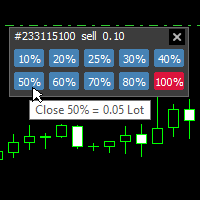
With this tool, you can easily and quickly close part of the trade. Click near the trade to display the closing panel. There are ten preset values for partial closing, but you can set your own values. You can also resize the panel according to Windows settings (125%, 150% ...) See the animation below for how it works. **********************************************************
Note: This tool does not work in the tester.

This pass-band oscillator seeks to pass-band out both high and low frequencies from market data to eliminate wiggles from the resultant signal thus significantly reducing lag. This pass-band indicator achieves this by using 2 differenced EMA's of varying periods. (40 and 60). Trigger points for the pass-band oscillator are added with a RMS cyclic envelope over the Signal line. Output of the pass-band waveform is calculated by summing its square over the last 50 bars and taking the square root of

This indicator combines double bottom and double top reversal chart patterns together with RSI divergence detection.
Features Easily detect strong reversal signals. Allows to use double top/bottom and RSI divergence signals combined or independently. Get email and/or push notification alerts when a signal is detected. Custom colors can be used. The indicator is not repainting. Can easily be used in an EA. (see below)
Inputs ENABLE Double Top - Bottom: Enable the double top - bottom indicator

이 조언자는 Course Crystal 지표를 사용하여 거래 결정을 내립니다. 핵심 사항은 다음과 같습니다.
코스 크리스탈 지표: 이 지표는 시장 추세의 방향을 결정하는 데 도움이 됩니다. 가격 변동을 분석하고 결과를 차트에 색상 영역으로 표시합니다. 파란색은 매수기회, 빨간색은 매도기회를 나타냅니다.
거래 시스템: Expert Advisor는 현재 및 과거 가격 데이터를 분석하여 추세의 일반적인 방향을 결정합니다. 데이터가 가격 상승을 나타내는 경우 표시기가 파란색으로 변합니다. 데이터에 가격 하락이 표시되면 표시기가 빨간색으로 변합니다.
거래 개시를 위한 신호:
표시 색상이 빨간색에서 파란색으로 바뀌는 것은 매수 신호일 수 있습니다. 파란색에서 빨간색으로 색상이 변경되면 매도 신호가 될 수 있습니다. 위험 관리: 각 거래마다 항상 손절매를 설정하고 이익을 얻는 것이 중요합니다. 마지막 고점이나 저점보다 높은 수준(매수하는 경우) 또는 낮은 수준(매도하는 경우)으로

Phi Cubic Fractals Pack1A with FuTuRe PACK 1A é uma melhoria sobre o Pack 1 que inclui a possibilidade de selecionar as linhas LINE 4/8/17/34/72/144/305/610 individualmente. Este produto contém os indicadores do PACK 1A (Lines + LineSAR + Channels + BTL + Ladder) + MODO FUTURO Phi Lines - medias moveis especiais, semelhantes às MIMAs do Phicube, capazes de indicar com muita clareza tanto a tendencia como a consolidação; Phi LineSAR - apaga ou destaca as Phi Lines para mostrar apenas as linha

A supply and demand indicator designed with a minimalist trading strategy based on the nature of the market. Indicator type: Price Action indicator The Bull zone is a strong support area, and the Bear zone is a strong resistance area. When a Bull zone was breakout, it becomes the "base" of the Bears and vice versa. When the price meets these areas, there is a high probability that the price will reversal , so we call them Obstacles. It is a suitable indicator for traders interested in manual pr

MOON 4 TREND COLORS: is a Tren indicator. I s a powerful indicator of TREND for any par and any timeframe. It doesn't requires any additional indicators for the trading setup.The indicator gives clear signals about opening and closing trades, PAINTING THE CANDLES OF COLOR IN FUNCTION OF THE SENSE OF TREND .This Indicator is a unique, high quality and affordable trading tool.
Perfect For New Traders And Expert Traders Low risk entries. For MT5 Only Great For Scalping Great For Swing Trad

DYJ TRADINGVIEW는 등급 신호 카운트 및 분석 도구를 사용하여 글로벌 시장에서 진입 기회를 찾는 다중 지표 등급 시스템입니다.
DYJ TRADINGVIEW에는 시장 분석을 위한 10가지 내장 지표가 있습니다.
지표 기반 분석은 많은 거래자가 수행할 거래와 거래를 시작하고 종료할 위치에 대한 결정을 내리는 데 사용합니다.
우리는 서로를 잘 보완할 수 있는 몇 가지 다른 유형을 사용합니다.
귀하의 시장을 추적하기 위해 저희를 사용하십시오. 더 정확한 거래를 찾을 수 있습니다.
등급에 참여하는 추세 지표에는 DYJ POWERSIGNAL, ADX, SMA, 볼린저 밴드가 있습니다.
등급에 참여하는 오실레이터에는 MACD, RSI, Stochastic, Alligator가 있습니다.
시그널의 개수가 3개 이상일 때 시그널을 매수 또는 매도하는 동일한 방향을 나타내는 3개의 지표가 있을 때 시장 거래에 진입하기 시작합니다.
입력 [일반] ViewName

What was IFM created for Our goal in creating IFM was to provide the tool to manage your Fibonacci Retrecements and other Fibo tools in MetaTrader 5. This indicator allows you to edit all of the settings without getting into it by right click on the tool. That is faster and easiest way to manage objects on your chart.
Inputs Font size - change font size of texts on the IFM panel. This is necessary, because some of users change font size in Windows settings Description of the Fibo levels (varia

The price is 45 USD for a short time for promotional purposes, the next price will be 300 USD
Fair Value Gap Judge EA uses a special calculation formula between price differences and thus determines whether the parity is above or below the required price. It does not use the MA and RSI system, instead it detects sudden fomo SELLs and BUYs in prices. In this way, it enters trade only when there are HIGH opportunities.
-It is suitable for all FX parities and stock market, but I do not recomm

The Grid Trader Expert Advisor is a very special algorithm that allows traders to benefit from sideways markets. It trades long and short sides separately and creates two different grids according to its setting. Each side has its account and virtual take profit, determined in money. EA also uses virtual stop loss based on the account's percentage amount. Traders can work with a classic grid where the distance between orders is fixed or choose a more "adaptive" dynamic grid with ATR-based dista

FFx Patterns Alerter gives trade suggestions with Entry, Target 1, Target 2 and StopLoss .... for any of the selected patterns (PinBar, Engulfing, InsideBar, OutsideBar) Below are the different options available: Multiple instances can be applied on the same chart to monitor different patterns Entry suggestion - pips to be added over the break for the entry 3 different options to calculate the SL - by pips, by ATR multiplier or at the pattern High/Low 3 different options to calculate the 2 TPs -

Percentile of Historical Volatility and Correlation Coefficient shows if the asset is cheap or expensive based on the volatility. It is used to determine a good entry point. It has two indicators built in: Historical Volatility is ranked percentile wise and its correlation to price action which gives an indication of the direction of a possible future move. Together the both indicators can give good entries and direction. Historical Volatility is a statistical measure of the dispersion of retu

Elevate your trading to new heights with Boom and CrashX, the advanced Expert Advisor (EA) designed with precision to enhance your trading experience. This EA leverages powerful indicators to provide accurate signals, streamline risk management, and boost profitability, ensuring a smooth operation in the ever-changing financial markets. Boom and CrashX is the perfect ally for both experienced traders looking to improve their strategies and newcomers embarking on their trading journey.
Enhanced
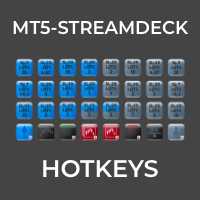
MT5-StreamDeck offers the possibility to use a certain number of pre-programmed Hot-keys with a clearly defined role. So by the push of a button you can open a trade with a pre-defined lot size, stoploss and take profit. Close all your trades, close the ones in profit, or in loss, set Break-even or set a trailing stop. All this with a Hot key button. See the feature list for all the actions that can take place at the push of a button. Ideal for Quick Scalping or day trading with set risk manage
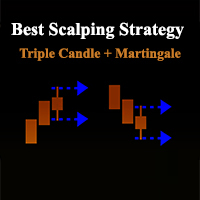
Best MT5 Scalping Strategy 3 Candle Parámetros recomentados H1 lotaje 0.01. Gestión del riesgo profesional Descubre el Robot de Scalping basado en la Estrategia de las 3 Velas. Este robot de trading de Forex ha sido desarrollado por MRBEAST como una herramienta para facilitar el trading intradía. Tenga en cuenta que el uso de este robot implica ciertos riesgos y no garantiza ganancias consistentes en el mercado de divisas. El robot de trading se basa en algoritmos y estrategias que he diseñado,

MT4 indicator version https://www.mql5.com/en/market/product/72342
I personally use this indicator to scalp. Accurate for accessing extremes and supports for buy positions primarily for 1 minute time frames. Other time frames can be used but the levels are different. Its a better oscillator and compare with others to see the difference. Day trade using neuro network concepts. This indicator uses elementary forms of neuro networks to generate signals to buy and sell. Use the indicat

The Advanced Trend Scalper MT5 indicator is designed to help both novices and professional traders. The indicator analyses the market and gives you buy and sell signals. It does not use any other indicators, it works only with the market actions. The signal appears right after the candle close and it does not repaint. The efficient algorithm provides a high degree of reliability of such signals. Advanced Trend Scalpe r for the MetaTrader 4 terminal : https://www.mql5.com/en/market/product/
The work of the utility is directed at opening new market orders, maintaining them, transferring the unprofitable orders into profit using an internal loss handling algorithm, trend filtering and various types of trailing stop and take profit. Suitable for any instruments and timeframes. The algorithm works separately for buys and sells, which allows simultaneously working in both directions as well. For the event when the additional orders opened by the utility do not become profitable, a StopO

Indicator that will show your Balance , and your Equity . Really simple to use, no specific requirements to install it. However you can deeply configure it for your own wishes. The pannel has 4 buttons. Only current will display the information of the chart you linked the indicator. If this is deselected, you will have the information of the whole account. Only Buys will display only the BUY orders and Only Sells will display only the SELL orders. Show Zero will display the 0

IMPORTANT: The indicator will remain at the price of $34.90 until the release of the update scheduled for July 16, 2024. The New Price will be $49.90 (taxes excluded) FVG indicator. If you are an SMC trader this indicator will be very useful to you, it automatically identifies the FVGs on the graph distinguishing them into 2 types: bearish FVGs and bullish FVGs (see the photos to understand better). This indicator works on any Timeframe and on any market you want to use it. If you are interested

MT5 Version Dashboard: Free scanner to monitor All pairs and timeframes. Please contact me after purchase, i will send it to you! MT4 version indicator: https://www.mql5.com/en/market/product/59127 Tip: This is an indicator for real-time signal display. When the indicator is loaded and running on the chart, the past signal cannot be displayed Market structure changes as price reverses And filter with all import features built inside one tool. Breaker's smart algorithm detects the reverses,
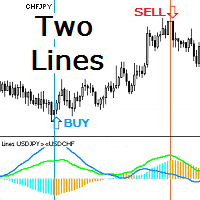
Индикатор показывает две линии динамики движения двух инструментов. Если один из коррелирующих инструментов убегает, другой будет его догонять. Этот принцип даёт точки входа в сделку по их кроссу или для синхронной покупки и продажи в парном трейдинге. Гистограмма индикатора показывает значение дистанции между линиями инструментов. При уменьшении и увеличении дистанции гистограмма принимает разные цвета. Треугольный значок показывает текущее состояние линий: расхождение ( Divergence ) или схо

Experience the Quantum Leap in Trading with Quantum Pending Wizard: Your Ultimate Path to Forex Success Welcome to the forefront of trading innovation with Quantum Pending Wizard ! Tired of the complexities of manual trading holding you back? It’s time to embrace a new era of efficiency and profitability with our cutting-edge automated trading solution. Unlock the Power of Quantum Pending Wizard Redefine your trading journey with Quantum Pending Wizard. Designed by the renowned expert Yuri Cong

The Relative Strenght Index presented to the world in 1978 by J. Welles Wilder Jr. in his book " New Concepts in Technical Trading Systems " is widely used around the world in several ways, not only with the traditional approach of Overbought and Oversold states, which in several cases and depending on the assets and timeframes it just simply doesn't work anymore . BUT, this indicator has its value when used, for instance, looking for divergences between its measuring system and the Prices appea

The Volume indicator is an excellent tool for measuring tick volume or real volume activity. It quickly and easily helps traders evaluate the volume's current size. The indicator for classification of the volume size uses the moving average and its multiples. Accordingly, the area where the volume is located (relative to the moving average) is labeled as ultra-low, low, average, high, very high, or ultra-high. This indicator can calculate the moving average by four methods: SMA - Simple Moving

For those who love to trade using the Heikin Ashi Candlesticks, here it is one more powerful ally: Heikin Ashi Volume . This indicator is an exclusive idea and creation from us at Minions Labs for you. The idea behind this indicator is to have a visual cue over the Heiken Ashi candles pointing at those candles with big volume. For this to happen you can choose between 2 different techniques of identifying the "high" volume: Higher Volume above the last N previous bars average. Higher Volume segm

The construction of a breakdown system includes the following steps: 1. Determination of the current volatility and the breakdown threshold. The current volatility, in this case, is defined as the difference between yesterday's daily high and the daily low. The breakdown threshold is set at 70-75% of this value. 2. Setting pending buy and sell orders. 3. Entering into a transaction, placing stop loss and take profit orders. Breakouts occur, as a rule, during periods of consolidation. As can be s

The initial price is 92.25 USD, the future price is 250 USD
Universal advisor with the use of economic and fundamental news " Smart News Trade ". Trading tactics are based on tracking the dynamics of the market and accelerating the price movement. Not guessing, not forecasting, only calculations with clear guidelines for the direction of positions. The work is carried out with pending orders, a stop loss is used to protect funds. A VPS server is required for smooth operation. Ease of use: Th

MMM ADX, P. SAR & MA strategy: As requested by some experienced traders, this EA's strategy uses its 3 built-in indicators to enhance its signals and decide to open a new order at the right time, there is an ADX indicator and you may choose its signal's strength, a parabolic SAR to help and confirm the trends and a MA to check if the prices are deviating from its patterns. By joining the 3 indicators' data, it is possible to calculate a good and strong trend direction, avoiding sudden market mov

For those traders who really care about Volume as an important vector information on Price Action, here is an exclusive idea & creation from Minions Labs: Volume Speed . The Volume Speed indicator shows you visually how much time (in seconds, minutes, hours, you choose) the Volume took to reach the Average Volume of the past bars. This way you can have the exact idea of "what is happening right now with the Volume of the current bar..." and take action accordingly with your strategy, having even

This indicator shows when user set sessions are active and returns various tools + metrics using the closing price within active sessions as an input. Users have the option to change up to 4 session times.
The indicator will increasingly lack accuracy when the chart timeframe is higher than 1 hour.
Settings
Sessions
Enable Session: Allows to enable or disable all associated elements with a specific user set session.
Session Time: Opening and closing times of the user set session

This is the Full Version, to get the free version please contact me. The free version works on “GBPCHF” charts. All symbols and time frames scanner. Harmonic Pattern
Harmonic patterns are used in technical analysis that traders use to find trend reversals. They are considered one of the most accurate technical analysis tools, as they allow traders to predict the future price movement direction and the potential trend targets. Also, unlike many other technical tools, the number of false signal

The indicator is intended for recognition and marking 1-2-3 buy and sell patterns on a chart. The indicator will help a trade to determine the starting and signal fractals, and to specify the possible entry points on all timeframes in МetaTrader 5. Fibonacci lines are drawn on the chart to indicate supposed targets of moving on the basis of the wave theory. The 1-2-3 formations appear to be especially important as divergences (convergences) are formed on price tops and bottoms. The indicator has

Heiken Ashi Smoothed Strategy is a very simple but powerful system to get forex market trend direction. This indicator is actually 2 indicators in 1 pack, Heiken Ashi and Heiken Ashi Smoothed Moving Average both included. Because HA (Heiken Ashi) and HAS (Heiken Ashi Smoothed) are calculated in the same one system event with necessary buffers and loop only, so it is the FAST, OPTIMIZED and EFFICIENT HA having the combined indicator of MetaTrader 5. You can choose to display HA and HAS in the sam

Ilan for MetaTrader 5 Due to using the virtual trades, trading in both directions (buy and sell) simultaneously became possible. This allows users to adapt the popular strategy for the net accounting of positions applied by MetaTrader 5.
Expert Advisor Settings The Expert Advisor setup is simple. However, all the important settings of the strategy are available for adjusting. Available tools: Unique MagicNumber for identification of trades; Trade direction option ( Trade direction ): buy on

Little Hanzel is t he best spike Detector, the indicator is made for trading Boom and Crash using the 1 min timeframe.It use levels on the 1 min timeframe to detect spikes.A horizontal line(order level) will appear on all the buying levels for on Boom and selling level, horizontal line will also appear on Crash. Join mql5 Little Hanzel channel https://www.mql5.com/en/channels/littlehanzel Input section: Choose Boom for the Boom indices (Boom 1000, Boom 500,and Boom 300 ) Choose Crash for t
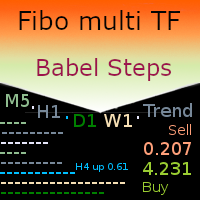
MT5 netting the “Babel Steps” robot uses the ZigZag indicator to generate Fibonacci levels on M1, M5, M15, H1, H4, D1, W1 periods of the charts , calculates the strength of trends for buying and selling. It opens a position when the specified trend level is exceeded plus Bollinger indicators and Stochastic indicators inform about oversold / overbought market. Stochastic and Bollinger indicators help to increase or decrease the position. If market moves into favorable direction the Robot genera

Yggdrasil is a fully automated hedging system . The EA opens orders in both direction on the chosen pairs by the user. Currency pairs aren't traded individually, all trades opened are part of the system. The algorithm will close the unprofitable orders with the available profit. It prevents drawdown to increase if a big trend occurs on a currency pair.
The EA is designed to be efficient with minimal settings . No need fine tuning parameters, it's a long term "set & forget" expert advisor.
A
This is a professional trading robot, which implements the classic strategy of trading on price crossing MA. When the price crosses a moving average, a Buy or a Sell signal is formed. Signal direction is set up in the EA parameters. The EA correctly processes errors, and works reliably in the market. Can work with the initial deposit from $100! It is important to choose the direction of the EA operation: both sides, only buy or only sell. The Expert Advisor uses the basic concepts, breakeven, tr

BeST_Hull Single MA Strategy is an Metatrader Indicator based on the famous indicator Hull Mov.Average . This indicator can display the Single HMA Strategy of just 1 Hull MAvg. It uses added internal filters locating the most likely Entries while it can be used as a standalone system or as an add-on to other ones.
Generally the Hull Moving Average (HMA - developed by Alan Hull) is a directional trend indicator . It captures the current state of the market and uses recent price action to determi

Initial price - $299, subsequent price - $399. Trinity MT5 - an advanced solution for automated trading!
Trinity MT5 is an automatic trading system based on the basic principle of Forex - return to the average price. The average price reversion principle works best on three currency pairs: AUDCAD, NZDCAD, AUDNZD. Live signal(2 years+) : https://www.mql5.com/en/signals/2228001 After purchasing EA, be sure to write to me in private messages, I will send you the set files. The robot settings are

트레이더를 위한 최고의 파트너! 트레이딩 어시스턴트 작동 지침 기본 사용 설정 기초적인: 지원 언어 선택 스위치 (현재 중국어 및 영어 지원) 자동 언어 인식 바인딩 지원 포지션을 열고 닫는 단축키 , 바로 가기 키를 사용하여 위치를 빠르게 열고 닫습니다... 위치를 닫는 바로 가기 키. 잠금 해제는 대부분의 기능을 지원합니다. 다시 하다 에서 사용할 수 있는 작업 테스트 환경 포지션 열기 및 닫기: 원클릭 위치 열기( 이익 실현 및 손절매를 위한 편리한 설정, 로트 크기 자동 계산 및 기타 편리한 기능 포함) 원 클릭 닫기 (잠금), 미니멀 스타일 디자인, 마감 포지션 유형, 마감 포지션 유형(긴 주문, 빈 주문 또는 대기 주문), 이익이 0보다 큰 주문을 마감할지 여부, 손실 주문을 마감할지 여부, 마감 비율 설정(0~100%), 마
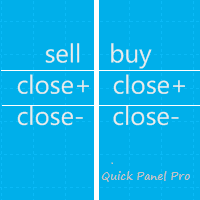
감시. 이 조언은 계좌 헤징에만 사용됩니다. 메타트레이더 4 버전 Quick Panel Pro
형질 일괄 계산은 빠르고 쉽습니다. 정지선을 이동하면 즉시 계산이 이루어집니다. 대부분의 비즈니스 거래는 이 패널을 클릭하는 것만으로 빠르게 완료할 수 있습니다. 녹색 버튼을 클릭하기만 하면 패널 간을 빠르게 전환할 수 있습니다. EA는 Strategy Tester에서 실행될 수 있습니다. 이 기능을 사용하면 전략을 훈련하고 확인할 수 있습니다. (무료이므로 한번 사용해 보세요.) 노란색 배경의 상자에 평균 가격을 표시하고 평균 가격에 대한 선을 그립니다. 여기를 클릭하세요 제어판 대시보드는 두 개의 열로 구성됩니다. 왼쪽 칸은 매도용, 오른쪽 칸은 매수용입니다. 판매: 판매 주문을 엽니다. 첫째: 첫 번째 매도 주문을 마감합니다. 첫 번째는 영업시간에 관한 것입니다. 마지막으로: 마지막 판매 주문을 마감합니다. 마지막으로 고려해야 할 것은 영업시간이다. all+

Session Volume Profile is an advanced graphical representation that displays trading activity during Forex trading sessions at specified price levels. The Forex market can be divided into four main trading sessions: the Australian session, the Asian session, the European session and the favorite trading time - the American (US) session. POC - profile can be used as a support and resistance level for intraday trading.
VWAP - Volume Weighted Average Price.
ATTENTION ! For the indicator to

The Multi Asset Monitor Panel is a game-changer for traders who need to keep an eye on multiple markets simultaneously. This innovative panel allows you to monitor any symbol and any timeframe you need, all within a single, organized interface. With up to three lists of symbols and customizable MT5 templates, you can tailor your monitoring setup to fit your specific trading strategy. What sets the Multi Asset Monitor Panel apart is its flexibility and customization options. You can control the s

RUBFX Trend histo mt5 , indicator works on synthetic indices, Currencies , Indices ,Stocks Gold etc , good for follwoing trend on the markets suitable for scalping Buy Rules; When the histo changes to Blue you place buy order ,stop loss just below the previous swing low Sell Rules; When the histo changes to Red you place sell order ,stop loss just below the previous swing high Trade on a timeframe which best suits your trading style

This is a non-trading expert which transforms unstructured web-pages into structured data tables. It downloads and parses an HTML file, then creates DOM ( Document Object Model ) for it, and finally applies specified CSS ( Cascading Style Sheets ) selectors for required fields and extracts data for them. You may consider it as a powerful and highly customizable HTML to CSV ( Comma-Separated Values ) converter. The EA can process web-pages from remote sites (using MetaTrader's WebRequest ) or loc

The ICT Unicorn Model indicator highlights the presence of "unicorn" patterns on the user's chart which is derived from the lectures of "The Inner Circle Trader" (ICT) .
Detected patterns are followed by targets with a distance controlled by the user.
USAGE (image 2) At its core, the ICT Unicorn Model relies on two popular concepts, Fair Value Gaps and Breaker Blocks. This combination highlights a future area of support/resistance.
A Bullish Unicorn Pattern consists ou

Breakouts with strong momentum are challenging to catch. The purpose of the Super Breakouts Monitor is to identify such market conditions. This indicator is inspired by a concept from renowned Technical Analyst Tushar Chande, who combines two highly adaptive indicators, VIDYA and the Dynamic Momentum Index (both his creations), to capture the early stages of a successful breakout. At Minions Labs, we've added our unique enhancements to adapt these great ideas for modern markets like stocks, cryp

MA Alert Indicator
You do not need anymore to constantly and tediously look at the chart . If your strategy uses any type of moving average with any settings, just add this indicator to the chart according to your required settings
You will be notified whenever the price hits your MA , whether touch or candle close by crossing it. Also, an arrow symbol will be displayed on the chart based on movement.
If you d o not have access to your computer, just set your MetaTrader notification by t

This is a simple and very effective utility for closing orders with one click. You will need it if you have a number of open orders on your balance and it takes too long to close them manually, which might lead to an extra loss of money on the account. The utility consists of an external panel with two buttons " Close by Filter" and " Close ALL" , which is convenient to move around the graph. You can set the Close ALL utility so that orders are closed as soon as the specified profit or loss va

It makes it easier for you to trade by providing trend charts in all frames from bottom to top. If it touches the upward trend, it is a good opportunity to sell, and the target is the downward trend, and vice versa. If it touches the downward trend, it is a good opportunity to buy, and the target is the upward trend. It can automatically redraw the trend. You can monitor higher frames and trade on lower frames for speculation .

DETECT THE TREND AND THE BEST PRICE TO ENTER A TRADE
Trend Detection for perfect entry - Distinguish the direction of thetrend and its strength, showing a line of different colors depending on whether the trend is strong bullish, weak bullish, strong bearish or weak bearish.- Best Entry point for perfect entry - Shows an area with the best entry in favor of trend. Never trade against the trend again.
Entry signals and alerts - When the price is in a valid zone, it sends pop up alerts, teleph

Welcome to the revolution of trading! We are a team of trading experts with many years of experience who have channelled their expertise into the development of Zazen EA. Zazen EA can also be used with PropTrading companies (for example FTMO). The EA has many functions (e.g. drawdown limit) that are specifically required in the area of prop trading. The name "Zazen" is no coincidence. It is derived from the Buddhist meditation practice that promotes calmness, serenity and clarity. Zazen EA is no
MetaTrader 마켓은 과거 데이터를 이용한 테스트 및 최적화를 위해 무료 데모 거래 로봇을 다운로드할 수 있는 유일한 스토어입니다.
어플리케이션의 개요와 다른 고객의 리뷰를 읽어보시고 터미널에 바로 다운로드하신 다음 구매 전 트레이딩 로봇을 테스트해보시기 바랍니다. 오직 MetaTrader 마켓에서만 무료로 애플리케이션을 테스트할 수 있습니다.
트레이딩 기회를 놓치고 있어요:
- 무료 트레이딩 앱
- 복사용 8,000 이상의 시그널
- 금융 시장 개척을 위한 경제 뉴스
등록
로그인
계정이 없으시면, 가입하십시오
MQL5.com 웹사이트에 로그인을 하기 위해 쿠키를 허용하십시오.
브라우저에서 필요한 설정을 활성화하시지 않으면, 로그인할 수 없습니다.