YouTubeにあるマーケットチュートリアルビデオをご覧ください
ロボットや指標を購入する
仮想ホスティングで
EAを実行
EAを実行
ロボットや指標を購入前にテストする
マーケットで収入を得る
販売のためにプロダクトをプレゼンテーションする方法
MetaTrader 5のための有料のエキスパートアドバイザーとインディケータ - 25

Indicador en MQL5, que obtiene el promedio de 10 EMAS, que son alineadas según Fibonacci, obteniendo un promedio, que sera suavizado. Se puede ingresar un numero desde 2 a N, que multiplica a los EMA-Fibonacci. Funciona en cualquier criptomoneda, etc. etc... pudiendo calcular el futuro segun la tendencia de las EMAS. Funciona excelentemente en tramos largos, determinando exactamente el mejor inicio/salida.
El precio inicial por apertura sera por un periodo de tiempo, luego aumentará.

Trading advisor for XAUUSD, trading based on support and resistance levels
Promotion for traders only!! Only the first 10 copies for $150, next price $200 (don't miss your chance) This trading advisor is designed specifically for trading the XAUUSD instrument using support and resistance levels. Support and resistance levels are key concepts in technical analysis and are used to determine likely price turning points. The advisor automatically detects these levels and uses them to make tradin

Hola Traders. By popular demand from my fellow traders, I am excited to announce the release of my newly developed tool for placing pending order grids. Many of you have already benefited from this tool, and several have requested a version for MT5. Now, it is available for everyone! This automatic grid trading placement tool is convenient, easy to use, and fast. It also includes quick action buttons for closing profits, losses, and pending orders. No matter how many pending orders you have, jus

Indicador "MR BEAST - Detectador de Mejores Spikes" para el Índice CRASH 1000 (M1) El indicador "MR BEAST - Detectador de Mejores Spikes" es una herramienta especializada y altamente precisa diseñada exclusivamente para operar en el índice CRASH 1000, con un enfoque específico en el marco temporal de 1 minuto (M1). Desarrollado por el reconocido trader Mr. Beast, este indicador ha sido meticulosamente diseñado para identificar únicamente los mejores spikes, permitiendo a los operadores capitaliz
The utility is designed to display on the chart the margin zones built on the basis of margin requirements for futures of the Chicago Mercantile exchange (CME). These margin zones are good levels of resistance and support, as seen in the screenshots.
How to use To trade on margin zones, use the following rules: buy after the day has closed above one of the zones to the next zone; sell after the day has closed below one of the zones to the next zone; after opening a sell trade, place limit sell

TREND HARMONY MT5 – Multi Timeframe Trend and Phase and Pullback Level Visualizer indicator for Metatrader5 The TREND HARMONY indicator automates deep trend analysis and generates visualizations for you. Take control of your trades by eliminating uncertainty! Revolutionize your trading experience with precision and insight through the TREND HARMONY Multi Timeframe indicator – your ultimate MT5 trend visualization indicator. [ Features and Manual | MT4 version | All Products ]
Are you t

Definition : VPO is a Volume Price Opportunity. Instead of using bars or candles with an Open, High, Low, and Close price, each "bar" in a Market Profile is represented by horizontal bars against the price It is called Market Profile terminology.
In other words volume-price-opportunity (VPO) profiles are histograms of how many volumes were traded at each price within the span of the profile.
By using a VPO chart, you are able to analyze the amount of trading activity, based on volume, for eac

GoldFusion: The Ultimate Trading Robot for XAUUSD H4 The GoldFusion trading robot is optimized to operate on the XAUUSD currency pair with an H4 (4-hour) trading timeframe. It offers a strategic approach for traders aiming to combine precision with adaptability in their trading. Technical Indicators Used Seasonal Trend Analysis (Thursdays) : GoldFusion leverages seasonal patterns by focusing on trends that emerge on Thursdays. This targeted approach allows the robot to capitalize on consistent w

Dear users!
- This is a Forrex trading expert advisor following the trend trading method. It has proven its effectiveness in overcoming 2 rounds of FTMO fund challenges. This is a modified and optimized version after completing the process of passing 2 rounds of FTMO challenges. - Max drawndown auto caculate by risk initial setting. Telegram instruction for backtest and using: https://t.me/ +0lDs0UXiJUVjM2Jl I. Application Highlights: 1. Safe and easy to use. 2. Martigale and grid are not ap

this is an indicator to clarify seeing Low and High in the market and is very useful for facilitating those who are studying technical price action
this is a type of indicator that gives color to the candlestick where the indicator is divided into 3 colors red = bearish green = Bullish
Gray = base
this indicator can be used on the forex market or the mt5 binary market. https://t.me/SBA_FOREX_SIGNAL

STL TradeBooster trades on the currency pairs EUR/USD, GBP/USD, USD/CAD, AUD/USD, on the 5-minute timeframe. STL TradeBooster works with any deposit STL TradeBooster enters the market on the Stochasic and MA indicators STL TradeBooster has a convenient control panel STL TradeBooster trades in two modes Safe mode and Hard mode Safe mode - intermediate lot 0.02 is used in a series of orders, trailing stop is activated, which prevents gaining profit, but also does not increase large series. Sui

Description :
VWAP (Volume-Weighted Average Price) is the ratio of the value traded to total volume traded over a particular time horizon. It is a measure of the average price at which pair is traded over the trading horizon. Read More.
All Symbols and All Timeframes are supported.
Indicator Inputs :
VWAP Mode : Mode of VWAP Calculation. Options can be selected : Single,Session,Daily,Weekly,Monthly
Volumes : Real Volumes,Tick Volumes
Price Type : Used price for cal

ATR Scanner Pro is a multi symbol multi timeframe volatility scanner that monitors and analyzes Average True Range indicator value in up to 28 symbols and 9 timeframes in 3 modes : ATR value: As a volatility dashboard it shows the ATR indicator value in all pairs and timeframes and signals when the ATR value reaches a maximum or minimum in a given duration. Short term ATR/Long term ATR ratio: It shows ratio of 2 ATRs with different periods. It's useful in detecting short term volatility and

テストおよび使用前に EA を最適化してください。
Bitcoin M5 は、5 分チャートで BTC/USD を取引するためのものです。SL と TP は 50000 から開始する必要があります。使用前に最適化してください。
この取引戦略では、ボリンジャー バンドとエンベロープ インジケーターを使用して取引を行います。価格がバンドを突破するブレイクアウト ポイントを捉えて取引し、価格がエンベロープを越えたときに終了します。すべての取引で固定ロット数が使用され、SL と TP があります。EA は、ロジックでマーチンゲールやヘッジを使用しません。
テストおよび使用前に EA を最適化してください。
Bitcoin M5 は、5 分チャートで BTC/USD を取引するためのものです。SL と TP は 50000 から開始する必要があります。使用前に最適化してください。
この取引戦略では、ボリンジャー バンドとエンベロープ インジケーターを使用して取引を行います。価格がバンドを突破するブレイクアウト ポイントを捉えて取引し、価格がエンベロープを越えたときに終了しま

通知を送信するための自動システム。これにより、サブスクライバーが取引端末からの取引イベントを見逃すことはありません。アカウントの取引操作に関する通知をTelegramメッセンジャーに送信するユーティリティ。 テレグラム->ここ/ MT4- > ここ でユーティリティをチャンネルに接続するためのステップバイステップの説明 利点: 簡単なセットアップと詳細な手順、 調整可能なスクリーンショットを送信する可能性、 絵文字を使用してカスタマイズ可能な通知テキスト、 完全または部分的な開始、終了、および注文の変更に関する通知の調整、 デフォルトで通知を送信する場合、テキストファイルは自動的にダウンロードされます。 保留中の注文の発注または削除に関する通知の調整、 記号とマジックナンバーによる便利なフィルタリング。 入力変数: TELEGRAM BOT AND CHAT SETTINGS Telegram bot token - Enter the token number received after registering the bot in "BotFather" Teleg

The "VSA on the FLY" indicator is designed to quickly display various Volume Profile / Market Profile parameters.. The indicator takes the initial data for operation from the M1 timeframe. The indicator is installed on any timeframe and starts displaying data starting from the selected left border. This can be the beginning of a day, a week, a trading session, any hour, etc.
The version of this indicator for MetaTrader 4 can be found here .
The following input parameters are available: Show

A Price Action Trading Expert Advisor (EA) is a type of automated trading system designed to execute trades based on price action patterns and signals. Price action trading focuses on analyzing historical price movements to identify potential future price movements without relying on conventional technical indicators.
Here are key aspects and characteristics of a Price Action Trading Expert Advisor:
1. **Strategy Based on Price Action Patterns**: The EA is programmed to identify and trade b

StartPoint是一个很好的短线交易指示器,这个指标可以单独使用,但是最好是配合 HighQualityMap 一起使用,适用于任何时间框架,喜欢超短线的朋友可以使用M5时间框架。它能很好的体现出短期趋势的启动点,你可以很快的从这个指示器上寻找到最佳的buy和sell位置,同时也能很好根据指示器去坚守自己的持仓定订单。指标不含有未来函数,不会重新绘制,不仅能够应用到自己的手动交易过程中,还能完全可以写入到自己的EA中。(如果你感觉到这个指标能够帮助你进行更准确的交易,请帮忙给个好评,希望我的作品能够帮助更多有需要的人) ===================参数列表===================== 所有参数均采用默认参数即可,无需更改,若为激进型交易者,可以根据自己的需要来调整参数。 =================参考使用方法=================== 此指标可以适用于任何交易品种。

HighQualityMap是一个很好的中长线交易指示器,这个指标可以单独使用,尤其是用在M30或者大于M30的时间框架下,它能很好的体现出趋势的走向,以及转折点,你可以很快的从这个指示器上寻找到最佳的buy和sell位置,同时也能很好根据指示器去坚守自己的持仓定订单。指标不含有未来函数,不会重新绘制,不仅能够应用到自己的手动交易过程中,还能完全可以写入到自己的EA中。(如果你感觉到这个指标能够帮助你进行更准确的交易,请帮忙给个好评,希望我的作品能够帮助更多有需要的人) ===================参数列表===================== 所有参数均采用默认参数即可,无需更改,若为激进型交易者,可以根据自己的需要来调整参数。 =================参考使用方法=================== 此指标可以适用于任何交易品种,使用周期框架大于M30相对更准确。

This indicator is an extended implementation of Weis waves. It builds Weis waves on absolute volumes (which is the classical approach) or delta of volumes (unique feature) using different methods of wave formation and visualization. It works with real volumes, if available, or with tick volumes otherwise, but also provides an option to use so called "true volume surrogates", as an artificial substitution for missing real volumes (for example, for Forex symbols), which was introduced in correspo

MT4 Version Understanding market sentiment is a critical aspect of successful trading. Market sentiment refers to the overall feeling or attitude of traders and investors towards a particular financial instrument, such as a stock, currency pair, or cryptocurrency. It is a collective perception of market participants' emotions and beliefs about the asset's future price direction. Market sentiment can be bullish (positive), bearish (negative), or neutral (sideways). Knowing the market sentiment ca

This non-trading expert utilizes so called custom symbols feature ( available in MQL API as well) to build renko charts based on history of real ticks of selected standard symbol. RenkoFromRealTicks generates custom symbol quotes, thus you may open many charts to apply different EAs and indicators to the renko. It also transmits real ticks to update renko charts in real time. The generated renko chart uses M1 timeframe. It makes no sense to switch the renko chart to a timeframe other than M1. T

Order Book, known also as Market Book, market depth, Level 2, - is a dynamically updated table with current volumes of orders to buy and to sell specific financial instument at price levels near Bid and Ask. MetaTrader 5 provides the means for receiving market book from your broker, but in real time only, without access to its history. The library OrderBook History Library reads market book state in the past from archive files, created by OrderBook Recorder . The library can be embedded into you

Line function : Displays the opening line, Stop Loss, Take Profit( 3:1 RR ) on the chart. Risk management : The risk calculation function calculates the volume of a new order taking into account the established risk and the size you want to risk. It allows you to set any Stop Loss size between 3 and 10 pips. Breakeven Button : Brings all open orders to Breakeven. Clear button : Clears the graph and the selected parameters. Trade Button : Execute the idea. Partials Button : Taking partials of al

[ MT4 Version ] [ Discord Signals ] MT5 to Telegram Signals
Connect your broker account with Telegram and stop missing important notifications. Would you like to receive Telegram notifications? Are you looking for a simple way to share trade signals with your followers? Do you need to start documenting your trades with an automated trading diary? Check out this step-by-step Tutorial . This utility is simple to use and supports a wide variety of settings: Pick your desired Telegram group

### Welcome to News Snowball!
"News Snowball" uses advanced algorithms to analyze economic data in real time. It detects and reacts instantly to major economic announcements, optimizing your trading opportunities. The robot monitors a wide range of economic information sources, including press releases, financial reports, and government announcements. This ensures comprehensive coverage and in-depth analysis of events influencing the markets.
All trades have a stop loss and take profit, but

MT4 Version Order Blocks Zone Scalper is dedicated to all people who like order blocks trading but do not have the time to stare at the charts every day or the discipline to follow a trading strategy. It is also for everyone who likes to experiment and optimize parameters on their own. If you belong to this type of person, it is your lucky day, as I decided to keep all EA parameters available to you so that you can optimize the EA to your own taste. To understand how this EA works, come read my

PLEASE CONTACT ME BEFORE PURCHASE FOR DISCOUNT UP TO 50% Key Features:
Full Range Breakout Strategy: The EA continuously monitors price movements and identifies breakout points based on predefined high and low ranges. When the price moves beyond these levels, the EA automatically opens trades, positioning itself to take advantage of potential price trends. Trailing Stop Loss: To enhance risk management and protect profits, the EA includes a trailing stop loss feature. This functionality allow

Ilanis is an Expert Advisor for stock trading, it can be used for trading on Forex and other markets, including commodities, metals and index markets. To determine the market entry, the EA uses the modern and ultra-light adaptive indicator FourAverage. Principle of position maintaining is similar to that of the popular Forex robot Ilan, using averaging. But unlike Ilan, Ilanis uses an accurate entry into the market. The robot pays a lot of attention to position control, if the price goes in the

トレーダーのベストパートナー! 取引アシスタントの操作手順 基本的な使用設定 基本: 言語選択スイッチをサポート (現在中国語と英語をサポート) 自動言語認識 バインディングをサポート ポジションを開閉するホットキー 、ショートカット キーを使用してポジションをすばやく開閉します... ポジションを閉じるためのショートカット キー。 ロック解除はほとんどの機能をサポートします リプレイ で使用できる操作 テスト環境 オープンポジションとクローズポジション: ワンクリックでポジションをオープン ( テイクプロフィットとストップロスの便利な設定、ロットサイズの自動計算などの便利な機能を含む) ワンクリックで閉じる (ロック)、ミニマリストスタイルのデザイン、クローズポジションのタイプ、クローズポジションのタイプ(ロング注文、空の注文、または未決注文)、利益が0より大きい注文をクローズするかどうか、損失注文をクローズするかどうか、クローズ率の設定(0〜100%)、クローズを反転するか

Introducing HammerMaster EA , your ultimate trading assistant designed for the MQL5 market. Harness the power of technical analysis with our expert advisor that identifies and capitalizes on hammer candlestick patterns. Whether you’re a novice or an experienced trader, HammerMaster EA offers robust features to enhance your trading strategy and maximize your potential profits. Strategy Overview HammerMaster EA is based on the identification of hammer candlestick patterns, specifically the bullish

Universal Telegram Alerts is a cutting-edge trading tool that seamlessly integrates with both MT5 and Telegram, providing traders with unparalleled flexibility and convenience. The EA links your MT5 platform with Telegram, sending real-time alerts with screenshots of the chart directly to your Telegram from any indicator with buffers. The EA allows you to stay connected to your trading account at all times, even when you're away from your computer. You can receive alerts on your mobile device o

金融指標 SolarTrade Suite: Mercury Market Indicator - 金融市場の世界で信頼できるガイドです!
これは、革新的で高度なアルゴリズムを使用して値を計算する移動平均であり、見た目にも美しいデザインです。
この指標の読み方を理解するのは非常に簡単です。青色 - 買い、赤色 - 売り。
色が明るいほど、シグナルが強くなります。
説明の下部にある他の SolarTrade Suite 製品をご覧ください。
投資と金融市場の世界を自信を持ってナビゲートしたいですか? SolarTrade Suite 金融指標: Mercury Market Indicator は、情報に基づいた投資決定を行い、利益を増やすのに役立つように設計された革新的なソフトウェアです。
SolarTrade Suite 金融指標: Mercury Market Indicator の利点:
- 正確な予測: 当社の指標は、高度なアルゴリズムと分析方法を使用して、市場の動きを正確に予測します。
資産の売買に最適なタイミングに関するシグナルを取得します

Multicurrency and multitimeframe modification of the Commodity Channel Index (CCI) indicator. You can specify any desired currencies and timeframes in the parameters. Also, the panel can send notifications when crossing overbought and oversold levels. By clicking on a cell with a period, this symbol and period will be opened. This is MTF Scanner. The key to hide the dashboard from the chart is "D" by default.
Parameters CCI Period — averaging period.
CCI Applied price — price type.
Clea

This indicator displays the wave structure of the market in the form several wave levels nested in each other. For each of these levels an automatic preliminary (draft) marking of waves in Elliott's style (123..., ABC... etc.) is created. This markup is completely automatic and absolutely univocal. The indicator is especially useful for beginner wave analysts, because among all the possible versions for wave marking, it allows you to immediately take the most adequate version as a ba

QuantAlgo Signal is one of our best Premium Indicators.
It was designed with an intention of giving traders clear and precise entry signals.
It's main strength is in the possibility of simulating the trades and giving you realistic results.
With this features it is incredibly simple to find the settings you like the best!
QuantAlgo Signal is very simple to use, therefore it is suitable for both beginning and experienced traders.
Features: Precise Entries Backtesting simulation

Unlike most other EAs in the market, I always assure every single of my EAs are of highest quality: Real trades will match backtesting. No loss hiden techniques to hide historical losses, no manipulated backtest to make backtesting curve smooth without loss (only naive traders believe in smooth upward curve with no risk - they are most likely scamming). My EA always have multi-years verified statistical trading edge. Robust and long term stable with sensible risk management. Not sensitive to sp

Synthetic Reverse Bar is an evolution of Reverse Bar indicator. It is well-known that candlestick patterns work best at higher timeframes (H1, H4). However, candlesticks at such timeframes may form differently at different brokers due to dissimilarities in the terminal time on the single symbol, while the history of quotes on M1 and M5 remains the same! As a result, successful patterns are often not formed at higher timeframes! Synthetic Reverse Bar solves that problem! The indicator works on M5

A trend expert with a trained neural network. It works according to the strategy of averaging trading positions. Parameters Minus - decrease a take profit when opening a new order
InpStepMinus - take profit level decrease step for an order grid in points
TakeProfit - profit in points for the main grid of orders
StopLoss - limitation of losses in points
Distance - the distance to ope

Do you already know the Start Midas indicator?
What about the Vwap Standard Deviation indicator?
And I need to speak again in the book MIDAS Technical Analysis ...
The Start Midas SD Channel indicator combines the two in one, bringing the practicality and efficiency of Midas with the statistical calculation of the standard deviation.
All of this with the practicality of the White Trader Start indicators, where you can plot the indicator and move them on the screen using keyboard s

SuperMax MT5 is a fully automated, intelligent expert advisor with advanced mechanisms, using a dynamic system to measure market volatility to be consistent with the timing of market entry and exit. The mechanism of this system is based on the principle of mean reversion and momentum of market price. Rely on scalping and recovery strategies with optimal trading frequency and can still work well in all market conditions, be it trend or sideways, can be traded full time in any condition. This EA

This indicator can identify more than 60 candlestick patterns on the chart, including their bullish and bearish variants. Just choose the pattern you want in the settings.
Available Patterns 2 Crows Gravestone Doji On Neck 3 Black Crows Hammer Piercing 3 Inside Hanging Man Rick Shawman 3 Line Strike Harami Rising and Falling Three Method 3 Outside Harami Cross Separating Lines 3 Stars in South High Wave Shooting Star 3 White Soldiers Hikkake Short Line Abandoned Baby Hikkake Modified Spinning

I've combined two trading strategies, the Order Block Strategy and the FVG Trading Strategy, by utilizing a combination of the FVG indicators and Order Blocks. The results have been surprisingly effective.
This is a two-in-one solution that makes it easy for traders to identify critical trading zones. I've optimized the settings so that all you need to do is install and trade; it's not overly complex to explain further. No need for any usage instructions regarding the trading method. You shou

Um Inside Bar é um dos principais sinais de continuidade de uma tendência existente e as vezes reversão, pois nos mostra locais especiais de entrada, possibilitando uma boa taxa de Risco x Retorno. É simples visualizar um Inside Candle. Esse padrão é formado por apenas dois candles. O primeiro deve ser, preferencialmente grande, e o segundo deve estar integralmente contido dentro dos limites de máxima e mínima do primeiro.

金融指標 SolarTrade Suite: Pluto Market Indicator - 金融市場の世界で信頼できるガイド!
これは、特別な革新的で高度なアルゴリズムを使用して値を計算するボラティリティ オシレーターであり、見栄えの良いデザインも備えています。
このインジケーターの読み取り値を理解するのは非常に簡単です。緑色 - ボラティリティが低く、取引を開始するのに最適な時期、オレンジ色 - ボラティリティが高く、取引ポジションのクローズを検討する時期。
色が明るいほど、信号が強くなります。
利便性のために、このインジケーターのウィンドウをクリックして信号を反転することができます。
説明の下部にある他の SolarTrade Suite 製品をご覧ください。
投資と金融市場の世界を自信を持ってナビゲートしたいですか? SolarTrade Suite 金融指標: Pluto Market Indicator は、情報に基づいた投資決定を行い、利益を増やすのに役立つように設計された革新的なソフトウェアです。
SolarTrade Suite 金融指
パーフェクトセコンドチャートインジケーターを使用すると、分のローソク足を秒に変換できます
1. バーを正確な時間で 100% 閉じるために任意の秒数を選択します。
2. これはレートベースのデータです。ティックが利用できない場合でも機能します。
3. 外部 DLL は不要で、VPS 上でスムーズに動作します
4. 高速で最適化されたコード
5. BInance、Kucoin、先物チャートを簡単に秒単位に変換できるその他すべての取引所などの暗号ペアをサポートします。
6. ゴールドや外国為替ペアなど、あらゆるタイプのシンボルをサポートします。
7. シンボルとレートを削除するオプション。 パーフェクトセコンドチャートインジケーターを使用すると、分のローソク足を秒に変換できます
1. バーを正確な時間で 100% 閉じるために任意の秒数を選択します。
2. これはレートベースのデータです。ティックが利用できない場合でも機能します。
3. 外部 DLL は不要で、VPS 上でスムーズに動作します
4. 高速で最適化されたコード

このインジケーターは、同じチャート上で追跡したい他の時間枠のローソク足を効率的に追跡します。
1. 同じチャートにバーをロードするには、より高い時間枠を選択します
2.ローソク足の色とスタイルをカスタマイズする
3. ローソク足を描画するバーの数を選択します
4. 芯と本体とともにより高いタイムフレームの完全なキャンドルを追跡する
5. チャートを切り替えたくない人にとっては簡単で便利です。
このインジケーターは、同じチャート上で追跡したい他の時間枠のローソク足を効率的に追跡します。
1. 同じチャートにバーをロードするには、より高い時間枠を選択します
2.ローソク足の色とスタイルをカスタマイズする
3. ローソク足を描画するバーの数を選択します
4. 芯と本体とともにより高いタイムフレームの完全なキャンドルを追跡する
5. チャートを切り替えたくない人にとっては簡単で便利です。

このインジケーターを使用すると、フィボナッチレベルのラベルを大きなフォントサイズで表示できます。
。 最大 25 のフィボナッチレベルをサポートします
- フィボナッチを描画するとすぐに、入力パラメータとして追加したレベルが、選択した色とフォントの大きなフォント サイズで表示されます。
カスタマイズ可能なオプション:
1.フィボテキストフォント
2.フィボテキストサイズ
3.フィボテキストの色
3. 各レベルに説明を追加します
4. アンカーや度数などのその他のオプション
このインジケーターを使用すると、フィボナッチレベルのラベルを大きなフォントサイズで表示できます。
。 最大 20 のフィボナッチレベルをサポートします
- フィボナッチを描画するとすぐに、入力パラメータとして追加したレベルが、選択した色とフォントの大きなフォント サイズで表示されます。
カスタマイズ可能なオプション:
1.フィボテキストフォント
2.フィボテキストサイズ
3.フィボテキストの色
3. 各レベルに説明を追加しま
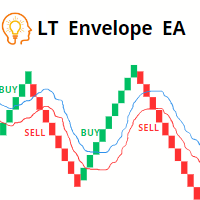
当社の革新的なLTエンベロープEAをご紹介いたします。エンベロープ指標を活用した強力なツールで、トレンド追跡を強化し、金融市場での取引を最適化することを目指しています。このエキスパートアドバイザーは、トレーダーに優れた主要機能と柔軟性のある機能を提供するよう特別に設計されており、トレンド追跡に不可欠な解決策となります。
主な特徴:
1. エンベロープ指標ストラテジー:当社のEAはエンベロープ指標に基づくすべての取引を自動化し、トレンド追跡の能力を活用して市場のエントリーと出口を正確に行います。
2. タイムフレームの多様性:複数のタイムフレームで当社のEAを使用する自由を体験し、さまざまな取引スタイルや好みに対応します。
3. カスタマイズ可能なトレード方向:EAを独自のトレード戦略に合わせて調整し、希望のトレード方向を選択することで、取引に対するより多くの制御を得ることができます。
4. スマートなマネーマネジメント:リスク管理を自分でコントロールし、独自のロット割合を設定することで、最適な資本配分を確保します。
5. 複数の取引管理:当社のEAは複数の取引

このインジケーターはバイナリー オプションのエントリーシグナルを生成し、チャート上に矢印を描き、警告音を発します。
営業時間: 6.00 GMT/ 17.00 GMT (17.00 GMT以降および夜間は、ボラティリティが低すぎて取引量が不足するため推奨されません)
ペア: EUR/USD (@EU6)、GBP/USD (BP6)。
時間枠: 1、2、3、5、10、15 分 最適な時間枠: 3 分
有効期限: キャンドル 1 本
このインジケーターが機能するには、実際のボリューム (ティックボリュームなし) が必要です。EUR/USD、GBP/USD ECC スポットペアでは機能しませんが、参照先物契約 (ティッカー) では機能します。したがって、メタトレーダー 5 のブローカーを使用する必要があります。リアルタイムで実際の出来高を伴う先物契約を提供します。
EUR/USD の参照先物: @EU6 GBP/USDの基準先物はBP6です。
リアルタイムで実ボリュームの先物を無料で提供するブローカーの 1 つが AMP GLOBAL です。 (mt5 で、ファ

トレードコピー - 投資家パスワード - コピートレード - MT4 x MT5 クロスプラットフォーム
注: クライアントアカウントがフォローするマスターアカウントに「ミラーコピーマスター」、マスターアカウントがフォローするクライアントアカウントに「ミラーコピークライアント」の両方が必要です
ブログ: https://www.mql5.com/en/blogs/post/756897
仕組み:
https://www.youtube.com/watch?v=V7FNpuzrg5M
MT4 バージョン
マスター: https://www.mql5.com/en/market/product/114774
クライアント: https://www.mql5.com/en/market/product/114843
MT5 バージョン
マスター: https://www.mql5.com/en/market/product/114775
クライアント: https://www.mql5.com/en/market/product/114844
「
TP SL Bot is a utility that automatically sets Stop Loss and Take Profit for newly opened orders in several ways. There is also a function for calculating the volume that you need to open the trade to get the desired amount with the specified Stop Loss / Take Profit size. There are several options for calculating the size and setting parameters: 1. Setting based on the amount specified by the user as a percentage of the current deposit balance. 2. Setting as the amount entered by the user. 3. Se
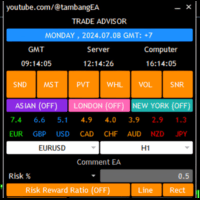
Trade Advisor : チャートをマスターする
プロのトレーダーのための究極のエキスパート アドバイザー (EA) アシスタント
バージョン MT4 バージョン | MT5 バージョン | ブログ
Trade Advisor は、トレーディング戦略を向上させるために設計された、洗練されながらも使いやすいエキスパート アドバイザー (EA) です。強力なトレーディング インジケーターと高度な資金管理機能を統合することで、Trade Advisor はすべてのトレードで精度と効率を保証します。
主な機能:
1. 供給と需要のゾーン:
主要な供給と需要のゾーンを特定し、潜在的な反転領域を強調します。
これらのゾーンに基づいてロット サイズを計算し、最適なリスク管理を行います。
2. 市場構造分析:
市場構造を分析して、トレンドの方向と潜在的なブレイクアウト ポイントを決定します。
市場の状況に基づいて明確なシグナルを提供します。
3. ピボット ポイント:
日次、週次、月次のピボット ポイントを使用して、潜在的なサポート レベルと

Simple ATR Modern 市場のボラティリティをより明確に追跡するためのシンプルなツールで、デイトレードやスイングトレードに最適です。 取引を開始する際や初心者にとって最適なインジケーターです。
ビジュアルインジケーターの色: ATR Daily - 青 Volatility Vision インジケーターと組み合わせて分析を強化しましょう。 市場の状況の変動を正確に測定し、デイトレードやスイングトレードの意思決定に不可欠です。 基本的な14日間(設定可能)の単純移動平均の真の範囲インジケーターを利用して正確性を確保します。 取引システムにおける取引開始または終了戦略の実施に理想的で。 ATR インジケーターが他より優れている理由: 簡単に使用できる: ATR インジケーターは設定が簡単で、初心者のトレーダーでも理解しやすいです。 汎用性: デイトレードやスイングトレードのどちらにも適しており、さまざまな取引戦略に柔軟に対応できます。 信頼性: ATR は正確な市場ボラティリティデータを提供し、トレーダーがより賢明な判断を下すのに役立ちます。 カスタマイズ可能: 移動平均期
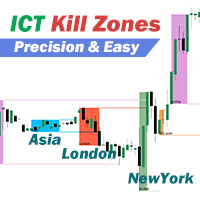
ICT killzonesの5つのタイムフレームを異なる色で識別し、トラッキングに 従ってタイムフレーム内の価格領域をマークすると、ピボットポイントの高値と 安値の基準線が、ピボットポイントの価格がブレイクされるか、取引タイム フレームが終了するまで自動的に延長されます。 このインディケータは、トレンドに沿った取引を行うためのブレイクアウトポイン トを見つけるのに役立ちます。 ICT killzonesは、出来高とボラティリティが増加する傾向のある市場の特定 の時間帯であり、トレーダーに潜在的な収益機会を開きます。 5つの killzones はすべて、独自の色と時間枠でカスタマイズ可能で、好みに合わせて微調整したり、まったく異なる時間帯に調整することができます。 インジケータは自動的に調整を追跡します。 インジケーターを初めて使用する際は、時間オフセットを設定する必要があります。Current Broker UTC Shiftに、MetaTraderブローカーのUTC時差を入力してください(例: MetaTraderのデフォルトがUTC+3のMoscowタイムゾーンであれば3を、北

The Strat を使用して取引する場合、複数の時間枠に注意することが重要です。 このインジケーターは、各時間枠の現在のローソク足の毎日、毎週、毎月、および四半期ごとの状態を示します。 円のアイコンは、その時間枠のろうそくが現在インサイド、または TheStrat 用語でタイプ 1 であることを示します。 Inside Day ローソク足が値動きを強化しており、レンジのブレイクアウトを探しています。 上向きまたは下向きの三角形のアイコンは、トレンド キャンドル、または TheStrat 用語ではタイプ 2 です。トレンドろうそくは強気または弱気のいずれかであり、以前のろうそくの範囲を突破し、現在一方向にトレンドになっていることを示します. 正方形のアイコンはアウトサイド キャンドル、またはストラト用語でタイプ 3 です。これは 2 つのことを示しています。1 つはその時間枠での方向性について価格が未定であり、おそらく非常に途切れ途切れであるということです。もう 1 つは、より短い時間枠では短い反転取引を行う良い機会がある可能性が高いということです。正方形は強気または弱気の色になり、ど

作業ロジック この指標の重要性は、「燃料が機器に残っている」量を理解できるという事実にあります。状況を想像してみてください。あなたが半分放電したバッテリーを搭載した車に残した場合、平均して、この量のエネルギーは通常250 kmの車に十分であるため、必要に応じて700kmの距離を超えることはできません。そのため、商品ごとに一定の日次価格変動があり、統計的観察の結果、資産が1日あたり1 ATRを通過する時間の95%、2以上のATRを通過する時間の5%のみであることが明らかになりました。
例、毎日のATR EURUSD = 682ピップ。トレードに参加します。たとえば、TPが500ピップのレベルのブレイクアウトの場合、正しいTPサイズを設定したように見えますが、資産がすでに1日のATRの90%を通過していることを考慮していません。取引が開始された時間、したがって、楽器にはTPを受け取るのに十分なエネルギーがない可能性があります。楽器の残りのチャージが10%しかない場合は、TPを調整するか、取引にはまったく参加しません。
パワーリザーブインジケーターは、計測器が慣性を使い果たした量を

このインジケータは、横ばいを検出し、検出された領域を色の付いた四角形で塗りつぶします。
このインディケータの主なアイデアは、価格がチャート上の特定の領域を埋 めたときにフラットを検出することです。
入力パラメータ
Color rectangle - 影を付ける矩形の色。
Bars in rectangle - 長方形内のバーの最小許容数。
Density in % - 平坦の密度。矩形の面積に対するパーセンテージで設定。 __________________________________________________________________ __________________________________________________________________
Mt4 Version : https://www.mql5.com/en/market/product/107249
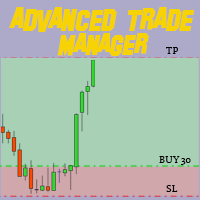
MT4 および MT5 のアドバンスト トレード マネージャーで取引に革命を起こしましょう 精度と制御のための究極のツールである MT4 および MT5 アドバンスト トレード マネージャーを使用して、取引戦略を強化します。 従来のトレードマネージャーを超えて、当社のトレードマネージャーは市場の状況に動的に適応するだけでなく、取引に参加した瞬間に自動的にストップロスとテイクプロフィットのレベルを設定します。
主な特徴:
自動エントリー戦略: 当社のトレードマネージャーの自動エントリー戦略により、即座にチャンスを掴みます。 取引を開始すると、システムは事前に定義されたストップロスとテイクプロフィットを戦略的に設定し、最初から規律あるリスク管理を保証します。
動的なストップロス管理: 市場の変化にリアルタイムで反応します。 取引の利益が +0.50% に達すると、システムは自動的にストップロスを半分にし、リスクを抑えながら利益を守ります。
損益分

Trading ICT's OTE Concept is simplified with the ICT Optimal Trade Entry Tool. This semi-automatic EA/utility allows trading with manually defined Fibonacci retracement levels. Simply anchor the Fibonacci between swing highs and lows, select your desired entry level in the graphical panel, and the tool automatically opens positions based on your predefined direction. No more waiting in front of charts for price action to reach your entry levels; set the Fibonacci, enable your chosen entry level,

1.このEAは、出口戦略(リバース/ヘッジ)マーチンゲールを備えた自動テイクプロフィット、ストップロス、トレーリングストップ&プロフィットロックです。
2. PCチャートまたはモバイル取引(VPSの場合)のいずれかでの手動取引に適しています
3.変数入力はピップ単位です
4. 1番目の位置は自分で手動で開きます(購入/販売)。その後、TP、SL、TS、プロフィットロックが設定されます。
5.最初の手動取引(失敗)がトレンドに反する場合、2つの出口戦略があります。
(a)リバースマーチンゲール(売り)は、最初の手動取引(買い)がSLに当たったときにアクティブになります。
(b)最初の手動取引(購入)がSLにヒットすると、ヘッジマーチンゲール(購入)がアクティブになります。
*最初の手動取引(売り)がSLに当たったときはその逆です。
6.トレーリングストップとトレーリングステップは、最初の手動取引がトレンドに入ったが突然逆転したときにアクティブになります。
7.利益ロックは、同じペ

The DR IDR Range Indicator PRO plots ADR, ODR and RDR ranges for a given amount of days in the past. A key feature that appears is that it calculates the success rate of the ranges for the shown days. This indicator is perfect for backtest since it shows ranges for all of the calculated days, not just the most recent sessions. In the PRO version you can now: use fully customizable advanced statistics to base your trades on get an edge via calculating statistics on up to 3 different day period

このマルチタイムフレームおよびマルチシンボルインジケーターは、ストキャスティクスシグナルラインがストキャスティクスメインラインと交差する時期を識別します。代替手段として、ストキャスティクスが買われ過ぎ/売られ過ぎの領域から(シグナルラインがメインラインを横切ることなく)離れるときに警告することもできます。ボーナスとして、ボリンジャーバンドやRSIの買われ過ぎ/売られ過ぎのクロスもスキャンできます。このインジケーターを独自のルールやテクニックと組み合わせることで、独自の強力なシステムを作成 (または強化) することができます。 特徴 相場監視ウィンドウに表示されているすべてのシンボルを同時に監視できます。インジケーターを 1 つのチャートに適用すると、市場全体を瞬時に監視できます。 M1 から MN までのすべてのタイムフレームを監視でき、クロスオーバーが特定されたときにリアルタイムのアラートを送信します。すべての Metatrader ネイティブ アラート タイプがサポートされています。 インジケーターには対話型パネルが含まれています。説明については、別のスクリーンショットを参照してく

このツールは、ポジションにストップを配置します
Metatrade Strategy Tester ですばやくテストします。 ロング ポジションの場合、ストップは最後の底になります。 または、ショート ポジションの場合、ストップは最後のトップになります。
さらに、このツールはオープン ポジションのトレーリングを管理します。 常に最後に形成された高値または最後に形成された底にストップを置きます
上値と下値を作成するには、このリンクからダウンロードできる無料のインジケーター「サポートとレジスタンス ライン」を使用します: メタトレード 5 の無料の上下インジケーターをダウンロード
このツールは、挿入された資産のすべてのオープン ポジションのストップを移動します。

AITradeMaster is an advanced Expert Advisor (EA) system developed on the MQL5 platform, utilizing the latest advancements in neural networks and deep learning. Designed for maximum automation and ease of use, AITradeMaster requires no additional settings from the user, allowing even novice traders to benefit from its functionality.
Key Features: Automatic Settings : All trading parameters are automatically generated by the implemented neural network. The user does not need to worry about con

通貨強度メーターは、現在どの通貨が強いか、どの通貨が弱いかをすばやく視覚的にガイドします。 メーターは、すべての外国為替クロスペアの強度を測定し、それらに計算を適用して、個々の通貨の全体的な強度を決定します。 28ペアのトレンドに基づいて通貨の強さに基づいて計算します。
MQL5ブログにアクセスすると、インジケーターの無料バージョンをダウンロードできます。 Metatrader Testerの制限なしで、購入する前に試してみてください: ここをクリック
1.ドキュメント すべてのトレンド通貨強度のドキュメント(手順)と戦略の詳細は、MQL5ブログのこの投稿で入手できます: ここをクリックしてください。
2.お問い合わせ ご不明な点がある場合やサポートが必要な場合は、プライベートメッセージでご連絡ください。
3.作成者 SAYADI ACHREF、フィンテックソフトウェアエンジニア、Finansyaの創設者。
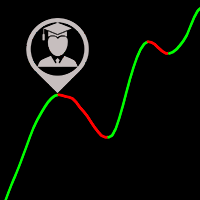
作成、探索、獲得! Expert Advisor を使用すると、ツールの価格を平滑化する強力で普遍的な指標に基づいて、完全に自動化された取引システムを構築できます。 EA に統合された一連のルールを使用して、独自の取引システムを作成します。戦略テスターでアイデアをテストします。利益のための実際の取引で、または追加のツールとして使用してください。 2021 年 10 月 19 日、MetaTrader 5 用の完全に無料の UniversalMA インジケーターを公開しました。UniversalMA は、膨大なカスタマイズ オプションを備えた移動平均です。 10種類のスムージング。構築する12の価格オプション。結果の移動平均の離散化の可能性。高速で最適化されたコード。インジケーターは非常に便利であることが判明し、ユーザーは気に入りました。 このインディケータを使用すると、それに基づいて任意の Expert Advisor を制限なしで作成できます。それにもかかわらず、このインディケータに基づいて完全に自動化された Expert Advisor を作成するための膨大な数のリクエストと提案を

Ez Channel インジケーターは、チャート内の実際のトレンドチャネルを自動的に識別するため、トレンドフォロートレーダーにとって不可欠なツールです。このインジケーターを使用すると、チャート上にトレンド ラインを手動で描くために何時間も費やす必要がなくなります。任意のシンボルと時間枠のトレンド チャネルをすばやく描画することで、時間と労力を節約します。 Ez Channel の主な機能の 1 つは、好みに応じて期間を簡単に調整できるミニ コントロール パネルです。このコントロール パネルでは、新しい市場の動きによる変化が発生する前に、識別されたチャネルを保存することもできます。この機能により、傾向線を再描画する手間をかけずに、市場の傾向を簡単に追跡および分析できます。 Ez Channel はすべてのシンボルとタイムフレームに適しているため、多用途でさまざまな取引戦略に適用できます。これにより、識別されたチャネルを将来の使用に備えて保存することができ、これらの保存されたチャネルを任意の時間枠で表示することができます。この機能により、さまざまな時間枠にわたる傾向を比較および分析できるよ

RSI クロスオーバー アラートは、 取引戦略で 相対強度指数 (RSI) を利用するトレーダー向けに特別に設計された強力な通知システムです。このインジケーターは、高速 RSI ラインが低速 RSI ラインの上または下を横切るときに発生する RSI クロスオーバーを特定することに重点を置いています。これらのクロスオーバーを組み合わせることで、インジケーターは効果的に誤ったシグナルを除去し、トレーダーがより正確な取引決定を行えるようにします。 RSI Crossover Alert は、機能性と使いやすさを向上させるいくつかの重要な機能を提供します。これは、あらゆる時間枠および取引シンボルに適用するのに適しており、トレーダーに取引アプローチにおける柔軟性を提供します。この指標にはユーザーフレンドリーなパラメータも備わっており、トレーダーは自分の好みや取引戦略に応じて設定を簡単にカスタマイズできます。さらに、このインジケーターはチャート上に以前のシグナルを描画できるため、トレーダーは過去のクロスオーバー パターンを分析できます。 トレーダーが重要な取引機会を決して逃さないようにするために

Технический индикатор "Reversal patterns" является математической интерпретацией классических разворотных паттернов: Pin Bar, Harami и Engulfing. То есть «Разворотного бара», «Харами» и «Поглощения». Данный индикатор позволяет определить момент разворота котировок на основе рыночной динамики и победителя между «быками» и «медведями». Индикатор отображает момент разворота на локальных максимумах и минимумах графика любого таймфрейма, что позволяет повысить точность сигнала. Также индикатор имеет
MetaTraderプラットフォームのためのアプリのストアであるMetaTraderアプリストアで自動売買ロボットを購入する方法をご覧ください。
MQL5.community支払いシステムでは、PayPalや銀行カードおよび人気の支払いシステムを通してトランザクションをすることができます。ご満足いただけるように購入前に自動売買ロボットをテストすることを強くお勧めします。
取引の機会を逃しています。
- 無料取引アプリ
- 8千を超えるシグナルをコピー
- 金融ニュースで金融マーケットを探索
新規登録
ログイン