Robots comerciales e indicadores para MetaTrader 5 - 53

Orders SL and TP Values Show is an indicator that shows the values of Profit and Loss over the lines in the main chart. In addition, the distance in points will be shown. In the current version, the code has been remodeled and improved, now offering new options and features such as: Option to include swape values to more precise calculation of your order StopLoss and Takeprofit values. (Activated by default) Option to include the ticket number on the left of price value. This is useful to identi

Introducing our groundbreaking indicator designed to elevate your trading strategy! Unlock the power of precise volume analysis with Buy, Sell, and Neutral indicators. Tailor your approach with customizable levels based on timeframes and moving average methods.
Key Features: Dynamic Volume Insights Instantly identify Buy, Sell, and Neutral volumes for informed trading decisions. Gain clarity on market sentiment like never before. Adaptable Level Configuration Customize and adapt levels to matc
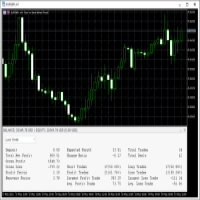
This Trading Statistics Indicator gives you an overview of your trade statistics for a selected period. You can set different periodsand filter for Symbols and magics to analyse your trading success. You can also create charts for Balance/Equity, MFE and MAE Periods: Total Time Today Yesterday This Week Last Week This Month Last Month This Year Last Year This Trading Statistics Indicator is still work in progress. In the next versions I will add telegram and email notifications and some more

Stargogs Pay EA Is an Trend, scalping and Hedging EA to protect accounts from blowing and gain profits. It uses Hedging Its Based On EMA's For Scalping, Daytrading and swing. Can trade on small accounts Small to no Risk on Bigger accounts. Low Drawdown. Special Entries. EA works on all currencies, metals, indices, stocks, volatility indices, Boom & Crash indices, Jump indices. Minimum Deposit $10 Parameters Lotsize Lot Multiplier (Can be changed based on account balance) 0.0 To Turn Multiplie

Auto SLTP Maker MT5 is an assistant for all those who forget to set StopLoss and/or TakeProfit in deal parameters, or trade on a very fast market and fail to place them in time. This tool automatically tracks trades without StopLoss and/or TakeProfit and checks what level should be set in accordance with the settings. The tool works both with market and pending orders. The type of orders to work with can be set in the parameters. It can track either trades for the instrument it runs on, or all

Cointegration Pair Trading Indicator
Indicator for statistical and quantitative pair trading strategies. You can perform Long&Short or Long&Long/Short&Short between two different assets.
The indicator performs a series of statistical tests between the assets and shows whether the pair is cointegrated or not.
Suggested Usage Strategies
(a) Verify if that the pair is cointegrated by the ADF test (Augmented Dickey-Fuller Test). 0% means the pair is not cointegrated; 90% 95% 97.5% and 99% means

¡Deje una calificación de 5 estrellas si le gusta esta herramienta gratuita! Muchas gracias :) La colección de asesores expertos "Asistente de gestión de riesgos" es un conjunto completo de herramientas diseñadas para mejorar las estrategias comerciales mediante la gestión eficaz del riesgo en diversas condiciones del mercado. Esta colección consta de tres componentes clave: asesores expertos en promedios, cambios y cobertura, cada uno de los cuales ofrece distintas ventajas adaptadas a diferen
FREE
Botti Tools features
1 - Automatically places Take Profit and Stop Loss values, previously defined, in Pending Orders and in Market Positions
2 - Based on the amount of Stop Loss points defined and the specified monetary value it calculates what volume should be used for that order.
3 - After X points he puts the order on breakeven
4 - It cancels the Take Profit at X points away from it and places the Stop Loss in such a way as to guarantee Y gain points
5 - If the fourth option
FREE

The Market Thermometer can be used to help traders identify sleepy or turbulent periods. It helps beginners to check when is the ideal time to enter operations, that is, when the value of the thermometer is below its average for several periods, identifying a peaceful market. When the market is heated, that is, the thermometer is above three times its average, it is time to make profits. The Thermometer measures the extent to which the end of a period, maximum or minimum price, projects out
FREE

This EA allows you to secure a position by closing a percentage of the position and changing the stop loss once the price reaches the trigger. Please leave a comment. Thank you !!! Settings : percentage : the lots percentage to close at breakeven buffer : the distance between the entry price and the new sl trigger : distance in points to activate the breakeven Lots : the volume you use to open the position. (Very important: it must be the same lot as the position)
FREE
TrendFollowMT is a fully automated trading system which is using large time frame to determine the trend and use small time frame to find the entry point. Once the trend changed to opposite side, the system will wait for another entry point to recover with bigger lot size. Moreover, the target profit will be moved up when more position had been opened. The aim is to cover the cost of waiting time and risk.
Free version will only trade on buy signal and locked the initial Lot size (0.01). Paid
FREE

COPIADORA COMERCIAL - CONTRASEÑA DE INVERSOR - COPIAR COMERCIO - PLATAFORMA CRUZADA MT4 x MT5
Nota: Necesita tanto "Mirror Copier Master" en la cuenta maestra que seguirá a la cuenta del cliente como "Mirror Copier Client" en la cuenta del cliente que seguirá a la cuenta maestra.
Blogs: https://www.mql5.com/en/blogs/post/756897
CÓMO FUNCIONA :
https://www.youtube.com/watch?v=V7FNpuzrg5M
Versión MT4
Maestro: https://www.mql5.com/es/market/product/114774
Cliente: https://www.mql
FREE

The most sensitive indicator you've ever seen . . .
POscillator is a sensitive indicator to find each trend direction change in every timeframe. It shows price variations and reveals up or down trends. POscillator makes a price curve based on frequency filters. The procedure makes two price functions by using high-frequency and low-frequency filters separately. Then it adds them together to create a smoothed price curve. The final stage of the indicator converts this smoothed curve to an osci
FREE

Course Crystal es un indicador que ayuda a los operadores a determinar la dirección de la tendencia en el mercado. Utiliza un algoritmo único para analizar los movimientos de precios y muestra los resultados en un gráfico como áreas coloreadas. El azul indica una oportunidad de compra, mientras que el rojo indica una oportunidad de venta. Instrucciones de uso: https://www.mql5.com/es/blogs/post/757800 Sistema de comercio manual:
Determinación de tendencias: el indicador Course Crystal analiza
FREE

Что такое RSI? Индикатор RSI (Relative Strength Index, индекс относительной силы) — это индикатор, который измеряет соотношение восходящих и нисходящих движений. Расчет ведётся таким образом, что индекс выражается в диапазоне от 0 до 100. Как понять RSI?
Если значение RSI находится равно 70 и больше, считается, что инструмент находится в состоянии перекупленности (ситуация, когда цены выросли выше, нежели того ожидал рынок). Значение RSI на уровне 30 и ниже считается сигналом о том, что инст
FREE

The Official "GRID EA" Using PipFinite Trend PRO A Smart Trend Following EA Using Trend PRO Indicator Signals In a Unique Grid Strategy. Trend Grid EA takes the signal of Trend PRO Indicator on the first trade then builds succeeding trades if the move goes against it. The innovative grid algorithm manages each position to ensure every basket is closed in a net positive profit.
Settings Used & Input Descriptions
Information Here https://www.mql5.com/en/blogs/post/743648
Features Built

This is a customizable three moving averages indicator useful in crossover trading technique. Yo can set various parameters such as calculation methods (exponential, simple, etc.), period and price type for each MA separately from one input dialog.
Parameters: Period <1,2,3> - Period of a moving average Shift <1,2,3> - Shift of a moving average Method <1,2,3> - Method of calculation for each moving average set separately Applied Price <1,2,3> - Set price type for calculations for each movi
FREE

The EU_H1_110155136_S_Bi_CF_SQ3 is an algorithmic trading strategy for MetaTrader, tested on EURUSD using the H1 timeframe from April 1, 2004, to April 24, 2024. There is no need to set up parameters, all settings are already optimized and fine-tuned.
Recommended broker RoboForex because of EET timezone.
You can find the strategy source code for StrategyQuant at the link: http://quantmonitor.net/listing/eurusd-biggest-range-pulse/
Key details are:
Main Chart: Current symbol and time
FREE

you can close all your positions in profit or lost when you use this robot. 1.you set your max profit and max lost for all your positions. 2.the robot show you in a window beside your chart. 3.when your equity reach your target close all your positions. 4.you can use one of them or both (profit or lost)togather. 5.this robot close all your positions. ((if you have any idea or want somthing i can help you)) i hope you win in all your times of life. best regard
FREE

Brain it is a Secure Automated Software for trade Forex market and indices.
The architecture is a Fully Automatic Autonomous Robot Expert capable of
independently analyzing the market and making trading decisions Brain i t is an advanced trading system. This is a fully automatic Expert Advisor.
Brain is a plug and play system Brain It is a 100% automatic system, The system is self-sufficient, performing all the work. You can download the demo and test it yourself.

The indicator makes calculations based on data obtained from one of seven (7) moving averages and colors the chart.
Simple moving averages are those that have only one important calculation parameter - the period.
The shift in the indicator is not used.
There is a shift trick setting, it is used to smooth the result of calculations. You can see the changes if you reduce this parameter to 1 (minimum value).
shift trick must always be less than the period value.
Available averages:
MA
FREE

Este indicador tiene como objetivo principal mostrar el diferencial actual del activo en el que se colocó el indicador. Dependiendo de las fotos, visualmente y dentro del propio gráfico, es posible visualizar el valor de propagación en el momento actual, es posible cambiar la posición vertical del texto y la posición horizontal, además del tamaño de fuente y color del texto.
FREE

Level Assistant es un asistente experto para configurar manualmente los niveles de soporte y resistencia.
Los comerciantes a menudo forman sus propios niveles. Si hay muchos gráficos de diferentes períodos, el nivel se multiplicará por todos los gráficos.
Al colocar una línea horizontal en un gráfico, el Asistente sugiere convertir esta línea en un nivel. Al mismo tiempo, él mismo determinará el color y el grosor de la línea, según el período del instrumento y dónde se encuentra en relación
FREE

Swiss CandleTime What ist CandleTime for This indicaor just displays the remaining time for a candle to build. It is best used if you trade with timframes from 3 minutes. I use it in M3 to keep postions. If I have two following red candles i usually liquidate the position. Timeframes M1 to H1 Inputs Arrow displayed => Edit your arrow string Arrow for waiting conditions => Arrow if chart is offline Text Color => color of the text Tell if there is a trend change => tells you, if the two preciding
FREE

Description by chatGPT:
In the dance of flames, a candle transforms,
From the close of old, a new light is born.
A derivative of candles, changing forms,
Unveiling secrets in the flickering morn.
Like indicators, patterns do precede,
On charts of price, where future paths are sown.
The candle's dance, a signal to take heed,
Foretelling tales in fiery lines shown.
I trust the candlemakers to discern,
Using indicators as their guiding light.
In every flame, a lesson to be learned,
FREE

This is an OLD indicator which was rather efficient to be paired with MA Cross, Bollinger Bands, Dochian Channel and many other strategies and this provides you with market change of BEAR and BULL trends. Since there isn't much listed in MT5 Market, I would like to share my very own indicator for your usage. Please feel free to comment or criticize for better and improvement of the indicator listed.
FREE

RSI Currencies is an indicator that is based on the RSI concept but with a totally different approach. It calculates its values calculating all RSI values of all pairs related to the same currency and making an average between them: the goal is to obtain a more solid and trustable information about what each currency are doing lowering the impact of market noise and extreme euphory on a particular pair to analyze the whole basket. It works on 28 forex majors and minor pairs related to these curr
FREE

This Price indicator aid you to read prices of a bar without using native MT5 instuments like crosshair.
The indicator gives you the OPEN HIGH LOW CLOSE and 50% bar prices of the current or one of the previous bar.
Parameter setting are: TimeShift: Used for bar selection (0 stand for current 1 for previous 2 for 2 bars ago) Other parameter are using for esthetics. Each Label can be moved away from its initial position.
FEEL FREE TO REPORT BUG AND REVIEW THIS INDICATOR. THANKS
FREE

CAP Wabot Scalper EA is a fully automated Expert Advisor for Forex trading that uses advance price movement. Indicators are not used in operation. The EA uses Take Profit and Stop Loss. Averaging and Martingale are not used. This EA is basically designed to trade EURUSD, GBPUSD and USDJPY which implements a complete and fully-functional trading strategy. But EA can be working any of pair. This EA will need a good broker with small spread to work successfully. CAP Wabot Scalper EA is backtest

Harness the Power of Donchian Channels for Trend Trading
The Donchian Channel Indicator may your key to precision trading. With Donchian channels, you'll gain insights into market volatility, breakouts, and overbought/oversold conditions. This winning strategy is named after its developer, Richard Donchian.
How Does the Donchian Strategy Work? The upper band represents the previous period's highest high; The lower band represents the previous period's lowest Low; The centre band refle
FREE

Indicador Multiple Regression Indicador faz o plot da Curva de Retorno e dos canais superior e inferior de uma regressão para os preços de fechamento do ativo do gráfico. A Curva de Retorno é a linha central do indicador e representa a região de equilíbrio do preço entre vendedores e compradores. Nesse indicador o usuário escolhe o tipo da regressão podendo ser de 3 tipos: primeiro grau, segundo grau ou terceiro grau. Os plots do indicador são: Linha central – cor padrão preta; Linha superi
FREE
Equity monitor
This is a simple means change informer. I wrote it for myself, maybe someone will need it...
1. Displays the change in funds for the day. Every day, when the terminal is first launched, it remembers the current funds and monitors changes throughout the day.
2. The first day of the month, well remembers the money and, within months, to monitor changes.
3. Well, it displays the profit of the open position.
To work, you need to create 4 global variables: gvarEqityDay ,
FREE

Here’s the problem: the default zigzag indicator given in MT5 trading platform does not really capture the most of the highs and lows on chart do draw zigzags. On chart below, notice that some of ther high, low of price have been missed to draw zigzags by this default zigzag indicator (picture 1). It is not so apparent until you compare default zigzag indicator to this SwingZZ indicator. Have a look on picture 2 and 3. The swing zigzag indicator is best because it captures most of the swing high

The Bheurekso Pattern Indicator for MT5 helps traders automatically identify candlestick pattern that formed on the chart base on some japanese candle pattern and other indicator to improve accurate. This indicator scans all candles, recognizes and then displays any candle patterns formed on the chart. The candle displayed can be Bullish or Bearish Engulfing, Bullish or Bearish Harami, and so on. There are some free version now but almost that is repaint and lack off alert function. With this ve

This reliable, professional trade copier system is without a doubt one of the best on the market, it is able to copy trades at very fast speeds from one master account (sender) to one or multiple slave accounts (receivers). The system works very fast and mimics the master account a full 100%. So changing stop losses, take profits, pending orders on the master account is executed on the slave accounts too, like each other action. It is a 100% full copy (unlike many other copiers who only copy ma

ATR is a measure of volatility introduced by market technician J. Welles Wilder Jr. in his book, "New Concepts in Technical Trading Systems". In general, traders are accustomed to seeing the ATR in the form of a sub-window indicator. What I am presenting here is a simplified version of ATR - just the current ATR number - very useful for monitoring just the very moment of the current chart. If you want to monitor several timeframes in the same chart, just add the ATR Monitor indicator several tim
FREE

Do you believe that financial markets and celestial bodies operate in separate realms? Our indicator begs to differ! Based on the innovative theory of William Gann, which emphasizes the influence of celestial planet movements on financial market dynamics, we present to you the "Gann Planetary Lines Indicator". Features of the Indicator : Precision : Accurate projection of the 360 degrees of planetary orbits onto price charts. Advanced Customization : Ability to display or hide any planet line,

Gann 9+ Indicator Introduction The "Gann Matrix Chart" is the most simple and clear technical analysis in Gann theory, which is the calculation tool that Gann has always been committed to using. It is the essence of Gann's whole life. The Gann 9+ indicator uses the matrix chart to find the future high or low points of stocks or futures. Indicator Input: The base and step size can be set as 1 by default; When the multiple is -1, the multiple will be automatically obtained, or it can be filled in

NOW FREE!! It's crucial to note that, like any trading tool, ForexClimber EA doesn't guarantee profits. Forex trading carries risks, and market volatility means success is never certain. The pricing of ForexClimber EA is dynamic, and as it gains popularity, the cost for renting or buying may increase. Invest now to secure your place in Forex trading advancement. Seize the opportunity, navigate the markets, and let ForexClimber EA support your Forex trading aspirations.
FREE

Expert Advisor Description EA TugOfWar will open both buy and sell positions at different times according to the triggered signal, the most positions and in accordance with the market direction that will win and profit. Profit target per war is 1% to 5%. Warmode normal = Longterm strategy Warmode extreme = Shortterm strategy
Parameter Description StartTrade = Time to start trading / open position EndTrade = Time to end trading / open position WarMode = 1 -> Normal, 2 -> Extreme (lots of t
FREE
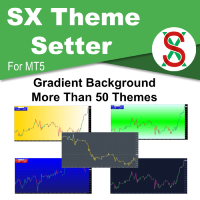
SX Theme Setter is intended for changing chart appearance in 2 modes: - Gradient background mode:
In this mode, the indicator creates a gradient background for your chart. Colors, steps and gradient type can be selected by user. - Color theme:
Color theme mode provides more than 50 built-in different color themes which can be selected from a list. Most of these themes are converted from official color themes of real trading platforms of the past and present. Try them out and see if they sui
FREE
如果产品有任何问题或者您需要在此产品上添加功能,请联系我 Contact/message me if you encounter any issue using the product or need extra feature to add on the base version.
Session TakeProfit StopLoss is basically helping to set the take profit and stop loss in dollar for the total open orders (session). Once the total profit is greater than session_tp or less than session_sl, the EA will help to close all open orders acting similarly to a take profit/stop loss for a single order.
Inputs session_tp: session take profit s
FREE
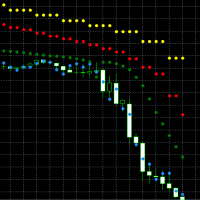
This indicator is based on the classical indicator Parabolic SAR. You can observe up to 4 different timeframes. All MT5 TimeFrames are supported. It's possible to use lower or higher timeframes than the current chart timeframe. Input Parameters: For each of the 4 Timeframes you can configure: The specific Period ( ENUM_TIMEFRAMES ) The usage of the PSAR Value ("visible and relevant for the signal", "visible and not relevant for the signal" or "invisible and not relevant for the signal (ign

Attention!!! Do not try to test the EA in the MT4 Tester, it is simply impossible, because the EA opens positions on 27 different instruments and 8 timeframe . The tester is able to test only one pair. Multi-currency tester is possible only in MT5. Instructions for launching a multi-currency tester in MT5: https://youtu.be/WrQQwMQclrY How EA works: 1. The main strategy for the breakdown of local extremes is used. 2. An additional algorithm is used to control losing trades and redistribute loss

HM (Horizontal Markup) está diseñado para marcar manualmente los niveles horizontales. El marcado contiene el nivel y su valor de precio. El grosor y el color de la línea y el valor de precio se establecen en la configuración. Los niveles se pueden colocar localmente en Marcos de tiempo o se pueden exponer públicamente para todos los Marcos de tiempo.
Su funcionamiento es muy sencillo:
1) - pulse la tecla que se establece en la configuración para marcar el nivel;
2) - llevar la líne
FREE

The indicator highlights in color the places on the chart where the price moves in one direction continuously from the selected number of candles.
You can specify the number of points from the beginning of the movement to select only movements from this amount.
It can be useful for looking for reversals or sharp impulses.
I also recommend purchasing this utility to determine local weekly / monthly trends and support and resistance lines. https://www.mql5.com/en/market/product/61401
FREE

Технический индикатор Trend Moving Average позволяет определить глобальное направление рынка. Данный технический индикатор создан для того, чтобы определить «линию наименьшего сопротивления» рынка и понять в какую сторону направлен тренд. Помимо классического использования МА, индикатор позволяет понять направленность рынка на основе динамики его значений. Так, если значение индикатора демонстрируют переход с нисходящего значения в восходящее (и наоборот) - это является дополнительным торговым с
FREE

Create and trade timeframes in seconds. The bar time duration is freely adjustable from 1 second and up. The chart is accurately constructed using real ticks from the broker's server. Main characteristics The indicator is an overlay on the main chart, making it possible to utilize one-click trading and on-chart order manipulation. History calculated using real tick data. Built-in technical studies: 4 moving averages (Simple, Exponential, Smooth, Linear-weighted, Volume-weighted using tick or rea

The RFOC Mini Chart was created to project a macro view of the market, which the option to select the timeframe of interest other than the main chart, it is possible to include 2 indicators: 1 - Moving average channel On the mini chart, the moving average will be created based on the prices of the selected time frame for the RFOC Mini Chart. The moving average period must be selected in the indicator settings pannel.
2 - Boillinger Band In the mini chart, a boillinger band will be created base
FREE

Blended Candle Strength (BCS)
Any trading strategy, whether it is a continuation, trend reversal or breakout requires, in addition to analyzing the context of the price movement, confirmation signals for both trading entry and exit. And for that, it is necessary to analyze the formats of the candlesticks and fit them in known patterns to assist decision making. In addition to the context and format, two other important information to determine the strength of candlesticks are the size of the ba
FREE

This Expert advisor trades any Asset class, Try it on any market, When you download PM so you can be added to my channel for all support related issues. There are three trading strategies available * The Wyckoff trading strategy, Channel trading and trend trading. Input Parameters Lots - the volume of position to open; Stop Loss BUY (in points) - the stop loss of BUY positions; Stop Loss SELL (in points) - the stop loss of SELL positions; Take Profit BUY (in points) - the take profit o
FREE

The Moving Average Slope (MAS) subtracts the moving average level n-periods ago from the current moving average level. This way, the trend of the moving average can be drawn on the moving average line.
Features Observe uptrends and downtrends at a glance. The indicator is non-repainting. Returns buffer values for the trend of the moving average to be used as part of an EA. (see below)
Inputs Moving Average Period : The period of the moving average (MA). Slope Period : Number of periods betwe
FREE
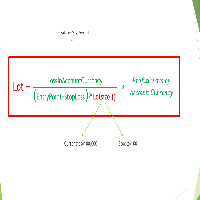
Important Note: Before using it in a real account test it in your demo account.
//+------------------------------------------------------------------+ //| Optimum_Lot_Size.mq5 | //| Copyright 2023, MetaQuotes Ltd. | //| https://www.mql5.com | //+------------------------------------------------------------------+ #property copyright "Copyright 2023, MetaQuotes Ltd." #propert
FREE

如果产品有任何问题或者您需要在此产品上添加功能,请联系我 Contact/message me if you encounter any issue using the product or need extra feature to add on the base version.
Floating Highest Lowest MT5 provides you an intuitive and user-friendly method to monitor the floating highest (profit) and lowest (loss) that all your trades together ever arrive. For example, I opened 3 orders, which arrived at $4.71 floating profit when trade following trend. Later when the trend is against me, these 3 orders arrive $30 in loss, and
FREE

Product Description: Adaptive Y-Axis Scaling is a powerful MT5 indicator designed to enhance your trading experience by providing precise control over the Y-axis (price) scaling of your charts. This innovative tool allows you to customize the price scaling by specifying the number of pips from the visible chart's highs and lows. The calculated price range from this input is then used to set the maximum and minimum prices for the open chart, ensuring an optimized and comprehensive view of market
FREE
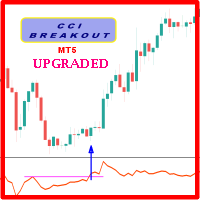
Probability emerges to record higher prices when CCi oscillator breaks out oscillator historical resistance level when exhibit overbought values. Since, oscillator breakout of support and resistance have similar effect as price breaks support and resistance levels, therefore, its highly advised to confirm price breakout with oscillator breakout; certainly, will have the same output in short trades. Concept is based on find swing levels which based on number of bars by each side of peak or troug
FREE

** All Symbols x All Timeframes scan just by pressing scanner button ** *** Contact me after the purchase to send you instructions and add you in "Channel Scanner group" for sharing or seeing experiences with other users. Introduction: The Channel pattern is described as the area located between two trend lines. This area is used for a measure of a trading range. In this case, the upper trend line connects price highs while the lower trend line connects price lows. Also when it comes to

Indicador MAPS Indicador é um oscilador que faz o plot da Curva de Retorno de uma regressão de segundo grau para os preços de fechamento do ativo do gráfico. A Curva de Retorno é a linha central do indicador MAPS e representa a região de equilíbrio do preço entre vendedores e compradores. Os plots do indicador são: Linha central - C0 - cor da mesma varia de acordo com a tendência do mercado, sendo verde para tendência de alta e vermelho para baixa; Linhas superiores: S1, S2, S3 e S4, sendo que a
FREE

This is an alert based on a moving average convergence / divergence (MACD) and additional moving average indicator (for trend confirmation) similar to my other product where you find detailed description of how it works. You get a colored table where colors are related to trading conditions (see below) with possibility to customize all indicator parameters, including Heikin Ashi calculations. Meaning of cell COLORS (can be redefined by user): GREEN - buy signal, PINK - sell signal, YELLOW - pay
FREE

The Emerald is a Comprehensive utility integrated with a number of tools including the Currency Strength Meter, Trade/directional signal, signal strength, Current bar countdown timer, Forex market sessions time converter and many more.
Can be used in all time frames and all markets The currency strength meter helps you identify which currencies are strong and which currencies are weak. All the 10 major currencies are monitored in real-time. The Emerald can used to predict currency movements wh
FREE

This is diamond!
Diamond Pattern is based on Read The Market(RTM) concepts. The purpose of this model is to face the big players of the market (financial institutions and banks), As you know in financial markets, big traders try to fool small traders, but RTM prevent traders from getting trapped. This style is formed in terms of price candles and presented according to market supply and demand areas and no price oscillator is used in it. RTM concepts are very suitable for all kinds of inves
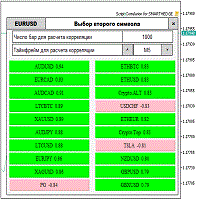
Script for quickly selecting a tool with high correlation. The script is placed on the tool to which you need to select the second correlating one. Then you can change the number of bars to calculate and the timeframe. The script iterates through all available symbols in the market overview and returns the 20 most correlated ones. You can use the selected pairs to trade with THE new SH expert Advisor
FREE

The 4xtradingllc Panel allows you to enter sells and buys in a quick manner as well as close all trades at once. The panel also has a account protector that will close all trades once the protector has been hit.
You can attached this utility to most indicators and combine the two to have your indicator fully functioning as well as the panel to buy sell and close trades quickly and protect the account from losing X percentage.
MAKE SURE TO JOIN OUR DISCORD SERVER FOR FULL TRAININGS. DISCORD
FREE

MT5 RSI Experiment: This indicator leverages the Relative Strength Index (RSI) and floating levels to pinpoint potential buy and sell signals.
The code uses enums for prices and RSI calculation methods. These enums define indicator parameters.
Input variables include RSI period, price type for RSI calculation, smoothing method, and look-back period with levels for floating levels.
Index buffers store RSI fill, RSI up line, RSI middle line, RSI down line, and trend line data.
For each ba
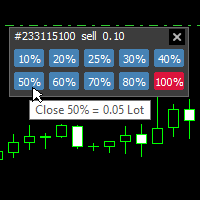
With this tool, you can easily and quickly close part of the trade. Click near the trade to display the closing panel. There are ten preset values for partial closing, but you can set your own values. You can also resize the panel according to Windows settings (125%, 150% ...) See the animation below for how it works. **********************************************************
Note: This tool does not work in the tester.

This indicator is designed based on the Moving Origin indicator
When the moving origin indicator breaks the price, this indicator gives a signal
It is useful for better viewing of signals and analysis on them
Attributes: Can be used in all symbols Can be used in all time frames Too many signals Simple and quick settings Easy way to work
Settings: period: like moving average settings alarmShow: If you want to receive an alert in Metatrader after receiving the signal, enable this setting
a
FREE

The DD_ATR MT5 indicator is a trading tool developed by the Dagangduit Core Team . This indicator is designed to calculate and display the Average True Range (ATR) in real-time, providing traders with essential volatility information to aid in their trading decisions. Key Features: ATR Calculation : Calculates and displays the ATR for the selected timeframe. Multiple Timeframes : Displays ATR values for multiple timeframes (M1, M2, M3), giving traders a comprehensive view of market volatility.
FREE

A Fibonacci Panel tool to facilitate your trading with Fibonacci indicator. Simple and easy to use! Magnificent Design (Adjustable) Sound Effects (This will make trading much more fun) Five Fibonacci Levels (freehand movable) Acoustic and graphic signals (adjustable for each level) Integrated narrow trading panel also with risk and money management If you need silence while trading, you can deactivate the sounds in the settings.
Parameter
Language English Magic number Commentary (for all po
FREE

The indicator calculates the inclination angle between the Highs, Lows and Closes of adjacent bars. The angle can be measured in degrees or radians. A linear graph or a histogram is drawn in a subwindow. You can set the scale for the calculation — floating or fixed. For use in Expert Advisors or indicators, you need to specify a fixed scale.
Parameters Angular measure — degrees or radians. Scale mode for calculation — scaling mode. Free scale — free transformation, the indicator will calculate
FREE

Free version. Only works on EURUSD Do you want to always know in a quick glance where price is going? Are you tired of looking back and forth between different timeframes to understand that? This indicator might just be what you were looking for. Trend Signal Multitimeframe shows you if the current price is higher or lower than N. candles ago, on the various timeframes. It also displays how many pips higher or lower current price is compared to N. candles ago. Number N. is customizable The data
FREE
MetaTrader Market ofrece a todos los desarrollador de programas de trading una sencilla y cómoda plataforma para ponerlos a la venta.
Le ayudaremos con la presentación y explicaremos cómo preparar la descripción de su producto para el Market. Todos los programas que se venden a través del Market están protegidos por una codificación adicional y pueden ser iniciados sólo en el ordenador del comprador. La copia ilegal es imposible.
Está perdiendo oportunidades comerciales:
- Aplicaciones de trading gratuitas
- 8 000+ señales para copiar
- Noticias económicas para analizar los mercados financieros
Registro
Entrada
Si no tiene cuenta de usuario, regístrese
Para iniciar sesión y usar el sitio web MQL5.com es necesario permitir el uso de Сookies.
Por favor, active este ajuste en su navegador, de lo contrario, no podrá iniciar sesión.