YouTubeにあるマーケットチュートリアルビデオをご覧ください
ロボットや指標を購入する
仮想ホスティングで
EAを実行
EAを実行
ロボットや指標を購入前にテストする
マーケットで収入を得る
販売のためにプロダクトをプレゼンテーションする方法
MetaTrader 5のための新しいエキスパートアドバイザーとインディケータ - 160

Aggression Volume Indicator is the kind of indicator that is rarely found in the MQL5 community because it is not based on the standard Volume data provided by the Metatrader 5 platform. It requires the scrutiny of all traffic Ticks requested on the platform... That said, Aggression Volume indicator requests all Tick Data from your Broker and processes it to build a very special version of a Volume Indicator, where Buyers and Sellers aggressions are plotted in a form of Histogram. Additionally,
FREE

Active Symbol is a tool that works together with our Trade Panel. Since version 1.2 our panel can manage multiple symbols without having to open it in all of them, just one. This tool make this possible, because with it the actual or remote symbol information are saved for our Trade Panel to use. Remember to enable the panel control mode in the all symbols function. If you have some problemas with the shortcut buttons on chart on unpinned mode of Trade Panel try change the tickets digits option.
FREE

The Expert Advisor uses a strategy based on breakthrough and two additional strategies based on sharp price changes. You can adjust the slope of the breakthrough, the distance between the breakthrough levels and the number of breakthrough levels. The Expert Advisor itself marks the levels that should be broken through. The EA includes two strategies based on sharp price changes: that is the EA opens pending Sell Stop and Buy Stop orders in case of a sudden price change in any direction and close

The Expert Advisor analyzes tick micro-signals and determines the direction to open a position. Micro-signals are identified by predetermined codes, which in the optimization are recorded in the settings of the bot. When a bot sees the corresponding micro-signal, it reacts to it by opening a position and its accompaniment! The bot has good predictability. You can check the work of the bot on the simulation of real history, how to configure the tester will be shown in the screenshot. Also, we sho

This is a fully automated smart adaptive algorithm. The SKYNET system calculates the history data and performs the analysis based on the probability percentage of where the upcoming breakout of the support and resistance level will take place, and places pending orders. The Expert Advisor adapts to any market conditions. It was backtested and optimized using real ticks with 99,9% quality. It has successfully completed stress testing. The EA contains the algorithm of statistics collection with
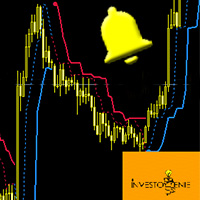
PRICE BREAKOUT ALERT!!!! PRICE BREAKOUT ALERT!!!
Now you dont have to worry about going through each currency pair, your favorite stocks watch list or crypto to find breakouts. This indicator does everything for you.
This indicator has the capability to SCAN different CURRENCY PAIRS and TIMEFRAMES to give you breakout information through ALERT (MOBILE NOTIFICATION, EMAIL AND PUSH NOTIFICATION)
NOTE: If you are willing to scan more currency pairs along with many timeframes, you

BE SAFE TURBO EA with indicator 24*7 Real deposit 3000$. Updated latest version DD is below 30% **Back Test in IC Markets, EURUSD, USDJPY, AUDUSD Time Frame M30** *USDCAD 1H * *AUDUSD H2*
**BE SAFE EA includes 9 Powerful Trend Indicators**
**99% Accuracy Super Strong BUY and SELL Signal entry**
**EA takes Super Strong BUY or SELL order, after 9 indicator confirmation in one bar**
Super Strong BUY and SELL entry EA takes super STRONG BUY and SELL entry, after 9 indicator c
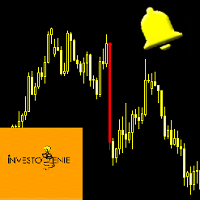
THRUST BAR ALERT!!!! THRUST BAR ALERT!!!
Now you dont have to worry about going through each currency pair, your favorite stocks watch list or crypto to find BIG CANDLES (also called THRUST BARS ). This indicator does everything for you.
This indicator has the capability to SCAN different CURRENCY PAIRS and TIMEFRAMES to give you BIG CANDLE (THRUST BAR) information through ALERT (MOBILE NOTIFICATION, EMAIL AND PUSH NOTIFICATION)
NOTE: If you are willing to scan more currency
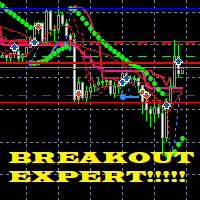
BREAKOUT TILL SUPPORT AND RESISTANCE!!!!
PLEASE CHECK COMMENTS SECTION FOR SET FILES (PLEASE DM me if you have any queries) As the name suggests itself, the EA focuses on BREAKOUT entries. As the theory behind a BREAKOUT is STRONG, the EA uses entries based on a Breakout or Breakdown along with these FEATURES
ENTRIES:
Entry is based on a breakout of a range or a trend change. The EA includes the parameters for BREAKOUTS. Smaller inputs means AGGRESSIVE traders and larger inputs means D
Индикатор CustomIndexCreator позволяет создавать свой собственный пользовательский символ на основе истории любого финансового инструмента и подкачивать его ценовую историю в виде минутных баров. Таким образом, в клиентском терминале Metatrader 5 появляется новый символ, с которым можно работать по аналогии с другими финансовыми инструментами, то есть открывать полноценные графики любого таймфрейма этого символа и проводить технический анализ, располагая на этих графиках любые технические и
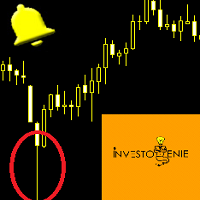
WICK BAR ALERT!!!! WICK BAR ALERT!!!
Now you dont have to worry about going through each currency pair, your favorite stocks watch list or crypto to find WICK BAR CANDLES (also called LONG TAIL BARS ). This indicator does everything for you.
This indicator has the capability to SCAN different CURRENCY PAIRS and TIMEFRAMES to give you LONG TAIL CANDLE (LONG WICK BAR) information through ALERT (MOBILE NOTIFICATION, EMAIL AND PUSH NOTIFICATION)
NOTE: If you are willing to
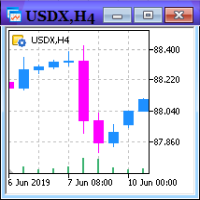
CustomMultyIndexCreator позволяет создавать свой собственный мультивалютный пользовательский символ на основе истории корзины любых финансовых инструментов как среднее геометрическое взвешенное этой валютной корзины и подкачивать его ценовую историю в виде минутных баров. Таким образом, в клиентском терминале Metatrader 5 появляется новый символ, с которым можно работать по аналогии с другими финансовыми инструментами, то есть открывать полноценные графики любого таймфрейма этого символа и про
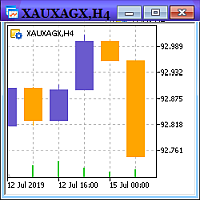
Индикатор CustomCrossIndexCreator позволяет создавать свой собственный пользовательский символ на основе истории двух любых финансовых инструментов как произведение этих двух индексов (кросс-индекс) и подкачивать его ценовую историю в виде минутных баров. Таким образом, в клиентском терминале Metatrader 5 появляется новый символ, с которым можно работать по аналогии с другими финансовыми инструментами, то есть открывать полноценные графики любого таймфрейма этого символа и проводить технически
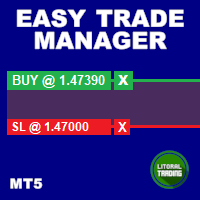
LT Easy Trade Manager is a tool in EA type that makes operation more intuitive. As in other programs, Meta Trader lacks graphical information, even though it is an excellent program. With that in mind we have created this tool. It makes it easy to view the entry point, Take Profit and Stop Loss, as well as the floating profit from operation. It also automatically corrects the SL and TP price (optional) and highlights the price and opening time of the operation (optional). Plus, you can close par
FREE
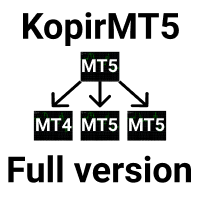
KopirMT5 (CopierMT5) - transaction copier for the MetaTrader 5 terminal, copies (synchronizes, duplicates) transactions from hedge accounts (copier, copy dealers).
Supports copying: MT5 <-> MT5, MT4 -> MT5 Hedge, MT5 Hedge -> MT4 Does not support copying MT5 Hedging < - > MT5 Netting, MT4 < - > MT5 Netting Free version for test
Why exactly our product? The copier has a high speed and is not dependent on ticks. Copy speed - less than 0.5 sec. Transactions are copied with high accuracy,
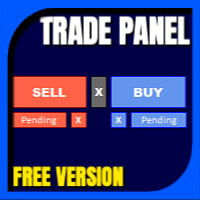
Have you missed any tools or shortcuts in Meta Trader? Simple things that would make your daily trading much easier ?
We have the solution for you: our Trade Panel!
This is an EA tool (Expert Advisor) that, if configured to controll all symbols, needs to be loaded only once.
This is the Lite version (free) of our tool. Professional version: https://www.mql5.com/en/market/product/42658 If you have some problemas with the shortcut buttons on chart on unpinned mode try change the tickets d
FREE

This indicator is a volume indicator it changes the color of the candles according to a certain number of ticks, and this number of ticks can be informed by the user both the number of ticks and the color of the candles, this indicator works in any graphical time or any asset, provided that the asset has a ticker number to be informed.
This indicator seeks to facilitate user viewing when analyzing candles with a certain number of ticks.
FREE

Are you tired of tester grail and price action experts who earn only in the strategy tester? You don't want to use strategies with grid, averaging and martingale? Tired of the endlessly hanging non-closed positions that can blow up your trading account at any time? Especially for you, the LATAlab team has developed a unique trading expert INTRADAY PROFIT MT5!
We present you the author’s intraday trading strategy. For a trading expert, formulas were developed for calculating volatility, trend

Automatic/semi-automatic trading robot, working on AB = CD pattern signals. It can work as an indicator. Supports sending signals in notifications, to a mobile device, as well as e-mail. The search for patterns is carried out by the universal Zigzag, Peak ZigZag, which was specially adapted to work in this EA. Through the use of the trace mode (when scanning patterns is performed on several Zig-zags with different Peak dist, see the description of the parameters), various AB = CD patterns from t

The EA uses a strategy based on the average price deviation using the following indicators: Bollinger Bands, Envelopes and Standard Deviation , as well as support and Resistance levels for the best signals. The first order is opened for price Deviation and subsequent orders are opened from the support and Resistance levels, and trading can be inside the Support and Resistance levels. The EA uses only the M5 timeframe and trades on most of the major pairs. Attention! This EA is only for "h
Moving averages are very often used for analyzing currency pairs and trading. This Expert Advisor can analyze many moving averages at once and trade based on this. When the required number of moving averages signal a purchase, the adviser makes a purchase, if the indicators signal a sale, the advisor sells. Also, there is filtering spurious signals at low volatility based on the ADX indicator. In the settings of the adviser, you can set the required number of sliding ones, their period (the init

This indicator shows price changes for the same days in the past. This is a predictor that finds bars for the same days in past N years, quarters, months, weeks, or days (N is 10 by default) and shows their relative price changes on the current chart. Number of displayed buffers and historical time series for comparison is limited to 10, but indicator can process more past periods if averaging mode is enabled (ShowAverage is true) - just specify required number in the LookBack parameter. Paramet
KT MACD Divergence Seeker trades the regular and hidden divergence signals generated by our free indicator named KT MACD Divergence indicator.
Trading the standalone divergences can be a risky affair that's why the KT MACD Divergence Seeker combines the standard divergence signals with an advanced analysis module to exploit the price inefficiencies on some FX pairs.
What is the Divergence exactly?
As a general conception if the price is making higher highs, then macd should also be making

Description: The indicator of tick volumes Better Volume MT5 allows you to assess the general mood of the market and quite accurately catch the moments of the formation of large movements. The indicator is a color histogram in an additional window. In the calculation of Better Volume MT5 the Price Action combinations are taken into account, the values of the volumes with the height of columns and color marking are displayed. Input parameters: MAPeriod - period for calculating the moving average
Copier MS MT5 Netting Copyist MS is a fast and easy-to-use copier of trade orders; it works as an advisor in the form of a single file with switching between the Master and Slave operating modes. The current version of the adviser works only on netting accounts. Settings Type of work - selection of the operating mode: Master or Slave; Master account number - number of the trading account of the master terminal; Selective copying currency pairs - individual selection of currency pairs for copyin
FREE

The utility is designed for manually placing the first order in trading with a user-defined magic number that corresponds to the magic number of the currently running EA. You can choose the direction for opening an order and open it using "The First Orders". After that, disable "The First Orders" and enable your trading expert, which picks up the newly placed order and considers it to be its own, managing it accordingly. Trading experience helps traders to better determine the trade direction th
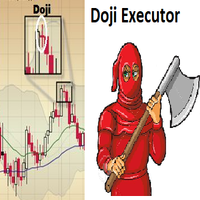
Doji Executor is an expert advisor who works by opening a trading position after detecting a doji candle, according to the doji formation.
Continuation formation bull - doji - bull = buy bear - doji - bear = sell
Reversal formation bear - doji - bull = buy bull - doji - bear = sell
with this ea, you don't need to monitor the chart all day long just to find a doji candle Pair = all pair Time Frame = all time frame suitable for use with brokers who give rebate programs please test first in

Dear friends
This is an indicator brings two moving averages configurable and will emit sound and alert, depending on your choice, when they cross.
Very useful for those who used to operate multiple times or active at the same time.
With the indicator set it will warn you where the crossing occurred.
If you desire some personal indicator please fell free to get in touch.
Good Trades Jairo Elias

Super Smart Grid is a complete package with multitude of strategies built-in, yet simple to use. Advantages of Super Smart Grid EA: Easy to setup Suitable for all levels of traders Any timeframe on any chart Built-in configurable Averaging function Grid distance coefficient Grid Lot coefficient News Filters Time Filters Recommendations: For controlled risk, use on M5, M15 or higher timeframe Test on demo accounts for at least 2-4 weeks before going live ECN broker is always recommended. A low la

Highly configurable Accumulation and Distribution (AD) indicator. Features: Highly customizable alert functions (at levels, crosses, direction changes via email, push, sound, popup) Multi timeframe ability Color customization (at levels, crosses, direction changes) Linear interpolation and histogram mode options Works on strategy tester in multi timeframe mode (at weekend without ticks also) Adjustable Levels Parameters:
Ad Timeframe: You can set the lower/higher timeframes for Ad. Ad Bar Shi
FREE

Bitcoin Trading Bot 101 is a fully automated trading system which trades based on market movement to identify trend with smart hedging strategy. The system is running on Binance spot market.
Parameters
API Key = your binance api key Secret Key = your binance secret key Symbol = symbol name TargetProfit (%) = target profit in percent TimeBased = period to check target
*You should allow WebRequest from Tools menu >> Options >> Expert Advisors and a

This Expert Advisor is an intraday system that exploits short and long hourly bias on EURUSD change. Money Management and position sizing is a self derived formula: the EA use 0.01 up to 0.05 lots every 1.000 Eur (or USD based on the currency account). The EA has been developed on GMT+3 timezone: use the input parameter 'timeOffset' to adjust your server timezone to the GMT+3. You can view live performance of my trade account on the comments page. There is also this free signal https://www.mql

Manual Trading Panel is a simple, efficient and intuitive graphic tool that provides a controls to open, close and manage all your orders in MetaTrader 5. It is very useful in case you have to interact with other EA adding another position or delete all positions in a specific direction or all of themes. This EA can not be tested on strategy tester. In case of usage please try its functions on demo account before running on live trading. Functions presented to this version: Interacts only with p
FREE

MetaTrader5の任意の取引シンボルのすべてのパラメーターの自動最適化のエキスパート。 設定なしでEAを取引! ダニ ハムスター -これは 、アドバイザーを設定したくない初心者やユーザー向けの自動取引エキスパートです! このトレーディングアドバイザーのトレーディング戦略は 7年間テストされています。 初心者のために特別に設計された自動売買エキスパートで、これまで以上に取引を簡単に。 アドバイザーを設定する煩わしさに別れを告げ、ストレスのない取引を実現しましょう。 今すぐ始めて、取引成功への第一歩を踏み出しましょう。 MT4のバージョン
完全な説明 +DEMO +PDF 購入する方法
インストールする方法
ログファイルの取得方法 テストと最適化の方法 Expforex のすべての製品 使い方?
ダウンロード; チャートにインストールします。 アドバイザーは自動的に取引します。 レビューを残します。 エキスパートを設定するにはどうすればよいですか?
何もカスタマイズする必要はありません!私たちはあなたのためにすべてをセットアップします! 1

強力な分析方法の1つは、Levyプロセスを使用した金融シリーズのモデリングです。これらのプロセスの主な利点は、最も単純なものから最も複雑なものまで、膨大な数の現象をモデル化するために使用できることです。市場におけるフラクタルな価格変動の考えは、レヴィ過程の特別な場合にすぎないと言えば十分でしょう。一方、パラメータを適切に選択すると、どのLevyプロセスも単純な移動平均として表すことができます。図1は、フラグメントを数倍に拡大したLevyプロセスの例を示しています。 価格チャートを滑らかにするためにLevyプロセスを使用する可能性を考えてみましょう。まず、線形プロセスをシミュレートするために使用できるように、Levyプロセスのパラメータを選択する必要があります。それから、異なる符号の係数を含む重みのシステムを得ます。このおかげで、私たちは財務範囲を平準化するだけでなく、そこに存在する反トレンドと定期的な要素を追跡することもできるでしょう。 インジケータの動作は、パラメータ LF を選択することによって設定されます。分析されるストーリーの深さを決定します。このパラメーターの許容値は、0か

ATR is a measure of volatility introduced by market technician J. Welles Wilder Jr. in his book, "New Concepts in Technical Trading Systems". In general, traders are accustomed to seeing the ATR in the form of a sub-window indicator. What I am presenting here is a simplified version of ATR - just the current ATR number - very useful for monitoring just the very moment of the current chart. If you want to monitor several timeframes in the same chart, just add the ATR Monitor indicator several tim
FREE
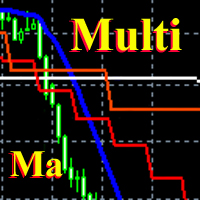
This is the same Ma Multi indicator that was previously available only for Mt4 . Now there is a version for Mt5 . It belongs to a whole family of multi-frame indicators, implementing the idea of displaying different timeframes in a single time scale. Horizontal fixation the scale allows one glance to get the big picture and provides additional opportunities for technical analysis. The indicator is tested on Just2trade Indicator parameters: MA_Period - averaging period of the moving av
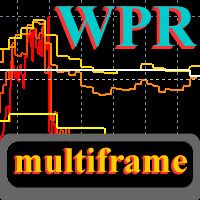
This is a multi-frame version of the standard indicator " Williams Percent Range ", that was previously available only for Mt4 . Now there is a version for Mt5 . Like the other indicators of the author, it allows you to see any set of timeframes at the same time, and all they will be presented on a scale of the current price chart. You can choose any set of timeframes of the indicator and freely switch to the price chart in both the highter and the lower direction. For each price period, indi

Infinite Storm EA is a safe and fully automated expert advisor that analyzes market trend and price movements and thanks to that is able achieve high rate of winning trades. Every order has StopLoss (either real or virtual) and EA has implemented advanced filtering functions together with spread and slippage protections. This EA does NOT use any of the dangerous strategies like Martingale, Grid or Arbitrage. This EA is fully customizable by user. This EA is not limited by trading pair or time

The Volume Average Indicator plots an adjustable average mathed by the ON-BALANCE-VOLUME. You can use to see the volume points where the market works in favor to your trades, based on volume/price. It works at all timeframes and instruments.
Product Features Volume Average ploted at the chart. Indicator Parameters VOL Ema - Set the EMA vol períod you want work with.

About. This indicator is the combination of 3 Exponential Moving averages, 3,13 and 144. it features Taking trades in the direction of trend, and also helps the trade to spot early trend change through Small moving averages crossing Big Moving averages Product features 1. Have built in Notification system to be set as the user desires (Alerts, Popup notification and Push Notification to Mobile devices) so with notification on, you do not need to be at home, or glued to the computer, only set and
FREE

Определения текущей тенденции одна из самых важных задач трейдера не зависимо от стиля торговли. Индикатор Quantum Trend Volume поможет с достаточно высокой вероятностью это сделать. Quantum Trend Volume - индикатор распознавания тенденции, использующий авторский алгоритм расчета. Показания индикатора не изменяются не при каких условиях. В качестве дополнительной фильтрации используются тиковые объемы. Индикатор подходит для любой валютной пары, любого таймфрейма, также его можно применять в
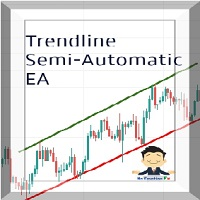
Managing Trades With Trendline EA : Trendline EA is a very good tool for using trend at your advantage & can be used for managing both take profit & stop loss . Can be used in all time frames and uses close price of Candle as stop loss therefore it will close the trade only if candle closes above or below trendline , this function saves traders from wicks and market noise . Where as Take profit is by simple touch of trendline.
For More info click on link below : https://www.noemotionf

This indicator represent option and basis values as a tax, using this formula: Tax = ( ( strike / ( basis - option ) ) - 1 ) * 100 It's not time based (don't use time to expire information) You can set a fixed strike value, and a fixed basis symbol if needed. Some exchanges/brokers don't provide this information at marketdata and that's the only method to use this information when not provided.

PINBAR SCANNER PRO with TREND and RSI + CCI OSCILLATORS filter This indicator has been designed to automatically and constantly scan entire market to find high probability pinbar formations, so you can just wait for the perfect trading opportunity come to you automatically.
PINBAR is the strongest candle reversal pattern known in technical analysis. It shows excellent areas to determine potential entries and exits with opportunity to use excellent risk and reward ratios. It includes an RSI an

Divergent
Divergent - дивергенция является самым надежным торговым сигналом на финансовом рынке. Советник находит классические дивергенции и входит в рынок. Версия для Metatrader 4 Divergent MT4 Бэктестирование и оптимизация проводились на реальных тиках с качеством истории 99,9%. Основные принципы торговли подробнее: Робот следит за котировками и индикаторами указывающими на дивергенции; Для фильтра расхождения цены и индикатора MACD в код робота встроены дополнительные фильтры; При усилении д
Managing Trades With Moving Average EA : Many Traders like using Moving Averages for trend confirmation , and timing Entry and Exits . With Semi- Automatic Moving Average EA we provide effective way to manage open trades as per your Moving average strategy and uses MA as trailing stop loss. EA considers only closing price of candle therefore avoids stop outs caused by sudden price fluctuations and helps to stay in trend longer. You can decide which MA to use and various settings of MA

Ace Supply Demand Zone Indicator The concept of supply demand relies on the quantity mismatching between buying and selling volumes in the financial market. Supply and demand zone can provide the good entry and exit. A zone is easier to trade than a line. The supply demand zone can provide the detailed trading plan and the risk management. Its ability to predict market direction is high. There are two distinctive points about Ace Supply Demand Zone Indicator. Ace Supply Demand Zone indicator was

長期の非ランダム成分を分離するためには、価格がどれだけ変化したのかだけでなく、これらの変化がどのように発生したのかも知る必要があります。言い換えれば - 私たちは価格レベルの値だけでなく、これらのレベルが互いに置き換わる順序にも興味があります。このアプローチを通して、ある時点での価格変動に影響を与える(または影響を与える可能性がある)長期的で安定した要因を見つけることができます。そしてこれらの要因の知識はあなたが多かれ少なかれ正確な予測をすることを可能にします。 金融系列の分析からどの程度具体的な結果を得たいのかを判断しましょう。 •まず、トレンドが市場に存在する場合は、そのトレンドを強調する必要があります。 •次に、定期的な要素を特定する必要があります。 •第三に、結果は予測に使用するのに十分安定しているべきである。 •そして最後に、私たちの分析方法は現在の市場の状況に適応するはずです。 指定された条件を満たすために、相対的な価格変動の回帰分析を使用し、このモデルに基づいて指標を作ります。この指標のアルゴリズムは履歴データからの学習に基づいており、その作業はトレーダーの完全な管理下

非常に頻繁に、金融シリーズの研究でそれらの平滑化を適用します。平滑化を使用すると、高周波成分を除去することができます - それらはランダムな要因によって引き起こされているため、無関係であると考えられています。平滑化には常に、データを平均化する何らかの方法が含まれます。この方法では、時系列のランダムな変化が相互に吸収します。ほとんどの場合、この目的のために、指数平滑法と同様に単純または加重移動平均法が使用されます。 これらの方法にはそれぞれ、長所と短所があります。したがって、単純な移動平均は単純で直感的ですが、その適用には時系列の周期成分と傾向成分の相対的な安定性が必要です。さらに、信号遅延は移動平均の特性です。指数平滑法はラグ効果がありません。しかし、ここでも欠陥があります - 指数平滑化は、系列をランダムな異常値と整列させる場合にのみ有効です。 単純平均と指数平均の間の妥当な妥協点は、加重移動平均の使用です。しかしながら、特定の重量値を選ぶという問題がある。これをまとめてみましょう。 それで、最初に私達が平滑化手順から達成したいことを定義します: •まず、価格系列からランダムな

This LEGIT Indicator Can Accurately Predict the Outcome of One Bar.
Imagine adding more filters to further increase your probability!
Unlike other products, Binary Options PRO can analyze past signals giving you the statistical edge.
How Increase Your Probability
Information revealed here www.mql5.com/en/blogs/post/727038 NOTE: The selection of a Good Broker is important for the overall success in trading Binary Options.
Benefits You Get
Unique algorithm that anticipates price weaknes

This is Gekko's Bollinger Bands indicator. It extends the use of the famous Bollinger Bands and calculates strong entry and exit signals using price action on the edge and on the middle bands. You can set it up in many different ways, eg: pullback, pullback against trend, middle band crossing and middle band crossing against trend. Inputs Number of Bars to Plot Indicator: number of historical bars to plot the indicator, keep it low for better performance; Produces Signal Only When a Bar Closes:

The EA uses 6 strategies. Trading is carried out in a pair of several currencies at the same time, for example, the EA opens orders simultaneously for two or more pairs and closes when a certain profit is reached.
The EA trades many major currency pairs. Attention! This EA is only for "hedging" accounts. Monitoring : https://www.mql5.com/en/signals/author/profi_mql Detailed description of important parameters and download set files here: https://www.mql5.com/ru/blogs/post/727816 МetaТrade

Automatic MIDAS positioning, the indicator allows the placement of two MIDAS, each one have 3 lines that can be calculated using Open/High/Low/Close/Median/Typical or Weighted prices, you can attach each MIDAS to the Open/High/Low or Close bars of any day, including the current day, once attached, if the price of this bar changes or you change the time frame, the indicator will do the repositioning and recalculation. You can also do a manual repositioning of the two MIDAS by moving its start lab
DEMA Cross
DEMA Cross - это мультивалютный трендовый советник, работающий на реальных счетах любого типа, на любом временном интервале, с любым начальным депозитом, с постоянным или изменяющимся размером лота, с четырех- и с пятизначными котировками, а также с брокерами, использующими различный тип заливки ордеров.
Отличительной особенностью советника является его стабильность и, что особенно важно, его достоверность. Результаты проверки советника в тестере стратегий в 4-х режимах (2 основ
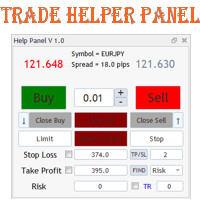
Данная панель предназначена для удобного совершения сделок в платформе Metatrader. Она позволяет с легкостью открывать позиции, устанавливать стоп лосс и тэйк профит, использовать трейлинг стоп и тд..
Входные параметры :
Magic - уникальный номер эксперта Lot step - шаг изменения лота Custom - произвольная сумма для высчитывания риска Risk Value - тип поиска значения риска (в %) Функции панели : Открытие sell и buy позиций
Возможность установки profit / loss для позиции, в том числе и графи

Volume Delta Panel is a very powerful indicator that read the supply on Market. It calculates the Delta from movement of the price and the difference of BUY volumes and SELL volumes. The Volumes are added to price and normalized to symbol points.
Its special structure allows you to get all Time Frames values available on the platform MT5. Panel can show 50 instruments simultaneously all customizable according to the offer of the Broker. A good observation of this instrument can suggest great

Description Very robust and powerful indicator, which allows through its 4 components, trade the market in trend or not trending conditions. it based on a very reliable trading strategy and gives you all you need to be succesful in trading. KEY LINKS: Indicator Manual – How to Install – Frequent Questions - All Products How is Clever Scalper Pro useful to you? A complete and reliable trading strategy. Easy to understand and trade Allow to identify trend, confirm it, look for retraceme

この指標はより有益です。彼の研究は、市場における価格の動きが特定の色のノイズとして表現されるという仮定に基づいており、それは価格値の分布のパラメータに依存します。これにより、さまざまな角度から価格変動を分析することができ、価格変動を特定の色のノイズと見なして、市場の現在の状況に関する情報を入手し、価格の動向に関する予測を行うことができます。 インディケータの読みを分析するとき、インディケータラインの位置は考慮に入れられます - それらは現在のバーの始値の上下にそしてそれからどれだけ離れて位置しています。 ホワイトノイズ(White Noise) - このアプローチは、価格(現在と先史時代の両方)が電力で等しいと考えられているという事実によって特徴付けられ、それはそれを単純な移動平均と組み合わせます。ホワイトノイズ信号は、文字を確認している可能性が高く、現在の価格から逸脱するほど、市場のトレンドの動きが強くなります。逆に、ホワイトノイズラインが始値に近い場合、これはトレンドの終わりまたは横方向の価格変動のいずれかの証拠です。 フリッカーノイズ(Flicker Noise)はトレンドの上

「 AIS Color Noise Filter 」指標のいくつかの欠点にもかかわらず、それを使用して価格系列と予測価格を平滑化するという考えは非常に魅力的に見えます。 これはいくつかの理由によるものです。 第一に、いくつかのノイズ成分を考慮に入れることは、互いに独立した要因について予測を構築することを可能にし、それは予測の質を改善することができる。 第二に、価格系列の雑音特性は全履歴を通して非常に安定して振舞い、それは安定した結果を得ることを可能にする。 そして最後に、ノイズの変動性により、予測システムが非常に敏感になり、価格の変化に対する反応が非常に速くなることを期待できます。 その結果、すべての単純化にもかかわらず、価格が移動するチャネルを正確に予測できるという指標が得られました。この指標の主な利点は、その高速さと習得の容易さです。主な不利点は、指標が予測に最も重要な要素を選択できないことです。 LH は、予測が行われる履歴データの長さを設定するパラメータです。その許容値は0から255ですが、標識が処理する小節の数はこのパラメーターで指定された数より1単位以上多いです。

Description Very precise patterns to detect: entry signals as well as breakout, support and resistance reversal patterns. It points out zones in which, with a high probability, institutional orders with the potential to change the price’s direction and keep moving towards it, have been placed. Support: We create great tools for the entire trading community. Most of them are free. If you believe in what we do Support Us Here. KEY LINKS: Indicator Manual - All Products
How is this ind
Markets Heat indicator can help you determine correct course of action at current market situation, by calculating market's "heat level". What is market's "heat level"? Well, it's my own way of simplifying complex market conditions to ease decision-making process. How does it work? Most of time market is moving in some narrow range and can't "decide" where to go -> flat market -> cold market. Other times, price goes Up or Down -> making trend movements -> heating the market. More powerful trends

MarkerElliottWave is a panel for rapid and user-friendly manual markup of Elliott waves. One can select a color and a font of marks. There are also functions for removing the last markup and the entire markup made by the indicator. Markup is made in one click. Click five times - have five waves! MarkerElliottWave will be a great instrument both for beginners and professional analysts of Elliott waves.
Asesor Experto (EA) totalmente automático, opera sin ayuda del usuario, se llama Titan T-REX Robot (TTREX_EA),actualizado a la versión 2, diseñado a base de cálculos matemáticos y experiencia del diseñador plasmado en operaciones complejas que tratan de usar todas las herramientas propias posibles. Funciona con todas las criptomonedas y/o divisas del mercado Forex. No caduca, ni pasa de moda ya que se puede configurar el PERIODO desde M1..15, M30, H1.... Utiliza Scalping de forma moderada busca

Intraday Volume Profile analyze short-term information about price and volume, help you visualize the movement of price and volume. In short-term trading on Forex, usually use 5-, 15-, 30-, 60-minute and etc. intraday charts when trading on a market day. It is possible to use as an additional tool for intraday scalping .
The volume profile provides an excellent visual image of supply / demand for each price for the selected timeframe. Representing the Point of Control ( POC ), which indicate

TradeCopy MT5 Demo is an efficient MT4, MT5 single system only used on MT5 demo account. Features: 1, can achieve cross-MT4 and MT5 each other. 2. The transmitting end and the receiving end are in the same file, which is convenient to use. 3, can achieve cross-platform follow-up. 4, more ways to follow the order, you can follow the balance, net worth, lot ratio or fixed lot. 5, can enlarge or reduce the amount of the single. 6, the currency has a different name, you can convert. Use the wizard:
FREE

Session Volume Profile is an advanced graphical representation that displays trading activity during Forex trading sessions at specified price levels. The Forex market can be divided into four main trading sessions: the Australian session, the Asian session, the European session and the favorite trading time - the American (US) session. POC - profile can be used as a support and resistance level for intraday trading.
VWAP - Volume Weighted Average Price.
ATTENTION ! For the indicator to

TradeCopy is an efficient MT4, MT5 trade copy software,using as EA on MT4 real account. You can download the Demo unlimit version to test on Demo account: Trade Copy MT4 Demo Free Trade Copy MT5 Demo Free
Features: 1.Can achieve cross-MT4 and MT5 trade copy . 2. The Sender and the receiver are in the same file, which is convenient to use. 3.Can achieve cross-broker trade copy. 4.More trade copy style, you can copy by balance,equity, lot ratio or fixed lot . 5.Can enlarge or reduce the amou
The Absolute Strength (AS) is intended to chart the current and historical gain or loss of an underlying based on the closing prices of a recent trading period. It is based on mathematical decorrelation. It shows absolute strength momentum.
This indicator is not measured on a scale like Relative Strength (RSI). Shorter or longer timeframes are used for alternately shorter or longer outlooks. Extreme high and low percentage values occur less frequently but indicate stronger momentum of the un

Trading was never easy until experience and continuous improvement is used as a strategy. Trend Sniper Fire scalper is one of the best EA witch is now available for MT5 platforms. This Expert Adviser uses a combination of indicators and Price Action to analyse the market. Its major strategy used a trailing stop and hedging to ensure continuous profits. It is slightly affected by the economic news but there is also an MT4 version with a news filter. Regardless of news effects, this EA was revised
MetaTraderマーケットは、履歴データを使ったテストと最適化のための無料のデモ自動売買ロボットをダウンロードできる唯一のストアです。
アプリ概要と他のカスタマーからのレビューをご覧になり、ターミナルにダウンロードし、購入する前に自動売買ロボットをテストしてください。完全に無料でアプリをテストできるのはMetaTraderマーケットだけです。
取引の機会を逃しています。
- 無料取引アプリ
- 8千を超えるシグナルをコピー
- 金融ニュースで金融マーケットを探索
新規登録
ログイン