适用于MetaTrader 5的新EA交易和指标 - 160

Thermo MAP is a multicurrency and multitimeframe indicator that display a smart heat map based on proprietary calculations. Watch how Forex market moved and is currently moving with a single dashboard and have a consistent and good idea of what is happening!
It can be suitable for both scalping or medium/long term, just select options that better fit your trading style Symbols list are automatically sorted based on the preferred column. There is the possibility to click on: First row, timefram
FREE

Institutional Levels is an intelligent, fully automated Expert Advisor. This algo is arranged in such a way that the EA uses levels of importance combined with price action, without reliance on indicators. The strategy behind it is based on the teachings of a professional traders, and ex traders. It will find untested levels at which institutions are known to be interested in, in the number of candles you’ve set and will make trades based on these levels, re-test and trend. It will automaticall

The Rise: It is an advanced trading system. This is a fully automatic Expert Advisor, which allows you to presize the trade according to the preferences of the trade.
Is a revolution in the customization of the trading. The Rise is a expert advisor based in the indicator The Rise of Sky walker: ( https://www.mql5.com/es/market/product/44511 ) This system uses operations groups, which always beat the market
You can download the demo and test it yourself.
Very stable

Bamboo expert is based on the custom indicator Bamboo . Entry points are determined using Bamboo values. Positions are closed when reaching specified profit and loss levels or when opposite signal appears if Stop Loss and Take Profit values are zero. Input Parameters Period - Period parameter of the indicator Bamboo; Mode - operation mode of the Expert Advisor (0-7); Stop Loss - loss fixing level in points; Take Profit - profit fixing levels in points; Lot - lot size. The screenshots demonstrate
FREE

Hello all friends What I will present today is a grid system that doesn't have grid. Its work is Open to buy and sell at the same time. Or choose to open either side in the settings. The weakness of this system is that when the graph runs one way for a long time, it is very damaged. I have prepared a function for reducing damage.Details about how to set up according to the youtube link.

Stop Loss with Profit
Free Version*.
Complete Version here.
This utility / expert for MetaTrader 5 modifies the stop loss of all your operations dynamically and automatically to ensure the minimum benefits you want, and be able to operate with or without Take Profit.
Maximize your benefits, by being able to trade with Unlimited Take Profit. You will ensure the number of minimum points you want to earn in each operation and the stop loss will be adjusted as long as the benefit of the oper
FREE

Stop Loss with Profit
This utility / expert for MetaTrader 5 modifies the stop loss of all your operations dynamically and automatically to ensure the minimum benefits you want, and be able to operate with or without Take Profit.
Maximize your benefits, by being able to trade with Unlimited Take Profit. You will ensure the number of minimum points you want to earn in each operation and the stop loss will be adjusted as long as the benefit of the operation grows.
For example: you open a pur

The DYJ Moving Average Cross is a unique High quality and easy to use and affordable trading tool because we have incorporated a number of proprietary features and Moving Average indicators. The Indicator is based on the following idea: crossing of two Moving Average lines (Fast and slow ) is used as a signal for opening and closing a position together. Go Long when Fast MA (MA1) crosses above Slow MA (MA2). Go Short when Fast MA (MA1) crosses below Slow MA (MA2). The EA uses dynamic alloca

Ondas de Divergência. Antes do mercado tomar um sentido e se manter em tendencia, existem sinais que podem ser lidos, nos permitindo assim entender o "lado mas forte", e realizar trades de maior probabilidade de acerto com risco reduzido, esses movimentos são persistentes e contínuos, proporcionando excelente rentabilidade. Ondas de Divergência é um histograma que acumula a divergência de entre preço e volume a cada tick, permitindo assim encontrar pontos de absorção, áreas de acumulo e distrib

The DYJ ThreeMACross is based on three Moving Average indicators. ThreeMACross is based on the following idea: crossing of three Moving Average lines (Fast, Middle and slow ones) is used as a signal for opening and closing a position together. Go Long when Fast MA (MA1) crosses above Middle MA (MA2), and Middle MA (MA2) crosses above Slow MA (MA3). Go Short when Fast MA (MA1) crosses below Middle MA (MA2), and Middle MA (MA2) crosses below Slow MA (MA3). The Expert Advisor also features money m
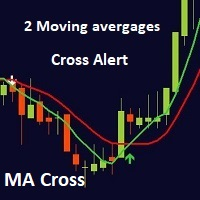
MA cross ALERT MT5 This indicator is a full 2 moving averages cross Alert ( email and push notification "mobile" ), 2 MA with full control of MA method and applied price for each moving average "slow and fast", -simple, exponential, smoothed, linear weighted. - close, open, high, low, median price, typical price, weighted price. you can modify periods as well for both MA. For any suggestions don't hesitate, thanks
Boleta de negociação, adiciona automáticamente as ordens Take Profit e Stop Loss quando excutada uma ordem de compra ou venda. Ao apertar as teclas de atalho (A, D, ou TAB), serão inseridas duas linhas de pre-visualização, representando as futuras ordens de take profit (azul) e stop loss (vermelho), as quais irão manter o distanciamento especificado pelo usuário. Ditas ordens só serão adicionadas ao ser executada a ordem inicial. Ao operar a mercado, as ordens pendentes de take profit, e stop lo

Orca EA ΜΤ5 是一款全自动智能交易系统。其先进的基于价格行为的算法试图预测下一根蜡烛的方向并打开(或不打开)适当的交易。它具有独特数量的设置,使其在所有市场条件下都极为通用。 Orca EA ΜΤ5 随附提供的 2022 年设置文件,专门针对 ECN Raw Spread ICMarkets 账户(基于纽约的 GMT+3 时区服务器)进行了优化。可能会使用其他经纪商或账户类型,但您可能需要测试 Orca EA MT5 并进行任何必要的时间调整以适合您的经纪商/账户。 建议: 我所有的 EA 都不是预测市场的奇迹产品,而是诚实、编码良好的专家顾问,他们试图赢多于输。 他们不使用 mar 或网格策略,因此他们的结果不是直线盈利线,而是有起有落,需要耐心和纪律才能成功。 我的一般建议是在您的策略测试器中测试我提供的所有设置文件,如果您发现任何有趣的东西,请考虑购买。 如果您决定购买,请仅交易过去几个月在策略测试器中表现良好且每笔交易风险低 0.5% 至 1% 的交易品种,而不是所有提供的设置文件。 我建议每 2-3 个月对所有提供的设置文件重复此回测,然后选择在

Color Levels - удобный инструмент для тех, кто использует технический анализ с использованием таких инструментов, как Трендовая линия и Прямоугольник. Имеется возможность настройки двух пустых прямоугольников, трех закрашенных и двух трендовых линий. Настройки индикатора крайне просты и делятся на пронумерованные блоки: С цифрами 1 и 2 вначале - настройки пустых прямоугольников (рамок); С цифрами 3, 4 и 5 - настройки закрашенных прямоугольников; С цифрами 6 и 7 - настройки трендовых линий. Объ

策略描述: 本EA为趋势EA,思路是最简单的追涨追跌的交易手法,配合移动止损及时截断亏损让利润奔跑,本EA主要交易EURUSD 和 XAUUSD。 参数设置: Transaction : 只有Transaction=true时EA才会工作。 Lots : 下单手数,建议10000USD下单1标准手 即:1000USD 下 0.1手。 less_stop : 净值低于不在交易。 Maxi_point : 最大点差限制,这里要看黄金的报价小数,比如黄金两位小数点报价的平台您限制最大点差为50,那么三位小数点报价的平台就是设置500。 SL_symbol_1 : SL_symbol_2 : 产品1和产品二的止损点数,比如黄金两位小数点报价的平台您设置止损点数为300,那么三位小数点报价的平台就是设置3000。 symbol_1 : symbol_2 : 产品1和产品二的昵称,并不是所有平台的黄金都叫 "XAUUSD "。请根据平台的昵称填写。注意symbol_1 填欧元兑美元 ,symbol_2填黄金

该指标在图表上显示利润区域,显示局部趋势的开始和结束 利润区PRO是完美的所有元交易者符号:货币,金属,加密货币,股票和指数
利润区PRO指标的优点:
输入信号而不重绘 该指标的算法允许您找到进入交易(购买或出售资产)的理想时刻,这为100%的交易者增加了交易的成功。 该指标有两个利润水平,允许您以保证收入部分平仓。 该指标分析交易的比例 该指标显示您的盈利/亏损交易的统计数据,以便您更好地了解Profit Zone PRO的交易总数中有多少确定了正确的交易方向 利润区PRO指标有信号缓冲区,允许您基于它创建交易机器人 通知到手机。 您可以轻松地坚持将消息发送到您的手机,不要错过一个强劲趋势的开始 最低存款额。 Minimum100的最低存款金额足以与Profit Zone PRO指标一起工作(对于外汇对和初始手数0.01),它是 易于安装和使用。 元交易的基本知识足以开始使用该指标并获利
Profit Zone pro指标如何工作 ? 在指示信号以向上或向下箭头的形式出现后,等待信号形成的当前蜡烛的结束 同方向开仓 设置离进场价格最近的极端的止损水平 在价格向信

The expert trades at the opening of the market after the weekend, focusing on the price gap (GAP). Already developed sets are in the comments. At the same time, various options are available in the expert settings, allowing you to create your own unique sets yourself. Download settings (sets): https://www.mql5.com/en/blogs/post/747929 Currency pairs for which the sets have been developed: GBPUSD, AUDUSD, NZDUSD, USDCAD, EURGBP, EURCHF, GBPCAD, GBPAUD, AUDCHF, AUDJPY, AUDNZD, CHFJPY, CADJPY,
Unique trend trading algorithm with advanced filtering and many features which should become a part of your trading arsenal. This indicator can give you also trading advisors (with take profit target), success rate scanner and much more.
Important information
For additional detailed information you can visit the 747Developments website.
Features Easy to use (just drag and drop to the chart) Possible to use with any trading instrument Possible to use on any time-frame Take profit advisors S

Dynamic Indicator --> YKL_DinDX Dynamic Indicator that creates a Band based on the distance from moving average specified by the user. The indicator considers the period entered by the user in order to calculate the average distance from moving average, creating an upper band and a lower band. This indicator is utilized by EA YKL_Scalper, version 2.0 or superior.
FREE

The Display N Bars utility is a simple tool designed to help identify candles.
If a trader tries to share knowledge with a colleague but it is difficult to pinpoint exactly the desired candle, just say the corresponding candle number.
The candle count is reset every day.
Seeking to offer a good customization the inputs are:
Display type -> Display only odd, only odd, or both candles?
Direction -> Horizontal or Vertical?
Display multiples of: (display frequency) -> Displa
FREE
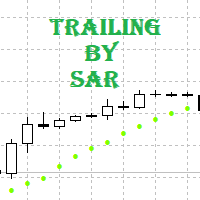
Tracking positions using trailing on the Parabolic SAR indicator. It is necessary to allow automated trading in the terminal settings. In testing mode, the utility opens Buy or Sell positions on the first ticks, which allows you to visually observe the given logic, changing the utility parameters. In real mode, the utility does not open positions. Parameters magic - magic number. If less than 0, positions with any magic number are tracked. only_this_symbol - only chart symbol. If false , posi
FREE

DYJ Williams Percent Range 是一个独特的高品质,易于使用和负担得起的交易工具,因为我们已经纳入了一些专有功能和 Williams' Percent Range 指标。指标值在-80%到-100%之间,表示市场超卖。介于-0%和-20%之间的指标值表明市场超买。 Input Parameters WPR settings InpSpread = 50 -- When the spread is greater than or equal to 50, the signal is ignored InpWPRPeriod = 360 -- WPR: averaging period InpWPROversoldArea = 99.9 -- Oversold Area InpWPROverboughtArea = 0.1 -- Overbought Area Trading settings InpLots = 0.01-- lots InpTF = PERIOD_H1 -- Time Frame InpPipStep =3
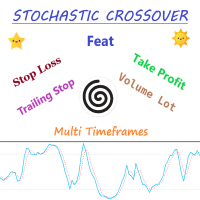
Expert Advisor Description - Basically, EA will open position in case of cross between main line and signal line on stochastic. - Unique to this EA, using the two pre-set stochastic so that the EA can open the trade position. - The first stochastic determines the cross, while the second stochastic determines the overbought or oversold levels.
Parameters Description - Volume_Lot => Number of lots determined from the balance percentage. Example Balance = 1.000 USD, Volume Lot = 100, Then lot

Expert Advisor Description Strategy using two classic indicators in MetaTrader, stochastic oscillator and moving average Accompanied by multi timeframe and parameter that can be changed according to the strategy that suits you
Feature Money Management : Stop Loss, Take Profit, Trailing Stop Trading Option : Stochastic Oscillator, two Moving Average, Multi Timeframes https://youtu.be/3dXAUUnxg1s
youtubeembedcode.com/pl/ http://add-link-exchange.com

KT Murrey Math robot incorporates a trading strategy that explicitly trades the price bars that crossed above or below a Murrey Math level. Entries: A buy order is placed when a bar closes above a Murrey Math level. A sell order is placed when a bar closes below a Murrey math level. Exits: EA places the stop-loss and take-profit always at the subsequent Murrey Math levels.
MT4 Version is available here https://www.mql5.com/en/market/product/45404
Features
This EA combines a simple Murrey

Displays previous months Highs & Lows. You can set the number of months to display levels for, also the line style, color and width. This is very useful for traders using the BTMM and other methods like ICT. I'll be creating more indicators for MT5 for the BTMM. Send me your suggestions to my Telegram: https://t.me/JDelgadoCR Take a look at my other products at: https://www.mql5.com/en/users/jdelgadocr/seller
FREE

Version 1.14 incorporates some significant changes compared to all previous versions. Additionally, this robot has been designed in a new manner, focusing on minimal adjustable inputs because I personally advocate simplicity within the complexity of anything. Hence, a minimalist user interface has been implemented without compromising performance. This robot also has its version for the MT4 platform, which will be released soon. What can you expect from this robot? Well, I've been hard at work,

Just $10 for six months!!! Displays previous weeks Highs & Lows. You can set the number of weeks to display levels for, also the line style, color and width. This is very useful for traders using the BTMM and other methods like ICT. I'll be creating more indicators for MT5 for the BTMM. Send me your suggestions to my Telegram: https://t.me/JDelgadoCR Take a look at my other products at: https://www.mql5.com/en/users/jdelgadocr/seller

Just $10 for six months!!! Displays previous days Highs & Lows. You can set the number of days to display levels for, also the line style, color and width. This is very useful for traders using the BTMM and other methods like ICT. I'll be creating more indicators for MT5 for the BTMM. Send me your suggestions to my Telegram: https://t.me/JDelgadoCR Take a look at my other products at: https://www.mql5.com/en/users/jdelgadocr/seller

This indicator is based on the ICCI.
If a long pattern is detected, the indicator displays a buy arrow.
If a short pattern is detected, the indicator displays a sell arrow. Settings
CCI Period - default set to (14) Features
Works on all currency pairs and timeframes
Draws Arrows on chart Colors
Line Color
Line Width
Line Style
Arrow Color This tool can help you analyse the market and indicates market entry.

Backtest from 2015-2019 MetaQuotes Data Every Tick Mode.
Start depo 10000 USD Lot size: 0,5 (You can modify it but maintain the ratio)
EA created for EURUSD M15
Open transaction based on RVI + Momentum + MA Crossover
Close transaction based on Stochastic
The parameters of indicators have been optimized.
Change manually only lot size.
EA does one transaction at the time.
No adding position, no martingale, no grid.
To avoid risky situations.
Fell free to increase lot size

The most advanced news filter and drawdown limiter on MQL market NEW: Take a Break can be backtested against your account history! Check the " What's new " tab for details. Take a Break has evolved from a once simple news filter to a full-fledged account protection tool. It pauses any other EA during potentially unfavorable market conditions and will continue trading when the noise is over. Typical use cases: Stop trading during news/high volatility (+ close my trades before). Stop trading when

价格水平细分、高级统计、止盈计算和 3 种通知类型。 好处: 不要重绘你的结果 严格在蜡烛收盘时发出信号 假击穿过滤算法 它适用于任何趋势策略。 适用于所有工具和时间序列 手册和说明 -> 这里 / 问题解决 -> 这里 / MT4 版本 -> 这里 如何使用指标进行交易 只需三个简单的步骤即可使用 AW Breakout Catcher 进行交易: 第 1 步 - 开仓 收到买入信号,成功率超过 70% 第 2 步 - 确定止损 通过相反的信号选择中继线 第 3 步 - 定义止盈策略 策略一:达到 TP1 时平仓 策略 2:达到 TP1 时平仓 50%,达到 TP2 时平仓剩余 50% 策略 3:根据相反信号平仓 统计模块 为了更好地选择配对,请使用内置的统计计算。 计算交易 - 给出统计数据的信号总数 成功评级 - 达到 TP1 的信号百分比,或反转那些正获利的信号时的百分比 TakeProfit1 Hit - 达到 TP1 的信号百分比 TakeProfit2 Hit - 达到 TP2 的信号百分比 ExitProfit - 未达到 TP1 的信号百分比,但通过新信
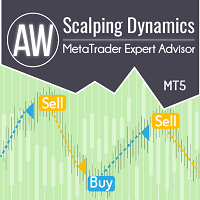
基于趋势逆转的全自动高级交易机器人。如果有必要,可以使用网格策略。当达到最大推车负载时,内置 3 种类型的通知和位置锁定。 建议在 M15 时间范围内为 EURUSD 使用默认设置。 特点和优点: 能够同时在两个方向工作 具有在多个阶段按时工作的内在能力 使用经纪人不可见的虚拟止损 基于当前趋势活动的工作算法 内置自动手数计算 使用所有类型的通知 自动锁定头寸和禁用顾问的能力 为篮子中的后续订单减少止盈 考虑当前趋势或逐步调整开仓订单 MT4版本-> 这里 / 故障排除 -> 这里 输入变量的详细说明和说明 -> 这里 顾问如何交易: -首先,在交易时,会考虑当前趋势活动(“主趋势过滤器”变量)。它越小,反转的可能性就越高,EA 将打开的订单就越少。
-当打开每个新订单时,EA 通过“趋势过滤器减少每个订单”来减少趋势的活动,以获取后续信号。
- 在趋势过滤信号之后使用振荡器反转信号。 确定振荡器信号活动的变量是 - 振荡器周期 - 振荡器周期。越小,信号越活跃。
振荡器区域的 K1 - 权重因子 #1。它越小,信号越活跃。
振荡器区域的 K2

該顧問是根據2TF策略為EURUSD和GBPUSD開發的。
使用的指標:EMA(5),EMA(10),ADX(28),MACD(5; 10; 4)。
採購規則
EMA(快速)從下至上越過EMA(慢速)。 –DI(紅色)上方的ADX + DI(藍色)。 MACD大於零。 出售規則
EMA(快速)從頂部到底部越過EMA(慢速)。 ADX + DI(藍色)在–DI(紅色)之下。 MACD低於零。 陪同交易 每日圖表
止損設置為信號蠟燭的最小值(購買)\最大值(銷售)。 英鎊/美元-250點,歐元/美元-200點的利潤。 在達到一半止盈後,交易被轉換為盈虧平衡。 H4圖
英鎊/美元的獲利為70點,歐元/美元的獲利為60點。 止損設置為信號蠟燭的ЕМА(10)下方(購買)\上方(銷售)3-5點。訂單的大小不能少於35點,並且不能超過獲利的大小。 獲利40點後,交易轉移到盈虧平衡點。
在顧問的參數中,您可以更改各種策略設置,指標週期,設置止損,盈虧平衡水平等的大小和方法。如果對參數有疑問,請在討論中寫。
我很樂意回答有關最終確定該策略的問題和建議。
FREE

运行于AUDUSD,自动交易 USDCAD 和 UCDNOK ,EA为趋势对冲策略,不加倍,不网格,没有太多的参数需要调整简单实用。 参数设置: Transaction : 当Transaction=true时,EA才会工作。 Lots :下单量。 SL_money :亏损多少金额统一平仓所有货币的单子。 less_stop : 净值小于多少不在开仓。 推荐的平台: ECN,交易成本合理的其他平台(如:icmarkets),注意平台USDNOK 每波动一个点价值约是0.1... 即五位小数的报价平台。 策略使用开盘价开仓,持仓时间偏长,回测用1分钟数据和每个tick差别不大,在过去十年时间的回测表现比较平和, 当然过去的回测不代表未来,一段时间的亏损周期对于趋势型的交易来说是很正常的,不要随意加大仓位。

Easy start: Everything is already set up. The minimum Deposit is $ 100. Quick result. Convenient interface.
On the stock exchange, you can often hear that averaging, martingale, and other types of progressive money management do not work. The reality is that more than 90% of successful, highly profitable and long-standing signals use this method of money management. The situation is similar with top PAMM accounts. Sparta is a fully automatic multi-currency expert Advisor that uses a uniqu

Attention: New update - 4 major practicality improvements!
1) Alarm 2) Midas text value 3) Click panel 4) Can be connected to an EA to operate in semi-automatic mode
Attention - This indicator does not work perfectly in backtest due to MT5 peculiarities (Reading hotkeys or panel clicks) . My suggestion is that you test Automatic Vwap Midas which has automatic operation to analyze the calculation and then buy Start if you think the indicator will match your operating.
This indicator i

The Market Momentum indicator is based on the Volume Zone Oscillator (VZO), presented by Waleed Aly Khalil in the 2009 edition of the International Federation of Technical Analysts journal, and presents a fresh view of this market valuable data that is oftenly misunderstood and neglected: VOLUME. With this new approach of "seeing" Volume data, traders can infer more properly market behavior and increase their odds in a winning trade.
"The VZO is a leading volume oscillator; its basic usefulnes
FREE

The indicator for trading on the signals of the harmonic pattern AB=CD. It gives signals and shows the levels of entry into the market, as well as levels for placing stop orders, which allows the trader to make timely decisions on entering the market, as well as effectively manage positions and orders. It supports sending push notifications to a mobile device, e-mail, as well as alerts. This indicator has been ported from the version for MetaTrader 4. For more information, as well as a detailed

The Rise of Skywalker: It is an advanced trading system. This is a fully automatic Expert Advisor, which allows you to presize the trade according to the preferences of the trader. Is a revolution in the customization of the trading. The Rise of Skywalker is a expert advisor based in the indicator The Rise of Sky walker: ( https://www.mql5.com/es/market/product/44534 ) This system uses only one trade in each operation. Do not use Grip or martingale Low risk system since it h

Panthers Traders presents the new Expert Advisor "MRK TRADER", a robot for Forex, Indices, Commodities and Cryptocurrencies. This expert advisor works hedge strategies, has different variables to configure each other, works as a work tool or as a 100% automatic expert advisor, if you do not have experience, for your greater profitability, get in touch by private and I will explain your different variables and how to apply them in different assets, I recommend watching the videos of the YouTub

1. Why did I develop this series of indicators
I found that most traders need to use multiple time frame indicators. They usually switch time frame to see indicators. However, once the timeframe is switched, you cannot see the corresponding relationship between the price in the smaller timeframe and the indicator in the larger timeframe . For example: if your price chart is in H1 timeframe, you can see H4, D1 and W1 indicators in H1 timeframe Chart. This is more helpful for you to find t
MetaTrader市场是一个简单方便的网站,在这里开发者可以出售自己的交易应用程序。
我们将帮助您发布您的产品,并向您解释如何为市场准备您的产品描述。市场上所有的应用程序都是加密保护并且只能在买家的电脑上运行。非法拷贝是不可能的。
您错过了交易机会:
- 免费交易应用程序
- 8,000+信号可供复制
- 探索金融市场的经济新闻
注册
登录