YouTubeにあるマーケットチュートリアルビデオをご覧ください
ロボットや指標を購入する
仮想ホスティングで
EAを実行
EAを実行
ロボットや指標を購入前にテストする
マーケットで収入を得る
販売のためにプロダクトをプレゼンテーションする方法
MetaTrader 5のための新しいエキスパートアドバイザーとインディケータ - 164

IRB Scalper Original The Original version of IRB Scalper Pro (V3.0) The strategy: EA strategy is inspired from a profitable strategy of Mr Rob Hoffman (One of the best traders in the world with multiple prizes on manual trading) . 1.Entry: The EA search for IRB bars (Inventory retracement bar), and place sell pending order or buy pending order according to the trend confirmed by the calculation of a 20 EMA slope degree. We believe that most of IRB Bar are caused by huge institutions (Hedge funds

Multicurrency and multitimeframe modification of the Commodity Channel Index (CCI) indicator. You can specify any desired currencies and timeframes in the parameters. Also, the panel can send notifications when crossing overbought and oversold levels. By clicking on a cell with a period, this symbol and period will be opened. This is MTF Scanner. The key to hide the dashboard from the chart is "D" by default.
Parameters CCI Period — averaging period.
CCI Applied price — price type.
Clea
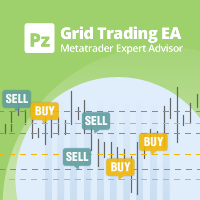
グリッド取引は、方向性、ボラティリティからの利益に依存せず、市場の本質的な波状の性質を使用する効率的な機械的取引戦略です。固定価格レベルを使用して、一方向または双方向で取引を開始および終了します。このような取引は、通常20〜200 pip間隔で行われ、取引グリッドを作成します。 [ ユーザーガイド | インストールガイド | 更新ガイド | トラブルシューティング | よくある質問 | すべての製品 ]
長所
設定と監視が簡単 時間枠に依存しません 指標や厳密な分析は不要 取引設定ではなく、取引価格帯 市場の予測はほとんど必要ありません 定期的に市場からお金を引き出す
特徴
ロング、ショートまたは双方向で取引できます 多くのシンボルを同時に取引できます グリッドは、トレーダーの裁量で閉じたり一時停止したりできます 指向性および双方向の利益目標を実装します
オープンエンドのグリッドは取引されません。露出は制限されます グリッド構成はその場で変更できます リスクとエクスポージャーは事前に計算および表示されます 3つの異なる動作を実装します
外国為替、CFD、先物に有
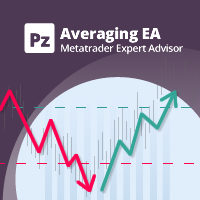
このEAは、平均化を使用して負けトレードを勝者に変えます。最初の取引がマイナスの領域に移行すると、回復メカニズムが作動し、一定の価格間隔で同じ方向に連続した市場注文を出します。このメカニズムはNFA / FIFOルールと互換性があり、米国のブローカーに受け入れられています。 [ ユーザーガイド | インストールガイド | 更新ガイド | トラブルシューティング | よくある質問 | すべての製品 ]
特徴
チャートボタンを使用して簡単に取引 完全にカスタマイズ可能な位置管理 制御および事前計算されたリスクエクスポージャー 多くの自動入力戦略を実装します カスタム指標を使用して取引できます
1000ドルからマイクロアカウントを取引 外国為替セッションによる取引のフィルタリング
平均化プロセスは完全にカスタマイズ可能で、取引のブロックごとに間隔とロットサイズを増やすことができます。
始める方法 EAを任意のチャートとタイムフレームにロードします リスクが許容されるまで設定を編集します チャートボタンを使用して取引するか、エントリ戦略を有効にします EAに取引を処理さ
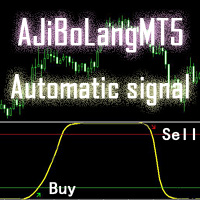
このAJiBoLang指標は、信号のすべてのサイクルに適しており、短期の信号に非常に適しています。信号の精度は良好です。
チャート上の矢印を見て、シングル注文をすると、緑色の矢印が買いシングル、赤い矢印が売りシングルです。
買い注文をした後、黄色い線が上のレベルまで上がって一定の距離を移動したら、買い注文を売ることができます。
売りを1つにした後、黄色い線が下のレベルに移動して一定の距離を移動すると、売り注文を売りにできます。
黄色い線が真ん中にあり、まだ注文をしていない場合は、黄色い線が折り返されていれば、買い注文をすることができ、この注文の精度は高くなります。
黄色い線が真ん中にあり、まだ注文をしていない場合は、黄色い線が折り返されていると、売りシングルを実行でき、この注文の精度は高くなります。
パラメータの説明
[alert_NO_OFF]:これはアラームスイッチで、trueに設定すると、矢印が表示されていれば自動的にプロンプトに警告し、falseに設定していれば警告しません。
[sendmail_NO_OFF]:これはメールを送信するためのス

This indicator can send alerts when a Heiken Ashi Smoothed color change occurs. Combined with your own rules and techniques, this indicator will allow you to create (or enhance) your own powerful system. Features Can send all types of alerts. Option to delay the alert one or more bars in order to confirm the color (trend) change. Input parameters Candle shift for alert: Default is 1. Setting it to 0 will alert you on color change on the current candle. This should be regarded as a pending (uncon
FREE

The original author is David Weis, an expert in the Wyckoff Method. The Weis Wave is a modern adaptation of the 1930's Wyckoff Method, another expert in Tape Reading techniques and Chart Analysis. Weis Waves takes market volume and stacks it into waves according to price conditions giving the trader valuable insights about the market conditions. If you want to learn more about this subject you can find tons of videos in YouTube. Just look for "The Wickoff Method", "Weis Wave" and "Volume Spread
FREE
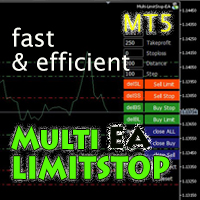
Multi LimitStop EA ( MT5 )
This EA is designed for automatic placing of pending orders (sell limit, buy limit, sell stop, buy stop) including Stop Loss & Take Profit levels (editable) with only one button click.
This EA can make order multi pending level / pending orders grid. So, with this EA placing pending orders will be faster , accurate and efficient .
Main Purposes Automation Pending orders grid style trading. Automation of the process of placing the Pending Orders: fast accurate ef

This EA trades untested fractals using pending orders. It offers many trading behaviors and flexible position management settings, plus many useful features like customizable trading sessions and a martingale mode. [ Installation Guide | Update Guide | Troubleshooting | FAQ | All Products ] Easy to use and supervise It implements 4 different trading behaviors Customizable break-even, SL, TP and trailing-stop Works for ECN/Non-ECN brokers Works for 2-3-4-5 digit symbols Trading can be NFA/FIFO C
FREE

Gamma Bands This indcator shows the trend with the color histogram. It is simple and easy to use. Usage: If the histogram changes from the aqua to the fuchsia, which means the trend is up. If the histogram changes from the fuchsia to the aqua,which means the trend is down. Inputs: MaPeriods: the periods of moving average. f1: the multiplier of inner bands f2: the multiplier of outer bands Popup Window Alert Email Alert Mobile Push Alert Alerts When the trend changes for the long trend to the

This is a non-trading expert which transforms unstructured web-pages into structured data tables. It downloads and parses an HTML file, then creates DOM ( Document Object Model ) for it, and finally applies specified CSS ( Cascading Style Sheets ) selectors for required fields and extracts data for them. You may consider it as a powerful and highly customizable HTML to CSV ( Comma-Separated Values ) converter. The EA can process web-pages from remote sites (using MetaTrader's WebRequest ) or loc
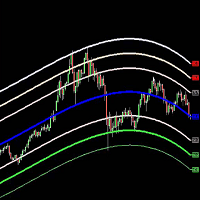
The Belkhayate center of gravity indicator is best used to confirm major turning points, and distinguish price extremes. Generally if price reaches the upper or lower levels one should expect a turn around coming soon, or at least a pull back towards the centre line if there is a strong trend. The upper and lower levels are red and green lines.
Our indicator use the same parameters as the well known trader M.Mostafa Belkhayate the inventor of the indicator, allow the use of buffers for your EA

According to trading experience: Some symbols are easy to reverse on certain days, such as Monday, or afternoon, and so on. So comparing the current price with the corresponding historical moment price is valuable. If the price coordinate system uses a logarithmic price, you will get a lot of valuable information. 1. What is this?
This program can convert the symbol price and add it to your Chart. You can compare it with your major chart. The DEMO version Link: https://www.mql5.com/en/market/p
Time Adjusted ATR The Time Adjusted ATR indicator is used to determine the anomalous volatility for exactly specified time of day. The indicator is useful for early identification of reversals, breakthroughs and considering volatility corrections. Options • ATR period: the number of bars of the standard ATR indicator for which the averaging is taken (recommended value = 1). • Normalized Base: how many days (bars) are used to calculate normalization (recommended value = 10 ~ 50). How is "Time

Ultimate Engulfing Bar Scanner (Multi Pair And Multi Time Frame) : ---LIMITED TIME OFFER: NEXT 25 CLIENTS ONLY ---46% OFF REGULAR PRICE AND 2 FREE BONUSES ---SEE BELOW FOR FULL DETAILS Nothing is more important than institutional price action and order flow.
And a strong engulfing candle is a clear indication that the institutions have flipped their sentiment.
Engulfing bar patterns are widely used by institutional traders around the world. As they allow you to manage
your trades withi

Индикатор, показывающий моменты пересечения важных уровней индикатора RSI. Может быть использован для поиска моментов пересечения уровней для успешной торговли на отскок или по тренду.
Входные параметры Inform about finding the signal - параметр, отвечающий за получение уведомлений (Alert) о найденном сигнале. По умолчанию - нет RSI period - Период RSI для работы RSI Max - Значение максимальной границы RSI RSI Min - Значение минимальной границы RSI
FREE

Ultimate Correlation Scanner (Multi Pair And Multi Time Frame) : ---LIMITED TIME OFFER: NEXT 25 CLIENTS ONLY ---46% OFF REGULAR PRICE AND 2 FREE BONUSES ---SEE BELOW FOR FULL DETAILS Correlations exist because of ongoing patterns in global capital flows.
Correlations are a fundamental market principle that underpin the markets.
And correlations will never go away. Global capital tends to flow (in unison) in and out of risk sensitive currencies.
While at the same time flowing in and out o

Ultimate Moving Average Scanner (Multi Pair And Multi Time Frame) : ---LIMITED TIME OFFER: NEXT 25 CLIENTS ONLY ---46% OFF REGULAR PRICE AND 2 FREE BONUSES ---SEE BELOW FOR FULL DETAILS Institutional traders use moving averages more than any other indicator. As moving averages offer a quick
and clear indication of the different phases of a trend. Such as expansion, pullback, consolidation and reversal.
And viewing the market through the same lens as the institutions is a critical part of y

Ultimate Volatility Scanner (Multi Pair And Multi Time Frame) : ---LIMITED TIME OFFER: NEXT 25 CLIENTS ONLY ---46% OFF REGULAR PRICE AND 2 FREE BONUSES ---SEE BELOW FOR FULL DETAILS Volatility expansion and contraction is a fundamental market principle that will NEVER go away.
And some of the largest institutions in the world invest enormous amounts of capital into various
types of volatility strategies. Not only for profit driven trading strategies, but also for risk control.
VOLATILITY
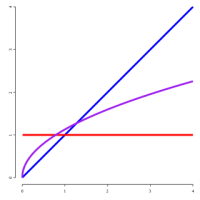
From https://en.wikipedia.org/wiki/Fractional_calculus:
Fractional calculus is a branch of mathematical analysis that studies the several different possibilities of defining real number powers or complex number powers of the differentiation operator D
This indicator execute fracional differentiation on data, you can select the differentiation D value and execute some tweaks like execute Log(value) before difefrentiation or execute a window normalization on last [diffNormalizeWindo

Dow Jones Top Bottom Trader EA5 has its own unique Breakout strategy . It BUYs when the price is near the top and it SELLs near the bottom of the previous bar. It uses 2 MACD indicators with the completed different settings to define trend and effectively filter wrong signals.
EASY SETUP
Symbol: US30 (Dow Jones) Timeframe: H1 Minimum Deposit: 10000 USD for amount 1 lot, 1000 USD for amount 0.1 lot, 100 USD for amount 0.01 lot Setting: Use default setting.
SIMPLE but EFFECTIVE
Test befo
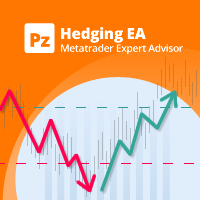
このEAは、独自の不均衡なヘッジ戦略を使用して、負け取引を勝者に変えます。最初の取引が事前定義された数のピップで負の領域に移動すると、回復メカニズムが作動します。限られた量の代替取引を現在の価格の上下に配置し、それらがすべて小さな純利益で閉じることができるようにします。 [ ユーザーガイド | インストールガイド | 更新ガイド | トラブルシューティング | よくある質問 | すべての製品 ]
特徴
使いやすく、監督
チャートボタンを使用して簡単に取引 完全にカスタマイズ可能な位置管理 制御および事前計算されたリスクエクスポージャー 多くの自動入力戦略を実装します 1,000ドルからのマイクロアカウントの取引 外国為替セッションによる取引のフィルタリング
始める方法 EAを任意のチャートとタイムフレームにロードします リスクが許容されるまで設定を編集します チャートボタンを使用した取引またはエントリ戦略の有効化
EAを機能させて利益を予約しましょう 繰り返す! 市場が長期にわたって横ばいの場合、少数のケースでは回復は失敗します。失敗すると、計算上の損失が発生します

この EA は、移動平均クロスオーバーを使用して取引します。完全にカスタマイズ可能な設定、柔軟なポジション管理設定に加えて、カスタマイズ可能な取引セッションやマーチンゲールおよび逆マーチンゲール モードなどの多くの便利な機能を提供します。 [ インストールガイド | 更新ガイド | トラブルシューティング | よくある質問 | すべての製品 ] 使いやすく、監視しやすい 完全にカスタマイズ可能な移動平均設定 2 つの異なる取引動作を実装します。 カスタマイズ可能な損益分岐点、SL、TP、トレーリング ストップ ECN/非ECNブローカーで機能 2-3-4-5 桁の記号に対応 取引はNFA/FIFOに準拠可能 反対のシグナルで取引を閉じることができます マーチンゲールと逆マーチンゲール機能を実装します 平日と時間帯で取引を絞り込む
組み込みの資金管理 EA は 4 つの異なる動作を実装します。 通常: 強気のクロスオーバーで買い、弱気のクロスオーバーで売る 逆:強気のクロスオーバーで売り、弱気のクロスオーバーで買う 買いのみ: 強気のクロスオーバーで購入し、弱気のクロスオーバーを無視す
FREE

このEAは、シーケンシャルで制御されたマルチンゲールを使用して、失われたトレードを回復します。最初のトレードが回復するまでロットサイズを増やしながら連続したトレードを行い、わずかな利益をもたらします。初期取引の管理から回復まで、手間のかからない完全な取引フレームワークを提供します。 EAはマルチンゲールを実装していることに注意してください。これは、後で回復するバランス損失をとることを意味します。 [ ユーザーガイド | インストールガイド | 更新ガイド | トラブルシューティング | よくある質問 | すべての製品 ]
特徴 使いやすく、監督
チャートボタンを使用して簡単に取引
制御および事前計算されたリスクエクスポージャー 多くの自動入力戦略を実装します カスタム指標を使用して取引することができます すべての注文はストップロスで発注されます 1,000ドルからのマイクロアカウントの取引 外国為替セッションによる取引のフィルタリング NFA / FIFO準拠
始める方法 EAを任意のチャートとタイムフレームにロードします リスクが許容されるまで設定を編集します チ

カップとハンドルのパターンは、カップとハンドルに似た技術的な価格構成です。カップは「U」字型で、ハンドルにはわずかに下向きのドリフトがあります。パターンの右側-ハンドル-は左側-cup-より小さく、上から50%以内に戻ります。継続パターンと反転パターンの両方があります。 [ インストールガイド | 更新ガイド | トラブルシューティング | よくある質問 | すべての製品 ] クリアな取引シグナル カスタマイズ可能な色とサイズ パフォーマンス統計を実装します カスタマイズ可能なサイズとパターン特性 適切なストップロスおよび利益レベルを表示します
再描画および非再描画ではありません 電子メール/音声/視覚アラートを実装します
入力パラメータ
振幅:振幅は、代替価格ポイント間のバーの最小量を表します。大きなパターンを見つけるには、振幅パラメーターを大きくします。小さなパターンを見つけるには、振幅パラメーターを小さくします。 カップの平坦度比:このパラメーターは、カップの上部がカップのサイズに対してどの程度「平坦」でなければならないかを示します。値を大きくすると、パターンはより厳密に

I recommend you to read the product's blog (manual) from start to end so that it is clear from the beginning what the indicactor offers. This multi time frame and multi symbol trend indicator sends an alert when a strong trend or trend reversal has been identified. It can do so by selecting to build up the dashboard using Moving average (single or double (both MA:s aligned and price above/below both)), RSI, Bollinger bands, ADX, Composite index (Constance M. Brown), Awesome (Bill Williams),

Trade the Ichimoku Kinko Hyo Indicator with complete freedom using a powerful and flexible EA. It implements many entry strategies and useful features, like customizable trading sessions and a martingale mode. [ Installation Guide | Update Guide | Troubleshooting | FAQ | All Products ] Easy to use and supervise It implements several entry conditions Customizable break-even, SL, TP and trailing-stop settings Works for ECN/Non-ECN brokers Works for 2-3-4-5 digit symbols Implements a martingale fea
FREE

This EA is a flexible and powerful metatrader expert advisor that trades using the MACD indicator and implements many useful features. It can trade using the MACD indicator alone, or donchian breakouts confirmed by the MACD indicator from any timeframe. Additionally, it offers a martingale feature and forex session filters. [ Installation Guide | Update Guide | Troubleshooting | FAQ | All Products ] Easy to use and supervise Fully configurable settings Customizable break-even, SL, TP and traili
FREE

Automated Expert Advisor developed for forex trading. - Expert Advisor is suitable for all types of accounts and any type of spread.
- The number of decimal places in quotes is determined automatically.
- Timeframe of the chart does not matter. You can use any. Work timeframe is defined in the settings.
- The EA always uses Take Profit and thus it is less sensitive to the speed of the broker.
- The EA has two built-in types of trailing stop. Any of them can be used.
- The EA features a spre

The principle of this indicator is very simple: detecting the trend with Moving Average, then monitoring the return point of graph by using the crossing of Stochastic Oscillator and finally predicting BUY and SELL signal with arrows, alerts and notifications. The parameters are fixed and automatically calculated on each time frame. Example: If you install indicator on EURUSD, timeframe M5: the indicator will detect the main trend with the Moving Average on this timeframe (for example the Moving

Blue Marlin Bollinger Bands Breakout This EA has built-in Bollinger Bands indicators to check the trends by breakout before performing any trading action. It's engine is provided with: trailing Stop Loss; bad time to trade filter for each day of the week; define in minutes the profitable orders duration; enable and disable martingale mode; define the maximum spread value to trade; define the minimum equity percentage to allow trading; the input values are already optimized for EURUSD at timefr

The Wolfalizer Indicator combines the functionality of the Engulfing Stochastic along with the ConsecutiveRSI and adds alerts along with more detailed output to the journal. This Indicator will alert you when RSI or Stochastics cross into oversold or overbought. You can set the oversold and overbought levels for RSI and Stochastics separately. You can pick if you want an engulfing candle to appear on the cross or set a number of consecutive candles you would like to see. Interesting Inputs inc

This expert advisor trades using the famous Parabolic Sar indicator and implements many other useful features for the exigent trader, like customizable indicator and trading settings, trading sessions and a martingale feature. [ Installation Guide | Update Guide | Troubleshooting | FAQ | All Products ] Easy to use and supervise Fully customizable parabolic sar settings Customizable break-even, SL, TP and trailing-stop Works for ECN/Non-ECN brokers Works for 2-3-4-5 digit symbols Trading can be
FREE

Trade donchian breakouts with complete freedom. This EA can trade any breakout period, any timeframe, with pending or market orders- as desired- and implements many other useful features for the exigent trader, like customizable trading sessions and week days, a martingale mode and inverse martingale mode. [ Installation Guide | Update Guide | Troubleshooting | FAQ | All Products ] Easy to use and supervise Customizable trading direction Customizable donchian breakout period It can trade using
FREE

This EA trades using the RSI Indicator. It offers many trading scenarios and flexible position management settings, plus many useful features like customizable trading sessions, a martingale and inverse martingale mode. [ Installation Guide | Update Guide | Troubleshooting | FAQ | All Products ] Easy to use and supervise It implements three different entry strategies Customizable break-even, SL, TP and trailing-stop Works for ECN/Non-ECN brokers Works for 2-3-4-5 digit symbols Trading can be NF
FREE

This EA trades using the Average Directional Index (ADX) indicator. It offers many entry strategies and flexible position management settings, plus many useful features like customizable trading sessions and a martingale mode. [ Installation Guide | Update Guide | Troubleshooting | FAQ | All Products ] Easy to use and supervise It implements 4 different entry strategies Customizable break-even, SL, TP and trailing-stop Works for ECN/Non-ECN brokers Works for 2-3-4-5 digit symbols Trading can be
FREE
This EA trades using the Stochastic Indicator. It offers many trading scenarios and flexible position management settings, plus many useful features like customizable trading sessions, a martingale and inverse martingale mode. [ Installation Guide | Update Guide | Troubleshooting | FAQ | All Products ] Easy to use and supervise It implements three different entry strategies Customizable break-even, SL, TP and trailing-stop Works for ECN/Non-ECN brokers Works for 2-3-4-5 digit symbols Trading can
FREE

This is a decorative utility that replaces the standard marks of completed deals with "Kingdom Come: Deliverance" game style markers.
In addition to the graphic display of the price and time of the transaction, the notes also contain a textual representation of the transaction volume. Running utility Drag the utility from the Navigator window to the desired graph. The utility does not use input parameters and does not require configuration. All trademarks available on the chart will be replace
FREE

The revolutionary automatic adviser of the new generation with three parameters:
Target profit per month (from 10% to 100%) Degree of risk (SuperLow, Low, Medium, High) Stop Loss Limit, USD Set up to work on EURUSD timeframe M15. Works on HEDGING accounts with a leverage of 1:500 and a Deposit from 500USD. Enough for work:
Decide on the size of the deposit that you can trust him
Set the value of the desired profit per month (from 10 to 100 percent) Select the degree of risk (Low, Medi

It is an indicator that works with oscillations based on golden proportions. Through this indicator it is possible to operate using the proportions of the number of gold to elaborate strategies with the golden ratio. In this way, it is possible to make market analyzes respecting the proportions of Fibonacci. How to use: The closer the lines are to each other, the greater the possibility of retraction or inversion of the movement, the same is true for the distance of the lines. Nearby lines, sug

Very useful information (VUI) - provides useful information on the following points:
Pip price - the price of point (pip) in the currency of the account with the volume specified by you Tick size - tick size Margin Buy - margin required to open a Buy order with the volume specified by you Margin Sell - margin required to open a Sell order with the volume specified by you Open Buy - the number of open positions, the number of open lots Buy Open Sell - the number of open

One click to close all (OCCA) provides you posibility to close all open position with one click.
Here is no any settings, just run the script and all your open positions will be closed and it will happen very fast !
Works with all types of accounts, with all currency pairs and any broker. The number of open positions is not limited.
The script will be useful for trading strategies, in which you need to manage a large number of positions.

Do you think it's a bit cumbersome when you need to switch symbols or timeframes with mouse click? 1. What is this? This is a program that can switch symbols and timeframes with direction keys. Fast switching, very convenient, no mouse click required. For traders, one symbol with multi-timeframe charts are usually added, you can change symbol on those charts easily . For multi-currency traders, different symbol charts are usually added, you can also change those timeframes easily. I wrote thi

It's a self-learning indicator. You need to set a starting time and download the relevant historical data for it to learn. Learn as few rules as possible and give the maximum freedom to the indicators. Therefore, the principle of choosing the best outcome during the learning period does not guarantee that every transaction is profitable. In general, the longer the study, the more reliable the results. In the strategy tester, you need to set the time parameter before the test starts so that the i
This EA trades daily breakouts placing bidirectional pending orders using the last day's trading range -or using market orders, as desired-, provided these price levels have not been yet tested. It offers many trading behaviors and flexible position management settings, plus a martingale and inverse martingale mode. [ Installation Guide | Update Guide | Troubleshooting | FAQ | All Products ] Easy to use and supervise Customizable break-even, SL, TP and trailing-stop Works for ECN/Non-ECN broker
FREE

This EA trades using the CCI Indicator. It offers many trading scenarios and flexible position management settings, plus many useful features like customizable trading sessions, a martingale and inverse martingale mode. [ Installation Guide | Update Guide | Troubleshooting | FAQ | All Products ] Easy to use and supervise It implements three different entry strategies Customizable break-even, SL, TP and trailing-stop Works for ECN/Non-ECN brokers Works for 2-3-4-5 digit symbols Trading can be NF
FREE

Бинарный индикатор находит свечной паттерн "Поглощение" и рисует соответствующий сигнал для входа рынок. Имеет встроенные фильтры и панель для просчета количества успешных сделок.
Особенности Работает для всех валютных пар и любых таймфреймов. Индикатор рассматривает комбинацию из 2-х или 3-х свечей в зависимости от настроек. Имеется возможность фильтровать сигналы путем настройки количества свечей одного цвета (тренда) до образования паттерна. Присутствует панель для отображения точности

Consecutive candles can give us an indication as to the strength of a trend. With this indicator, you can set the number of consecutive bull or bear candles you wish to be present before achieving a valid signal of RSI crossing into overbought or oversold. With this information, you can better judge if a continuation or reversal situation is about to present. RSI has two settable levels
Interesting settings: Number of consecutive candles needed before a valid signal Overbought level of RSI Ove
FREE

Export Deals to CSV - Excell File location: HistoryDeals/<SERVER>/<LOGIN>.<DATETIME>.csv Works as an Script, reading all DEALS in history and exporting it as a plain text CSV file There's no option to change. There's no WebRequest. There's no DLL use. I need to write 300 characters to allow this product being exposed at MQL5 market place. It's simple to use, plug it in graph and wait completion.
FREE

EU_Savings_Box (MT5 Expert Advisor)
This is 100% Algo Forex Trading Robot and is programmed for Long Term Investment with Low Risk. It uses no martingale, no grid, no scalping. The strategy combines 3 reliable and properly filtered indicators and price action to determine safe market entry and exit levels. This strategy has over 70% winning rate within 18 year plus. It is recommended for those looking for EA that can be trusted for many years. Moreover, you can adapt this EA to your preferred

Close Assistant (CA) is a full featured utility for monitoring and closing a set of positions placed by trader or EA. It closes filtered orders in specified time or level or candle patterns or when a certain profit or loss of the total positions is reached. CA uses Zero Profit Lock function to save deposit when total profit falls to zero. Profit and loss levels can be set in fixed amount of account currency or percentage of balance or equity or margin. CA only monitors and works on filtered pos
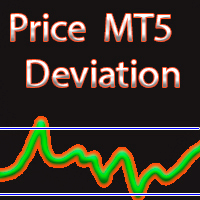
MAからの価格偏差
別ウィンドウの区分には、移動平均の指定値(移動平均)からの価格偏差(%)の値が表示されます。
ポジションの確定と新規ポジションのオープンの両方に使用できます。
入力パラメータ 移動平均を計算するための平均化期間。 平均化方法。 ENUM_MA_METHOD値のいずれかになります。 MODE_SMA - 単純平均 MODE_EMA - 指数平均 MODE_SMMA - 平滑化された平均化 MODE_LWMA - 線形加重平均 中古価格です。 ENUM_APPLIED_PRICE価格定数のいずれかになります。 PRICE_CLOSE - 終値 PRICE_OPEN - 始値 PRICE_HIGH - その期間の最大価格。 PRICE_LOW - 期間の最小価格 PRICE_MEDIAN - 中央値価格(高値+安値)/ 2 PRICE_TYPICAL - 典型的な価格、(高+安+終値)/ 3; PRICE_WEIGHTED - 加重平均価格、(最高+最低+終値+終値)/ 4。

Metatrader 5 version of the famous Andre Machado's Tabajara indicator. If you don't know Andre Machado's Technical Analysis work you don't need this indicator... For those who need it and for those several friend traders who asked this porting from other platforms, here it is...
FEATURES
8-period Moving Average 20-period Moving Average 50-period Moving Average 200-period Moving Average Colored candles according to the inflexion of the 20-period MA
SETTINGS You can change the Period of all M
FREE

This product can be used to synchronize multiple Charts, and each Chart can be set to a different sync mode. With this product you can better view and manipulate charts: different time frames for a single Symbol, the same time frame for multiple Symbols, system indicators for single/multiple Symbols... and more.
Feature: Chart settings can be synchronized, including : background, indentation, size, etc. Multiple Chart window start times or end times can be synchronized. Multiple Chart time f

This is a 100% automated expert advisor based on our custom indicator named "ACB Breakout Arrows" . The entries are based on a breakout pattern that constantly occurs in a bi-directional manner. The intensity of entry signals can be manipulated using the external input called "Signal Sensitivity". MT4 Version is available here https://www.mql5.com/en/market/product/35769
Trades Confirmation
ACB Breakout Arrows EA provides an ability to filter the entries using our another custom indicator n

I see that many tools in the market deal with Position and Order in the form of operation panels. Which is loaded into a Chart in the form of an EA. However, once the operator panel EA is loaded, no other EAs can be loaded. So, I wrote the one-click operation of Position and Order as a script, so you can load other EAs and easily complete one-click operation of Trade. 1. What is this: This is a one-click script to close position order. Now you can close position tickets at high speed, for examp

I see that many tools in the market deal with Position and Order in the form of operation panels. Which is loaded into a Chart in the form of an EA. However, once the operator panel EA is loaded, no other EAs can be loaded. So, I wrote the one-click operation of Position and Order as a script, so you can load other EAs and easily complete one-click operation of Trade. 1. What is this: This is a one-click script to delete the pending order . Now you can delete pending tickets at high speed, for

Swiss CandleTime What ist CandleTime for This indicaor just displays the remaining time for a candle to build. It is best used if you trade with timframes from 3 minutes. I use it in M3 to keep postions. If I have two following red candles i usually liquidate the position. Timeframes M1 to H1 Inputs Arrow displayed => Edit your arrow string Arrow for waiting conditions => Arrow if chart is offline Text Color => color of the text Tell if there is a trend change => tells you, if the two preciding
FREE

An indicator for finding patterns of candles. Through this indicator it is possible to recognize several patterns of candlesticks: hammer, inverted hammer, doji, maximum swallow, minimum swallow and inside bar. The patterns can be found by modifying the values of the indicator parameters. In this way it becomes possible to recognize an infinity of patterns.
How to use: Add the indicator to the chart.
Parameters: [doji -> max body size] represents the maximum body size of the doji (difference

There is a science, named Quantitative Finance, that allows to study the financial derivative pricing models using the methods of theoretical and mathematical physics.
Lately I came across a paper that describes a new indicator for technical analysis that combines ideas from quantum physics and brings them to finance. I got interested in it and decided I would teach how to implement indicators based on a scientific papers in MQL5.
The original Moving Mini-Max paper [2] is written by Z.K. Sila
FREE

We have all seen a currency pair enter the overbought or oversold territory and stay there for long periods of time. What this indicator does is gives you the emphasis. So if you are looking for reversals then you may want to take notice when oversold territory is entered into with a bullish engulfing candle or if the trend is your thing then check for bearish engulfing candles while entering oversold. This indicator will show a downward arrow when it detects a bearish engulfing candle while cro
FREE

A robot that real-time supervise your open position and close it once the price level touches (or is close to touch) a previously selected trendline. You don't have to constantly watch your open position and wait for the proper time to close it. It automatically does this entire process and gives you time to spot new market opportunities. It can be attached to multiple charts and assist multiple open positions at the same time. Setup steps
D raw a trendline on chart (using your mouse) Allow

The Volumebyprice.com Indicator for MetaTrader 5 features Volume Profile and Market Profile TPO (Time Price Opportunity). Volume and TPO histogram bar and line charts. Volume Footprint charts. TPO letter and block marker collapsed and split structure charts. Static, dynamic and flexible range segmentation and compositing methods with relative and absolute visualizations. Session hours filtering and segment concatenation with Market Watch and custom user specifications. Graphical layering, posit

A top-quality implementation of the famous Super Trend indicator, which needs no introduction. It is completely loyal to the original algorithm, and implements many other useful features such as a multi-timeframe dashboard. [ Installation Guide | Update Guide | Troubleshooting | FAQ | All Products ] Easy to trade It implements alerts of all kinds It implements a multi-timeframe dashboard It is non-repainting and non-backpainting Input Parameters
ATR Period - This is the average true range per
FREE

革新的なグリッドアドバイザー。価格のボラティリティに基づいた戦略を適用します。取引は、現在のバーの始値からN分、前のバーの終値からNポイント上昇したときに開始されます。割り当てられた時間内に価格が平均価格ボラティリティ(ATR)のN値(%/ポイント)を超えていない場合、新しいバーが開始されるまで取引は中断されます。
アドバイザリンクのMT4バージョン
ブローカーには見えない動的レベルのストップオーダー、ストップロス、テイクプロフィット、トレーリングストップ、損益分岐点を適用します。値は、ピップで、または平均価格ボラティリティ(ATR)のパーセンテージとして指定できます。
チャートには、注文実行の品質、受け取った利益、現在のオープンポジション(注文数、ロット数、利益)に関する情報が表示されます。 FIFO要件(以前に開いたトランザクションを最初に閉じる要件)を持つ米国のブローカーを含む、あらゆるブローカーとの連携に適しています。
Expert Advisorを初めて知る場合は、ストラテジーテスターでビジュアルモードをオンにすることをお勧めします。トレーダーがその仕事の原

ユニバーサルアドバイザー。スカルパーおよび動的注文グリッドとして機能します。ブローカーには見えないストップオーダー、ストップロス、テイクプロフィット、トレーリングストップを設定するためのレベルを適用します。レベル値は、ピップ単位または平均価格ボラティリティ(ATR)のパーセンテージとして設定できます。それは指定された時間に働くことができ、滑りと広がりの広がりに対する保護を持っています。チャートには、注文実行の品質、受け取った利益、現在のオープンポジション(注文数、ロット数、利益)に関する情報が表示されます。 FIFO要件のある米国のブローカーを含むあらゆるブローカーとの連携に適しています。
Iron TraderEAのMT4バージョン
資金管理: FIX_START_LOT-残高のN個ごとの開始ロットを修正しました(FROM_BALANCE); FROM_BALANCE-開始ロットを計算するためのN残高(FIX_START_LOT); 開始ロットは、次の式を使用して計算されます。残高/ FROM_BALANCE * FIX_START_LOT
例1:
バランス

半自動取引のためのユーティリティ。ストップオーダー、ストップロス、テイクプロフィット、トレーリングストップをブローカーに見えないように設定するための動的レベルを適用します。 FIFO要件のある米国のブローカーを含むあらゆるブローカーとの連携に適しています。
アドバイザリンクのMT4バージョン
取引はボタンまたは線を使用して開くことができます。アドバイザが線に沿ってポジションを開くには、チャートに線を引き、名前を変更します。価格がそれを超えると、EAは対応するコマンドを実行します。
OPEN_SELL-売り注文を開きます CLOSE_SELL-すべての売り注文を閉じます OPEN_BUY-オープンバイオーダー CLOSE_BUY-すべての購入注文を閉じる コマンドが実行された後、コメント「OK」が書き込まれ、行はコマンドを1回だけ実行します。
チャートには、受け取った利益、現在のオープンポジション(注文数、ロット数、利益)、オープニング注文のボタン、実行速度、スリッページに関する情報が表示されます。
オプション: MAGIC_NUMBER-マジックナンバ

魔動MT5はプロの指標のMetaTrader5端子です。
移動平均とは異なり、Magic Movingはより良い信号を提供し、長期的な傾向を特定することができます。
インジケータでは、アラート(アラート、メール、プッシュ)を設定することができますので、単一の取引信号を見逃すことはありません。
インジケータの利点 スキャルピングに最適です。 最小の偽信号を生成します。 初心者や経験豊富なトレーダーに適しています。 すべての時間枠で動作します。 外国為替、CFD、バイナリオプション:任意の金融商品に取り組んでいます。 インジケータは再描画されません。 電子メールやモバイルデバイスへの信号の送信。
推奨シンボル EUR/USD、GBP/USD、AUD/USD、USD/CAD、ゴールド。
使用に関する推奨事項 開買い注文が価格を横切る指標線は上向きになるようにします。 価格が下向きのインジケータラインを横切るときにオープン売り注文。
パラメータ Period -値を増やすとインジケータが遅くなり、信号の品質が向上し、その数が減少します。 減

Modified and updated RSI indicator. Please use arrows on the chart to enter to deals and to exit from deals. The indicator is designed for all currency pairs and time-frames.
Parameters:
PeriodRSI - indicator period;
OpenLevel - level for entering to deals (range diapason 0-100);
CloseLevel - level for exiting from deals (range diapason 0-100);
FlatMode - please enable this trigger in flat mode (i.e. if there are no determined trends).
FREE

The strategy: EA strategy is inspired from a profitable strategy of Mr Rob Hoffman (One of the best traders in the world with multiple prizes on manual trading) . 1.Entry: The EA search for IRB bars (Inventory retracement bar), and place sell pending order or buy pending order according to the trend confirmed by the calculation of a 20 EMA slope degree. We believe that most of IRB Bar are caused by huge institutions (Hedge funds …), so the idea is to take benefits from their very profitable robo
MetaTraderマーケットは、開発者がトレーディングアプリを販売するシンプルで便利なサイトです。
プロダクトを投稿するのをお手伝いし、マーケットのためにプロダクト記載を準備する方法を説明します。マーケットのすべてのアプリは暗号化によって守られ、購入者のコンピュータでしか動作しません。違法なコピーは不可能です。
取引の機会を逃しています。
- 無料取引アプリ
- 8千を超えるシグナルをコピー
- 金融ニュースで金融マーケットを探索
新規登録
ログイン