YouTubeにあるマーケットチュートリアルビデオをご覧ください
ロボットや指標を購入する
仮想ホスティングで
EAを実行
EAを実行
ロボットや指標を購入前にテストする
マーケットで収入を得る
販売のためにプロダクトをプレゼンテーションする方法
MetaTrader 5のための新しいエキスパートアドバイザーとインディケータ - 177
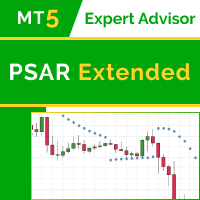
This robot operates based on the Parabolic SAR indicator. Verion for MetaTrader4 here . The advanced EA version includes the following changes and improvements: The EA behavior has been monitored on various account types and in different conditions (fixed/floating spread, ECN/cent accounts, etc.) The EA functionality has been expanded. Features better flexibility and efficiency, better monitoring of open positions. Works on both 4 and 5 digits brokers. The EA does not use martingale, grid or arb

Linear Regressions Convergence Divergence is an oscillator indicator of a directional movement plotted as a difference of two linear regressions with lesser and greater periods. This is a further development of the ideas implemented in the standard MACD oscillator. It has a number of advantages due to the use of linear regressions instead of moving averages. The indicator is displayed in a separate window as a histogram. The signal line is a simple average of the histogram. The histogram value a

このインディケーターはダブルトップとダブルボトムの反転パターンを見つけ、ブレイクアウトを使用して取引シグナルを発生させます。 [ インストールガイド | 更新ガイド | トラブルシューティング | よくある質問 | すべての製品 ]
クリアな取引シグナル カスタマイズ可能な色とサイズ パフォーマンス統計を実装します カスタマイズ可能なフィボナッチリトレースメントレベル 適切なストップロスとテイクプロフィットのレベルを表示します 電子メール/音声/視覚アラートを実装します これらのパターンは拡張でき、インジケーターは再描画によってパターンに追従します。ただし、インジケーターはトレードを容易にするためにツイストを実装します。トレードをシグナルする前に正しい方向へのドンチャンブレイクアウトを待機し、シグナルを非常に信頼性が高く、ほとんど再描画しません。
入力パラメータ
振幅:振幅は、代替価格ポイント間のバーの最小量を表します。大きなパターンを見つけるには、振幅パラメーターを大きくします。小さなパターンを見つけるには、振幅パラメーターを小さくします。 最小リトレースメント:

No grid! No martingale! No manual configuration or adjustment needed! Every trade is protected by stop loss. You can find metatrader4 version here: https://www.mql5.com/de/market/product/18571# This Expert Advisor only trades for a short time frame at night, during the ending of the New York session. It uses low volatility moments in EURUSD and enters trades based on indicators. It then manages those trades with dynamic stop losses and take profits also based on indicators. A safety mode further

The Grab indicator combines the features of both trend indicators and oscillators. This indicator is a convenient tool for detecting short-term market cycles and identifying overbought and oversold levels. A long position can be opened when the indicator starts leaving the oversold area and breaks the zero level from below. A short position can be opened when the indicator starts leaving the overbought area and breaks the zero level from above. An opposite signal of the indicator can be used for

The indicator plots charts of profit taken at the Close of candles for closed (or partially closed) long and short positions individually. The indicator allows to filter deals by the current symbol, specified expert ID (magic number) and the presence (absence) of a substring in a deal comment, to set the start time and the periodicity of profit reset (daily, weekly or monthly) to calculate the profit chart. The indicator also displays the floating (not fixed) profit of the opened positions at th

The Close script is a simple tool that allows traders to close their trades by three methods. Just run the script and choose the close method.
Closing methods Symbol - Allows closing all open trades for a specific symbol. All_Trades - Allows closing all open trades. Magic_Number - Allows closing all open trades according to their magic number. Recommendation AutoTrading functions must be activated. If the AutoTrading function is disabled, the script will not work. EA should be stopped
FREE

The Regression Momentum is an indicator of directional movement, built as the relative difference between the linear regression at the current moment and n bars ago. The indicator displays the calculated Momentum in a separate window as a histogram. The signal line is a simple average of the histogram. The histogram value above 0 indicates an uptrend. The higher the value, the stronger the trend. A value below 0 indicates a downtrend. The lower the value, the stronger the downtrend. Intersection

This indicator calculates and displays Murrey Math Lines on the chart. This MT5 version is similar to the МТ4 version: It allows you to plot up to 4 octaves, inclusive, using data from different time frames, which enables you to assess the correlation between trends and investment horizons of different lengths. In contrast to the МТ4 version, this one automatically selects an algorithm to search for the base for range calculation. You can get the values of the levels by using the iCustom() funct

The Equity Curve indicator is a simple and helpful tool that shows the development of the equity curve in real time. For precision measurement, it should be used in a separate window with a period of M1.
Main features The indicator shows the development of the equity curve in real time. High precision on the minute chart. High-speed calculation. Available for MT4 and MT5. Please visit the Equity Curve indicator product page for the input and output parameters settings.
FREE

The indicator displays in a separate window a price chart as Heiken Ashi candlesticks with a periodicity below a minute. Available periods (seconds): 30, 20, 15, 12, 10, 6, 5, 4, 3, 2, 1. It is possible to select the base price for calculations.
Parameters Time frames - the period of candlesticks in seconds. Price levels count - the number of price levels on a chart. Applied price - the price used in calculations. Buffer number: 0 - Heiken Ashi Open, 1 - Heiken Ashi High, 2 - Heiken Ashi Low,
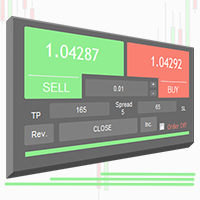
MB Trading Panel is a simple, efficient and intuitive graphic tool that provides a couple of controls to open, close and manage all your orders in MetaTrader 5. Hotkeys, trailing stop, manual and automatic breakeven, reverse, increase position and others features for scalping, make this EA a great graphic pack for your daily work as trader. Below all hotkeys and functionalities from the EA: ' -Help 1 - Allow order send. 2 - Enable trailing stop. 3 - Select trailing stop classic mode. 4 - Select
FREE

An analogue of the Stochastic oscillator based on algorithms of singular spectrum analysis (SSA) SSA is an effective method to handle non-stationary time series with unknown internal structure. It is used for determining the main components (trend, seasonal and wave fluctuations), smoothing and noise reduction. The method allows finding previously unknown series periods and make forecasts on the basis of the detected periodic patterns. Indicator signals are identical to signals of the original i
FREE

RSI Sniper EA is fully automated EA and handles two strategies at same time with its unique style. This Ea use RSI indicator and martingale strategies in MetaTrader 5 Terminal. The default settings are just place holders and not necessarily the best. Use the settings that best suites you or your strategy. OpenBUY - Set to true to allow buy trades. This setting is true by default. OpenSELL - Set to true to allow sell trades. This setting is true by default. StartTakeProfit - take profit value for
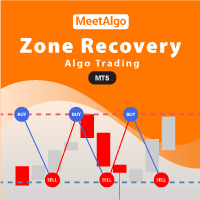
CAP Zone Recovery EA MT4 is your tool to turn losing trades into winning trades by using a smart "back-and-forth" hedging mechanism. Let the price move to anywhere it likes - the awesome CAP Zone Recovery EA will make profits out of the situation. The secret behind this amazing EA is a famous trading algorithm known as "Zone recovery algorithm" or "The Surefire Forex Hedging Strategy".
CAP Zone Recovery EA MT4 is extremely easy to use. You just open a trade in a trending market - no matter w

CMTX EA is a versatile trading tool that leverages Moving Averages (MAs) to generate signals and manage trades. Designed for both trending and ranging markets, this EA opens positions when two MAs cross and strategically manages those positions for optimized outcomes. Key Features: Trade Direction Options : Configure the EA to trade in one direction or both simultaneously. Lot & Risk Management : Choose between fixed or dynamic lot sizing. Smart lot sizing adjusts based on account balance. Confi

The indicator determines the inside bar and marks its High/Low. It is plotted based on the closed candles (does not redraw). The identified inside bar can be displayed on the smaller periods. You may set a higher period (to search for the inside bar) and analyze on a smaller one. Also you can see the levels for Mother bar.
Indicator Parameters Period to find Inside Bar — the period to search for the inside bar. If a specific period is set, the search will be performed in that period. Type of i

インジケーターは、可能な限り最小のラグで 再描画せず にチャートに高調波パターンを表示します。インディケータトップの検索は、価格分析の波動原理に基づいています。 詳細設定では、取引スタイルのパラメータを選択できます。ろうそく(バー)のオープニングで、新しいパターンが形成されると、価格変動の可能性のある方向の矢印が固定され、変更されません。 インジケーターは、次のパターンとその種類を認識します:ABCD、Gartley(Butterfly、Crab、Bat)、3Drives、5-0、Batman、SHS、One2One、Camel、Triangles、WXY、Fibo、Vibrations。デフォルトでは、ABCDとGartleyの数字のみが設定に表示されます。多くの追加の構成可能なパラメーター。 主なパラメータ: ShowUpDnArrows-予想される方向矢印を表示/非表示 ArrowUpCode-上矢印コード ArrowDnCode-下矢印コード Show old history patterns-古いパターンの表示を有効/無効にします Enable alert messages,

AIS 正しい平均インジケーターを使用すると、市場でのトレンドの動きの始まりを設定できます。インジケーターのもう 1 つの重要な品質は、トレンドの終わりの明確なシグナルです。指標は再描画または再計算されません。
表示値 h_AE - AE チャネルの上限
l_AE - AE チャンネルの下限
h_EC - 現在のバーの高予測値
l_EC - 現在のバーの低い予測値
インジケーターを操作するときのシグナル 主な信号は、チャネル AE と EC の交差点です。
l_EC ラインが h_AE ラインより上にある場合、上昇トレンドが始まる可能性があります。
h_EC ラインが l_AE ラインを下回った後、下降トレンドの始まりが予想されます。
この場合、h_AE ラインと l_AE ラインの間のチャネル幅に注意する必要があります。両者の差が大きければ大きいほど、トレンドは強くなります。 AEチャンネルによる局所的な高値・安値の達成にも注意が必要です。この時、価格変動のトレンドが最も強くなります。
カスタマイズ可能な指標パラメータ インディケータを設定するに
如果产品有任何问题或者您需要在此产品上添加功能,请联系我 Contact/message me if you encounter any issue using the product or need extra feature to add on the base version.
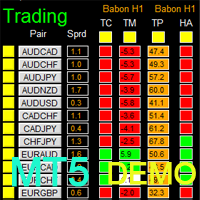
Dashboard Babon Scalping System MT5 Demo is the demo version of Dashboard Babon Scalping System MT5, which has full functionalities of the paid version, except TDI Cross, TDI Momentum, TDI Price are not available Slope and Ichimoku are not available Only 5 pairs are included in demo version Full version: LINK MT4 version: LINK This system basically util
FREE
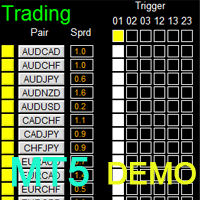
Dashboard Super Three MA MT5 Demo is the demo version of Dashboard Super Three MA MT5 , which has full functionalities of the paid version, except MA Time-frame is fixed at M5 Filter Single is not available Full version: LINK MT4 version: LINK This system basically utilizes PA and three adjustable Moving Average as the main indicator set to generate trading signal. With the feature that all MA_timeframe, MA_period, MA_applied_price are adjustable, you can easily create almost any Moving Average
FREE
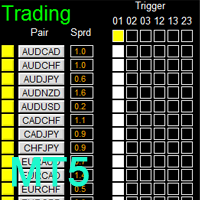
如果产品有任何问题或者您需要在此产品上添加功能,请联系我 Contact/message me if you encounter any issue using the product or need extra feature to add on the base version.
There is Demo version of this panel Dashboard Super Three MA MT5 Demo in my product list, please try it out to get familiar with all functionalities for free Free version: LINK MT4 version: LINK This system basically utilizes PA and three adjustable Moving Average as the main indicator set to generate trading signal. With the feature that all MA_timefra
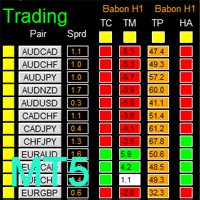
如果产品有任何问题或者您需要在此产品上添加功能,请联系我 Contact/message me if you encounter any issue using the product or need extra feature to add on the base version.
There is Demo version of this panel Dashboard Babon Scalping System MT5 Demo in my product list, please try it out to get familiar with all functionalities for free. Free version: LINK MT4 version: LINK This system basically utilizes TDI, Heiken Ashi Trend, Price Trend on H1 time-frame and TMA on H1&H4 time-frame to generate the trend (big picture). The
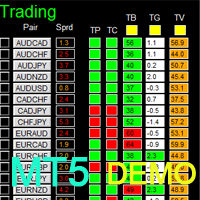
Dashboard Timeframe 15 MT5 Demo is the demo version of Dashboard Timeframe 15 MT5 , which has full functionalities of the paid version, except TDI Base, TDI Price, and Round Number filter is not available. Time-frame is fixed at M5 Full version: LINK MT4 version: LINK
This system basically utilizes TDI as the core indicator to generate trading signal mainly on time-frame M15. The signal will be further filtered and trimmed by 1) 200 EMA and Price; 2) 10 EMA and Heiken Ashi Candle; 3) Round num
FREE
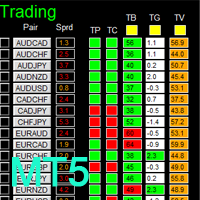
如果产品有任何问题或者您需要在此产品上添加功能,请联系我 Contact/message me if you encounter any issue using the product or need extra feature to add on the base version.
There is Demo version of this panel Dashboard Timeframe 15 MT5 Demo in my product list, please try it out to get familiar with all functionalities free. Free version: LINK MT4 version: LINK This system basically utilizes TDI as the core indicator to generate trading signal mainly on time-frame M15. The signal will be further filtered and trimmed by 1) 2
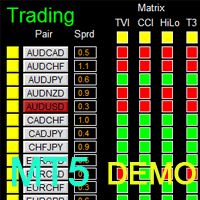
如果产品有任何问题或者您需要在此产品上添加功能,请联系我 Contact/message me if you encounter any issue using the product or need extra feature to add on the base version.
Dashboard Genesis Matrix Trading MT5 Demo is the demo version of Dashboard Genesis Matrix Trading MT5 , which has full functionalities of the paid version, except EMA5_HA is not available Stochastic 2 is not available Stochastic 1 time-frame is fixed at M5 TVI is not available DB_timeframe is fixed at M5 Send alert function is not available Sent notific
FREE
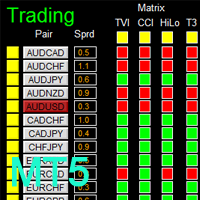
如果产品有任何问题或者您需要在此产品上添加功能,请联系我 Contact/message me if you encounter any issue using the product or need extra feature to add on the base version.
There is Demo version of this panel Dashboard Genesis Matrix Trading MT5 Demo in my product list, please try it out to get familiar with all functionalities for free. Free version: LINK MT4 version: LINK This system basically utilizes Genesis Indi Set (TVI, CCI, GannHilo, and T3) as the core indicators to generate trading signal mainly on time-frame M15
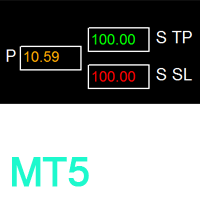
如果产品有任何问题或者您需要在此产品上添加功能,请联系我 Contact/message me if you encounter any issue using the product or need extra feature to add on the base version.
Session TakeProfit StopLoss is basically helping to set the take profit and stop loss in dollar for the total open orders (session). Once the total profit is greater than session_tp or less than session_sl, the EA will help to close all open orders acting similarly to a take profit/stop loss for a single order.
Inputs session_tp: session take profit s
FREE

Was: $299 Now: $99 Supply Demand uses previous price action to identify potential imbalances between buyers and sellers. The key is to identify the better odds zones, not just the untouched ones. Blahtech Supply Demand indicator delivers functionality previously unavailable on any trading platform. This 4-in-1 indicator not only highlights the higher probability zones using a multi-criteria strength engine, but also combines it with multi-timeframe trend analysis, previously confirmed swings

Was: $249 Now: $99 Market Profile defines a number of day types that can help the trader to determine market behaviour. A key feature is the Value Area, representing the range of price action where 70% of trading took place. Understanding the Value Area can give traders valuable insight into market direction and establish the higher odds trade. It is an excellent addition to any system you may be using. Inspired by Jim Dalton’s book “Mind Over Markets”, this indicator is designed to suit the

Was: $99 Now: $34 Blahtech Daily Range indicator displays the average daily range alongside the individual session ranges. Using the daily open price as a reference the indicator shows fixed range and dynamic range targets as lines on the charts. These lines clearly show when the average range has been exhausted. Daily and session ranges can be useful for confirming entries or setting targets and is an excellent odds enhancer for many trading systems. Links [ Documentation | Install |

Addition to the standard Relative Strength Index (RSI) indicator, which allows to configure various notifications about the events related with the indicator. For those who don't know what this indicator is useful for, read here . This version is for MetaTrader 5, MetaTrader 4 version - here . Currently implemented events: Crossing from top to bottom - of the upper signal level (default - 70) - sell signal. Crossing from bottom to top - of the upper signal level (default - 70) - sell signal. Cro
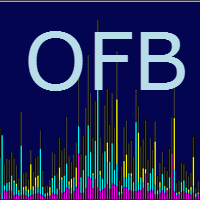
Order Flow Balance is a powerful indicator for Tape Reading (Time & Sales). It helps you analysis Order Flow Market, find where the players are moving in, market imbalance, possible reversal points and much more! The indicator works on MOEX, BM&FBOVESPA, CME, etc. It has 5 different indicator types Cumulative Delta: Also know as Cumulative Volume Delta, it is an advanced volume analysis method where traders can see the daily difference between aggressive buyers and aggressive sellers. Comparison

It is the MQL5 version of zero lag MACD that was available for MT4 here: https://www.mql5.com/en/code/9993 Also there was a colored version of it here but it had some problems: https://www.mql5.com/en/code/8703 I fixed the MT4 version which has 95 lines of code. It took me 5 days to write the MT5 version.(reading the logs and testing multiple times and finding out the difference of MT5 and MT4!) My first MQL5 version of this indicator had 400 lines of code but I optimized my own code again and n
FREE
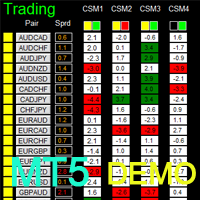
如果产品有任何问题或者您需要在此产品上添加功能,请联系我 Contact/message me if you encounter any issue using the product or need extra feature to add on the base version.
Dashboard Currency Strength Advanced MT5 Demo is the demo version of Dashboard Currency Strength Advanced MT5 , which have full functionalities of the paid version, except Only 2 currency strength meter with time-frame D1 will be used for signal generation (full version has 4 currency strength meters with full time-frame selection) Full version: LINK MT
FREE
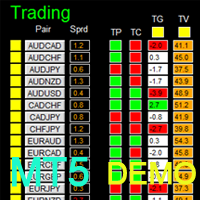
For full version of this panel Dashboard Trading Made Simple, please re-direct to LINK . It has full functionalities of the paid version, except Demo version only works on W1 time-frame, full version has option for all time-frame Stochastic is not available in demo version, it displays data but not works as filter. TDI momentum indicator is not available in demo version, it displays data but not works as filter. The Alert and send notification function is not available in demo version. The HA re
FREE
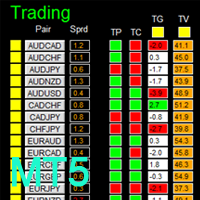
如果产品有任何问题或者您需要在此产品上添加功能,请联系我 Contact/message me if you encounter any issue using the product or need extra feature to add on the base version.
There is a demo version of this panel Dashboard Trading Made Simple Demo in my product list, please try it out to get familiar with all functionalities free, LINK . This system basically utilizes TDI as the main indicator to generate trading signal mainly on H1 and H4 time-frame. The signal will be further filtered and trimmed.
Stochastic; Heiken Ashi
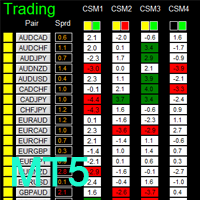
如果产品有任何问题或者您需要在此产品上添加功能,请联系我 Contact/message me if you encounter any issue using the product or need extra feature to add on the base version.
There is a Demo version of this panel Dashboard Currency Strength Advanced MT5 Demo in my product list, please try it out to get familiar with all functionalities for free, Free version: LINK . MT4 version: LINK
The Dashboard Currency Strength Meter Advanced gives you a quick visual guide to which currencies are strong, and which ones are weak over th
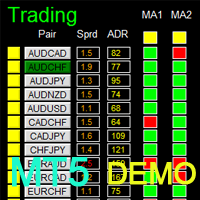
Dashboard Super MA RSI CCI Demo is the demo version of Dashboard Super MA RSI CCI, which have full functionalities of the paid version, except Timeframe of MA1, MA2, RSI, and CCI has been fixed to be TF_MA1=M30, TF_MA2=H1, TF_RSI=M30, TF_CCI=M30 (full version has ability to adjust/select full range timeframe for MA1, MA2, RSI, and CCI). To access the full version, please re-direct to this LINK . Dashboard Super MA RSI CCI is an intuitive and handy graphic tool to help you to: Have 28 pairs under
FREE
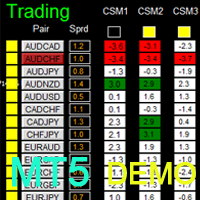
如果产品有任何问题或者您需要在此产品上添加功能,请联系我 Contact/message me if you encounter any issue using the product or need extra feature to add on the base version.
Dashboard Super Currency Strength MT5 Demo is the demo version of Dashboard Super Currency Strength MT5 , which has full functionalities of the paid version, except only 1 currency strength meter with time-frame of M30 and H1 will be used for signal generation (full version has 3 currency strength meters with full timeframe selection). Full version: LIN
FREE
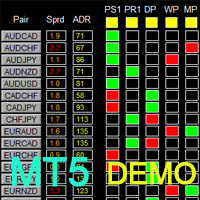
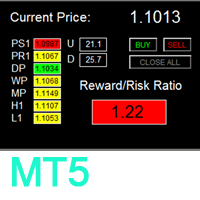
To access the full version, please re-direct to this LINK . To access the single pair version, please re-direct to this LINK . Dashboard Super Risk Reward PanelMT5Demo is the demo version of Dashboard Super Risk Reward Panel MT5, which have full functionalities of the paid version, except Only two support/resistance levels (Daily Pivot and Weekly Pivot) are available for RR ratio calculation Sell button is disabled
Features User is able to select support and resistance levels for RR ratio gene
FREE

The indicator displays a matrix of indicators across multiple timeframes with a sum total and optional alert. Custom indicators can also be added to the matrix, in a highly configurable way. The alert threshold can be set to say what percentage of indicators need to be in agreement for an alert to happen. The alerts can turned on/off via on chart tick boxes and can be set to notify to mobile or sent to email, in addition to pop-up. The product offers a great way to create an alert when multiple
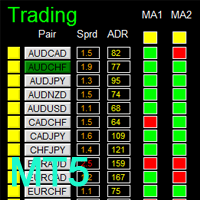
如果产品有任何问题或者您需要在此产品上添加功能,请联系我 Contact/message me if you encounter any issue using the product or need extra feature to add on the base version.
There is Demo version of this panel Dashboard Super MA RSI CCI Demo in my product list, please try it out to get familiar with all functionalities for free, LINK . Dashboard Super MA RSI CCI is an intuitive and handy graphic tool to help you to: Have 28 pairs under control with one dashboard Monitor price movement, identify possible trend based on MA, R
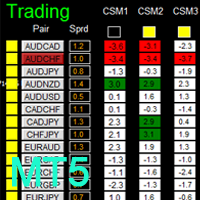
如果产品有任何问题或者您需要在此产品上添加功能,请联系我 Contact/message me if you encounter any issue using the product or need extra feature to add on the base version.
There is Demo version of this panel Dashboard Timeframe 15 Demo in my product list, please try it out to get familiar with all functionalities free, LINK . This system basically utilizes TDI as the core indicator to generate trading signal mainly on time-frame M15. The signal will be further filtered and trimmed by 1) 200 EMA and Price; 2) 10 EMA and
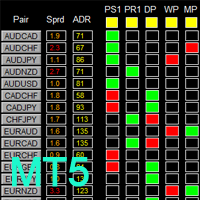
如果产品有任何问题或者您需要在此产品上添加功能,请联系我 Contact/message me if you encounter any issue using the product or need extra feature to add on the base version.
To access the free demo version, please re-direct to this LINK . To access the single pair version, please re-direct to this LINK . There are two critical components in a profitable trading system, one is entry (place an order), and another one is exit (close an order). You can exit by time: closing order after London Close for example. You can also exi
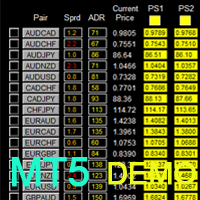
提供专业的EA编程服务,推出特色仪表盘EA编程,将您的交易策略自动化,可视化,一个图表管理多个交易货币对,详情查看: http://www.ex4gzs.com Providing quick Developments and Conversion of MT4/MT5 EAs, Indicators, Scripts, and Tools. If you are looking for an Dashboard EA to turn your trading strategy into auto trading algo and to manage multi trades in one chart with visualizing tool, come and visit http://www.ex4gzs.com/en for more details. 如果产品有任何问题或者您需要在此产品上添加功能,请联系我 Contact/message me if you encounter any issue using the product or need extra featur
FREE
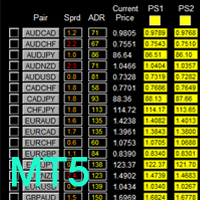
如果产品有任何问题或者您需要在此产品上添加功能,请联系我 Contact/message me if you encounter any issue using the product or need extra feature to add on the base version.
To access the free demo version, please re-direct to this LINK . To access the single pair version, please re-direct to this LINK . Price is likely to pullback or breakout at important support and/or resistance. This dashboard is designed to help you monitor these critical support and resistance area. Once price moves close to these important support an

Linear Regression Angle is a directional movement indicator which defines a trend at the moment of its birth, and additionally defines trend weakening. The indicator calculates the angle of the linear regression channel and displays it in a separate window in the form of histogram. The signal line is a simple average of the angle. The angle is the difference between the right and left edges of regression (in points), divided by its period. The angle value above 0 indicates an uptrend. The higher

xCalper Economic Calendar brings economic calendar information to your Terminal chart and Experts from online sources. Just add it to your chart to see detailed news without losing attention or automate reading of calendar information to improve trading decisions.
Main Features Support data sources: Forex Factory. Filtering by day, impact or currency of news. Visual alert of upcoming news. Platform notification of upcoming news.
Parameters Filters Impact expected - Show/Hide by impact: Low,
FREE
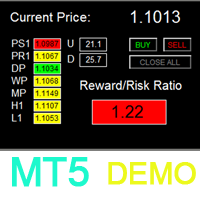
如果产品有任何问题或者您需要在此产品上添加功能,请联系我 Contact/message me if you encounter any issue using the product or need extra feature to add on the base version.
To access the full version, please re-direct to this LINK . To access the dashboard version, please re-direct to this LINK . Dashboard Super Exit Demo is the demo version of Dashboard Super Exit, which have full functionalities of the paid version, except Only two support/resistance levels (Daily Pivot and Weekly Pivot) are available for RR ratio calcul
FREE
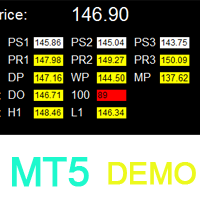
如果产品有任何问题或者您需要在此产品上添加功能,请联系我 Contact/message me if you encounter any issue using the product or need extra feature to add on the base version.
To access the full version, please re-direct to this LINK . To access the dashboard version, please re-direct to this LINK . Critical Support and Resistance Demo is the demo version of Critical Support and Resistance which have full functionalities of the paid version, except only Pivot R1/R2/R3 and Daily Open will be triggered for alert and/or notifica
FREE
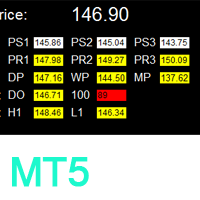
如果产品有任何问题或者您需要在此产品上添加功能,请联系我 Contact/message me if you encounter any issue using the product or need extra feature to add on the base version.
To access the free demo version, please re-direct to this LINK . To access the dashboard version, please re-direct to this LINK . Critical Support and Resistance is an intuitive, and handy graphic tool to help you to monitor and manage critical support and resistance price point easily with one glance to know status of all important S&R. Price is likely
如果产品有任何问题或者您需要在此产品上添加功能,请联系我 Contact/message me if you encounter any issue using the product or need extra feature to add on the base version.
To access the free demo version, please re-direct to this LINK . To access the dashboard version, please re-direct to this LINK . There are two critical components in a profitable trading system. One is entry (placing an order) and another one is exit (closing an order). You can exit by time: closing order after London Close, for example. You can also e

Multi-timeframe indicator Relative Strength Index displays information simultaneously from different periods in one subwindow of the chart.
Parameters Period of averaging — averaging period for the RSI calculation. Type of price — price used. Timeframes for RSI — list of periods, separated by a space or comma or semicolon. Number of bars for each period — the number of bars displayed for each period. Sort periods — sort periods if they are listed in no particular order. Current period first —
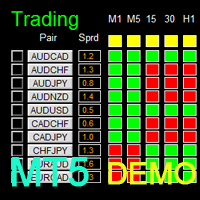
Dashboard Super Candle Demo is the demo version of Dashboard Super Candle, which have full functionalities of the paid version, except Only candle of M5, M30 and H4 will be used for signal generation (full version has candle of all timeframe). To access the full version, please re-direct to this LINK . Dashboard Super Candle is an intuitive and handy graphic tool to help you to: Have 28 pairs under control with one dashboard. Monitor candle direction; identify possible price movement and trend.
FREE
如果产品有任何问题或者您需要在此产品上添加功能,请联系我 Contact/message me if you encounter any issue using the product or need extra feature to add on the base version.
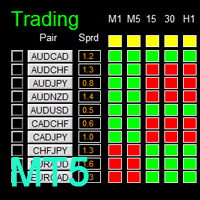
There is Demo version of this panel Dashboard Super Candle DEMO in my product list, please try it out to get familiar with all functionalities for free, LINK . Dashboard Super Candle gives you a quick visual guide to which pair’s short-term, medium-term, and long-term direction/trend are aligned. With the combination of these trend, you are able to moni

如果产品有任何问题或者您需要在此产品上添加功能,请联系我 Contact/message me if you encounter any issue using the product or need extra feature to add on the base version.
PA Touching Alert is a tool to free you from watching price to touch certain critical price levels all day alone. With this tool, you can set two price levels: upper price and lower price, which should be greater than/less than the current price respectively. Then once price touches the upper price or lower price, alert and/or notification would be sent
FREE

如果产品有任何问题或者您需要在此产品上添加功能,请联系我 Contact/message me if you encounter any issue using the product or need extra feature to add on the base version.
Floating Highest Lowest MT5 provides you an intuitive and user-friendly method to monitor the floating highest (profit) and lowest (loss) that all your trades together ever arrive. For example, I opened 3 orders, which arrived at $4.71 floating profit when trade following trend. Later when the trend is against me, these 3 orders arrive $30 in loss, and
FREE

Stochastic Oscillator displays information simultaneously from different periods in one subwindow of the chart.
Parameters %K Period — K-period (number of bars for calculations). %D Period — D-period (period of first smoothing). Slowing — final smoothing. Method — type of smoothing. Price field — stochastic calculation method . Timeframes for Stochastic — list of periods, separated by a space or comma or semicolon. Number of bars for each period — the number of bars displayed for each period.

Multi-timeframe indicator Commodity Channel Index displays information simultaneously from different periods in one subwindow of the chart.
Parameters Period of averaging — averaging period for the CCI calculation. Type of price — price used. Timeframes for CCI — list of periods, separated by a space or comma or semicolon. Number of bars for each period — the number of bars displayed for each period. Sort periods — sort periods if they are listed in no particular order. Current period first —

The Moving Averages Convergence/Divergence indicator displays information simultaneously from different periods in one subwindow of the chart.
Parameters Fast EMA — period for Fast average calculation. Slow EMA — period for Slow average calculation. MACD SMA — period for their difference averaging. Type of price — price used. Timeframes for MACD — list of periods, separated by a space or comma or semicolon. Number of bars for each period — the number of bars displayed for each period. Sort per
如果产品有任何问题或者您需要在此产品上添加功能,请联系我 Contact/message me if you encounter any issue using the product or need extra feature to add on the base version.
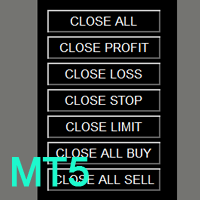
You can get the free Close Button MT4 version at LINK . Close Button provides you an intuitive, effective, and handy way to close your orders and/or positions based on their type and their profit status. The tool provides seven close options: Close All: close all pending orders and positions. Close Profit: close all positions which are in profit. Close
FREE
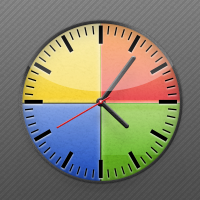
The new product Time IV (2013) is an updated version of Time III introduced earlier in the Market. The indicator displays the work time of world marketplaces in a separate window in a convenient way. The indicator is based on the TIME II (VBO) indicator rewritten in MQL5 from a scratch. The new version Time IV is a higher quality level product. Comparing to Time III it consumes less resources and has optimized code. The indicator works on Н1 and lower timeframes.
Adjustable parameters of the i
DSignal for "Brent" is a new indicator for buying and selling in MetaTrader 5. This is a simple indicator that shows market entry points. Perfect for both beginners and professionals. Recommended time frame is H1. Recommended financial instrument for trading is Brent oil. Work with 4-digit and 5-digit quotes. Never repaints signal.
Features A market entry is possible at the close of H1 candlestick if the indicator draws an arrow (sell when crimson, buy when blue). Never repaints signal. Indica

Monitoring: https://www.mql5.com/en/signals/author/yarkan
Features Works only with Hedge accounts Does not use Take Profit, fixed Stop Loss Applies trailing stop Trades from overbought/oversold levels (uses WPR) Analyzes each market tick (select "Every tick based on real ticks" mode when testing) All positions are closed only by Trailing Stop
Recommendations Deposit: $500 or more (the larger, the better) Symbol: EURUSD (with five-digit quotes) Timeframe: M1
Parameters Period - WPR indicato
The utility (Expert Advisor) is designed for monitoring and controlling the total drawdown, as well as closing all positions after reaching the specified levels or upon the occurrence of a specified time with the ability to disable the operation of the automatic EAs running in the same terminal. It is capable of tracking the status of the entire account, as well as individual pairs. It works with the positions opened manually or by other automatic EAs. It tracks the open trades in real time mode
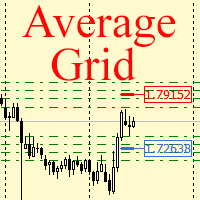
For any number of placed market and pending orders, the utility calculates the "breakeven level" - weighted average price. The calculation is performed individually for buy and sell orders. The weighted average price is marked with a label and colored horizontal line separately as well - one line for the buy price, and the other for sell price.
Input Parameters: Include pending. Include the pending orders in calculation. The default value of this parameter is false, and the calculation of the
FREE

This indicator shows the value of returns in the selected time frame
They are calculated as logarithm of returns , rather than price or raw returns. For small returns, arithmetic and logarithmic returns will be similar. The benefit of using returns, versus prices, is normalization. It is possible measures all variables in a comparable metric despite originating from price series of unequal values
Inputs You can display data both as a Histogram or a Line It's also possible to display the
FREE

Multicurrency scalper, works at night time, performing short trades during low volatility. For trading to be profitable, a broker with low night spreads is required. Working timeframe: M15 Working on a real account:
Type2 https://www.mql5.com/en/signals/245053 Mix https://www.mql5.com/en/signals/363093 Settings - in the description of the signal Installation instruction: https://www.mql5.com/ru/blogs/post/721443
Input parameters MagicNumber – magic number, identification number for a symb

The indicator calculates the inclination angle between the Highs, Lows and Closes of adjacent bars. The angle can be measured in degrees or radians. A linear graph or a histogram is drawn in a subwindow. You can set the scale for the calculation — floating or fixed. For use in Expert Advisors or indicators, you need to specify a fixed scale.
Parameters Angular measure — degrees or radians. Scale mode for calculation — scaling mode. Free scale — free transformation, the indicator will calculate
FREE
MetaTraderマーケットは自動売買ロボットとテクニカル指標を販売するための最もいい場所です。
魅力的なデザインと説明を備えたMetaTraderプラットフォーム用アプリを開発するだけでいいのです。マーケットでプロダクトをパブリッシュして何百万ものMetaTraderユーザーに提供する方法をご覧ください。
取引の機会を逃しています。
- 無料取引アプリ
- 8千を超えるシグナルをコピー
- 金融ニュースで金融マーケットを探索
新規登録
ログイン