Смотри обучающее видео по маркету на YouTube
Как купить торгового робота или индикатор
Запусти робота на
виртуальном хостинге
виртуальном хостинге
Протестируй индикатор/робота перед покупкой
Хочешь зарабатывать в Маркете?
Как подать продукт, чтобы его покупали
Новые торговые роботы и индикаторы для MetaTrader 5 - 160

Thermo MAP is a multicurrency and multitimeframe indicator that display a smart heat map based on proprietary calculations. Watch how Forex market moved and is currently moving with a single dashboard and have a consistent and good idea of what is happening!
It can be suitable for both scalping or medium/long term, just select options that better fit your trading style Symbols list are automatically sorted based on the preferred column. There is the possibility to click on: First row, timefram
FREE

Institutional Levels is an intelligent, fully automated Expert Advisor. This algo is arranged in such a way that the EA uses levels of importance combined with price action, without reliance on indicators. The strategy behind it is based on the teachings of a professional traders, and ex traders. It will find untested levels at which institutions are known to be interested in, in the number of candles you’ve set and will make trades based on these levels, re-test and trend. It will automaticall

The Rise: It is an advanced trading system. This is a fully automatic Expert Advisor, which allows you to presize the trade according to the preferences of the trade.
Is a revolution in the customization of the trading. The Rise is a expert advisor based in the indicator The Rise of Sky walker: ( https://www.mql5.com/es/market/product/44511 ) This system uses operations groups, which always beat the market
You can download the demo and test it yourself.
Very stable

Работа эксперта Bamboo expert основана на сигналах пользовательского индикатора Bamboo . Точки входа в рынок определяются по значениям индикатора Bamboo. Закрытие позиции происходит при достижении заданных уровней прибыли и убытка или при появлении противоположного сигнала, если значения Stop Loss и Take Profit равны нулю. Входные параметры Period - входной параметр Period индикатора Bamboo; Mode - режим работы эксперта (0-7); Stop Loss - уровень фиксации убытка в пунктах; Take Profit - уровень
FREE

Hello all friends What I will present today is a grid system that doesn't have grid. Its work is Open to buy and sell at the same time. Or choose to open either side in the settings. The weakness of this system is that when the graph runs one way for a long time, it is very damaged. I have prepared a function for reducing damage.Details about how to set up according to the youtube link.

Stop Loss with Profit
Free Version*.
Complete Version here.
This utility / expert for MetaTrader 5 modifies the stop loss of all your operations dynamically and automatically to ensure the minimum benefits you want, and be able to operate with or without Take Profit.
Maximize your benefits, by being able to trade with Unlimited Take Profit. You will ensure the number of minimum points you want to earn in each operation and the stop loss will be adjusted as long as the benefit of the oper
FREE

Stop Loss with Profit
This utility / expert for MetaTrader 5 modifies the stop loss of all your operations dynamically and automatically to ensure the minimum benefits you want, and be able to operate with or without Take Profit.
Maximize your benefits, by being able to trade with Unlimited Take Profit. You will ensure the number of minimum points you want to earn in each operation and the stop loss will be adjusted as long as the benefit of the operation grows.
For example: you open a pur

The DYJ Moving Average Cross is a unique High quality and easy to use and affordable trading tool because we have incorporated a number of proprietary features and Moving Average indicators. The Indicator is based on the following idea: crossing of two Moving Average lines (Fast and slow ) is used as a signal for opening and closing a position together. Go Long when Fast MA (MA1) crosses above Slow MA (MA2). Go Short when Fast MA (MA1) crosses below Slow MA (MA2). The EA uses dynamic alloca

Ondas de Divergência. Antes do mercado tomar um sentido e se manter em tendencia, existem sinais que podem ser lidos, nos permitindo assim entender o "lado mas forte", e realizar trades de maior probabilidade de acerto com risco reduzido, esses movimentos são persistentes e contínuos, proporcionando excelente rentabilidade. Ondas de Divergência é um histograma que acumula a divergência de entre preço e volume a cada tick, permitindo assim encontrar pontos de absorção, áreas de acumulo e distrib

The DYJ ThreeMACross is based on three Moving Average indicators. ThreeMACross is based on the following idea: crossing of three Moving Average lines (Fast, Middle and slow ones) is used as a signal for opening and closing a position together. Go Long when Fast MA (MA1) crosses above Middle MA (MA2), and Middle MA (MA2) crosses above Slow MA (MA3). Go Short when Fast MA (MA1) crosses below Middle MA (MA2), and Middle MA (MA2) crosses below Slow MA (MA3). The Expert Advisor also features money m
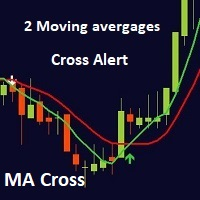
MA cross ALERT MT5 This indicator is a full 2 moving averages cross Alert ( email and push notification "mobile" ), 2 MA with full control of MA method and applied price for each moving average "slow and fast", -simple, exponential, smoothed, linear weighted. - close, open, high, low, median price, typical price, weighted price. you can modify periods as well for both MA. For any suggestions don't hesitate, thanks
Boleta de negociação, adiciona automáticamente as ordens Take Profit e Stop Loss quando excutada uma ordem de compra ou venda. Ao apertar as teclas de atalho (A, D, ou TAB), serão inseridas duas linhas de pre-visualização, representando as futuras ordens de take profit (azul) e stop loss (vermelho), as quais irão manter o distanciamento especificado pelo usuário. Ditas ordens só serão adicionadas ao ser executada a ordem inicial. Ao operar a mercado, as ordens pendentes de take profit, e stop lo

Orca EA ΜT5 - полностью автоматический советник. Его продвинутый алгоритм, основанный на ценовом действии, пытается предсказать направление следующей свечи и открывает (или не открывает) соответствующую сделку. Он имеет уникальное количество настроек, которые делают его чрезвычайно универсальным в любых рыночных условиях. Orca EA ΜΤ5 поставляется с установленными файлами на 2022 год, специально оптимизированными для учетных записей ECN Raw Spread ICMarkets (серверы часового пояса GMT+3 в

Color Levels - удобный инструмент для тех, кто использует технический анализ с использованием таких инструментов, как Трендовая линия и Прямоугольник. Имеется возможность настройки двух пустых прямоугольников, трех закрашенных и двух трендовых линий. Настройки индикатора крайне просты и делятся на пронумерованные блоки: С цифрами 1 и 2 вначале - настройки пустых прямоугольников (рамок); С цифрами 3, 4 и 5 - настройки закрашенных прямоугольников; С цифрами 6 и 7 - настройки трендовых линий. Объ

Описание стратегии: Bea является тенденцией EA, идея является самым простым способом сделки погони за падением, с движением стоп - лосс своевременно усекает убытки, чтобы прибыль бегала, Bea в основном торгует EURUSD и XAUUSD. Настройки параметров: Transaction: EA будет работать только в том случае, если Transaction=true. Lots: количество нижних рук, рекомендуется 10000USD для заказа 1 стандартной руки, то есть: 0,1 руки под 1000USD. Maxi_point: Предел максимальной точечной разницы, здесь нужно

Индикатор показывает на графике Зоны прибыли (Profit Zone) отображая начало и конец локального тренда
Profit Zone PRO идеально подходит для всех символов Meta Trader: валют, металлов, криптовалют, акций и индексов Преимущества индикатора Profit Zone PRO: Сигналы на вход без перерисовки Алгоритмы индикатора позволяют находить идеальные моменты для входа в сделку (покупки или продажи актива), повышающие успешность сделок у 100% трейдеров. Индикатор имеет два уровня профита, что позволяет частич

Эксперт торгует при открытии рынка после выходных, ориентируясь на возникший разрыв цены (ГЭП). Уже разработанные сеты лежат в комментариях. При этом доступны разнообразные параметры в настройках эксперта, позволяющие создать свои уникальные сеты самостоятельно. С качать настройки (сеты): https://www.mql5.com/en/blogs/post/747929 Валютные пары для которых разработаны сеты: GBPUSD, AUDUSD, NZDUSD, USDCAD, EURGBP, EURCHF, GBPCAD, GBPAUD, AUDCHF, AUDJPY, AUDNZD, CHFJPY, CADJPY, NZDJPY, NZDCHF,
Unique trend trading algorithm with advanced filtering and many features which should become a part of your trading arsenal. This indicator can give you also trading advisors (with take profit target), success rate scanner and much more.
Important information
For additional detailed information you can visit the 747Developments website.
Features Easy to use (just drag and drop to the chart) Possible to use with any trading instrument Possible to use on any time-frame Take profit advisors S

Dynamic Indicator --> YKL_DinDX Dynamic Indicator that creates a Band based on the distance from moving average specified by the user. The indicator considers the period entered by the user in order to calculate the average distance from moving average, creating an upper band and a lower band. This indicator is utilized by EA YKL_Scalper, version 2.0 or superior.
FREE

The Display N Bars utility is a simple tool designed to help identify candles.
If a trader tries to share knowledge with a colleague but it is difficult to pinpoint exactly the desired candle, just say the corresponding candle number.
The candle count is reset every day.
Seeking to offer a good customization the inputs are:
Display type -> Display only odd, only odd, or both candles?
Direction -> Horizontal or Vertical?
Display multiples of: (display frequency) -> Displa
FREE
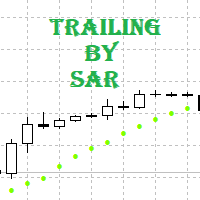
Сопровождение позиций с помощью трейлинга по индикатору Parabolic SAR. Необходимо разрешить автоматическую торговлю в настройках терминала. В режиме тестирования утилита на первых тиках открывает позиции Buy или Sell, что позволяет в визуальном режиме наблюдать заданную логику, меняя параметры утилиты. В реальном режиме утилита не открывает позиции. Параметры magic - магический номер. Если меньше 0, то сопровождаются позиции с любым магическим числом; only_this_symbol - только символ графика.
FREE

The DYJ Williams Percent Range is a unique High quality and easy to use and affordable trading tool because we have incorporated a number of proprietary features and Williams' Percent Range indicators. The Indicator values ranging between -80% and -100% indicate that the market is oversold. Indicator values ranging between -0% and -20% indicate that the market is overbought. Input Parameters WPR settings InpSpread = 50 -- When the spread is greater than or equal to 50, the signal is ignor
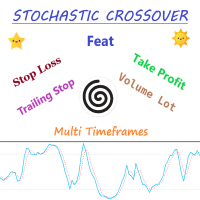
Expert Advisor Description - Basically, EA will open position in case of cross between main line and signal line on stochastic. - Unique to this EA, using the two pre-set stochastic so that the EA can open the trade position. - The first stochastic determines the cross, while the second stochastic determines the overbought or oversold levels.
Parameters Description - Volume_Lot => Number of lots determined from the balance percentage. Example Balance = 1.000 USD, Volume Lot = 100, Then lot

Expert Advisor Description Strategy using two classic indicators in MetaTrader, stochastic oscillator and moving average Accompanied by multi timeframe and parameter that can be changed according to the strategy that suits you
Feature Money Management : Stop Loss, Take Profit, Trailing Stop Trading Option : Stochastic Oscillator, two Moving Average, Multi Timeframes https://youtu.be/3dXAUUnxg1s
youtubeembedcode.com/pl/ http://add-link-exchange.com
KT Murrey Math robot incorporates a trading strategy that explicitly trades the price bars that crossed above or below a Murrey Math level. Entries: A buy order is placed when a bar closes above a Murrey Math level. A sell order is placed when a bar closes below a Murrey math level. Exits: EA places the stop-loss and take-profit always at the subsequent Murrey Math levels.
MT4 Version is available here https://www.mql5.com/en/market/product/45404
Features
This EA combines a simple Murrey

Displays previous months Highs & Lows. You can set the number of months to display levels for, also the line style, color and width. This is very useful for traders using the BTMM and other methods like ICT. I'll be creating more indicators for MT5 for the BTMM. Send me your suggestions to my Telegram: https://t.me/JDelgadoCR Take a look at my other products at: https://www.mql5.com/en/users/jdelgadocr/seller
FREE

Version 1.14 incorporates some significant changes compared to all previous versions. Additionally, this robot has been designed in a new manner, focusing on minimal adjustable inputs because I personally advocate simplicity within the complexity of anything. Hence, a minimalist user interface has been implemented without compromising performance. This robot also has its version for the MT4 platform, which will be released soon. What can you expect from this robot? Well, I've been hard at work,

Just $10 for six months!!! Displays previous weeks Highs & Lows. You can set the number of weeks to display levels for, also the line style, color and width. This is very useful for traders using the BTMM and other methods like ICT. I'll be creating more indicators for MT5 for the BTMM. Send me your suggestions to my Telegram: https://t.me/JDelgadoCR Take a look at my other products at: https://www.mql5.com/en/users/jdelgadocr/seller

Just $10 for six months!!! Displays previous days Highs & Lows. You can set the number of days to display levels for, also the line style, color and width. This is very useful for traders using the BTMM and other methods like ICT. I'll be creating more indicators for MT5 for the BTMM. Send me your suggestions to my Telegram: https://t.me/JDelgadoCR Take a look at my other products at: https://www.mql5.com/en/users/jdelgadocr/seller

This indicator is based on the ICCI.
If a long pattern is detected, the indicator displays a buy arrow.
If a short pattern is detected, the indicator displays a sell arrow. Settings
CCI Period - default set to (14) Features
Works on all currency pairs and timeframes
Draws Arrows on chart Colors
Line Color
Line Width
Line Style
Arrow Color This tool can help you analyse the market and indicates market entry.

Backtest from 2015-2019 MetaQuotes Data Every Tick Mode.
Start depo 10000 USD Lot size: 0,5 (You can modify it but maintain the ratio)
EA created for EURUSD M15
Open transaction based on RVI + Momentum + MA Crossover
Close transaction based on Stochastic
The parameters of indicators have been optimized.
Change manually only lot size.
EA does one transaction at the time.
No adding position, no martingale, no grid.
To avoid risky situations.
Fell free to increase lot size

The most advanced news filter and drawdown limiter on MQL market NEW: Take a Break can be backtested against your account history! Check the " What's new " tab for details. Take a Break has evolved from a once simple news filter to a full-fledged account protection tool. It pauses any other EA during potentially unfavorable market conditions and will continue trading when the noise is over. Typical use cases: Stop trading during news/high volatility (+ close my trades before). Stop trading when

Пробои ценовых уровней, продвинутая статистика, расчет ТейкПрофита и 3 вида уведомлений. Преимущества: Не перерисовывает свои результаты Сигнал строго на закрытии свечи Алгоритм фильтрации ложных пробоев Отлично сочетается с любой трендовой стратегией Работает на всех инструментах и таймсериях Руководство пользователя и инструкция -> ЗДЕСЬ /Решение проблем -> ЗДЕСЬ / МТ4 версия -> ЗДЕСЬ Как торговать с индикатором: Торговля с AW Breakout Catcher всего в три простых шага: Шаг 1 - Открытие п
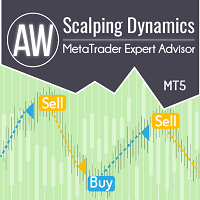
Полностью автоматический продвинутый торговый робот, работающий на основе разворотов тренда. При необходимости есть возможность использования сеточной стратегии. Встроены 3 типа уведомлений и локирование позиции при достижении максимальной загрузки корзины. Настройки по умолчанию рекомендованы для EURUSD на таймфрейме M15. Особенности и преимущества: Возможность вести одновременную работу в двух направлениях Встроенная возможность работы по времени в несколько этапов Использует виртуальный

Советник разработан по стратегии «2TF» для EURUSD и GBPUSD. Используемые индикаторы: ЕМА(5), ЕМА(10), ADX(28), MACD(5; 10; 4). Правила на покупку
ЕМА(Быстрая) пересекла ЕМА(Медленная) снизу вверх. ADX +DI (синий) выше –DI (красный). MACD выше нуля. Правила на продажу
ЕМА(Быстрая) пересекла ЕМА(Медленная) сверху вниз. ADX +DI (синий) ниже –DI (красный). MACD ниже нуля. В параметрах советника можно менять различные настройки стратегии, периоды индикаторов, размер и способы установки стоплосса,
FREE

Запускается в AUDUSD, автоматически торгует USDCAD и UCDNOK, EA – стратегия хеджирования трендов, не удваивается, не является сеткой, не существует слишком большого количества параметров, которые необходимо настроить для простоты и практичности. Настройки параметров: Transaction: EA работает, когда Transaction=true. Лотс: заказ. SL_money: Сколько денег убытка унифицирует список всех валют. Less_stop: Чистая стоимость меньше, чем на открытых складах. Рекомендуемая платформа: ECN, другие платформы

Лёгкий старт: Всё уже настроено. Минимальный депозит 100$. Быстрый результат. Удобный интерфейс.
"Биржевые математики" по всякому высмеивают применение усреднения, мартингейла и прочих видов прогрессивного управления капиталом. Общий смысл кричащих заявлений один - это не работает. Пусть кричат дальше. Действительность же такова - более 90% успешных, высоко-прибыльных и имеющих большую историю сигналов, используют именно этот способ управления капиталом. С топом ПАММ счетов ситуация аналогичн

Attention: New update - 4 major practicality improvements!
1) Alarm 2) Midas text value 3) Click panel 4) Can be connected to an EA to operate in semi-automatic mode
Attention - This indicator does not work perfectly in backtest due to MT5 peculiarities (Reading hotkeys or panel clicks) . My suggestion is that you test Automatic Vwap Midas which has automatic operation to analyze the calculation and then buy Start if you think the indicator will match your operating.
This indicator i

The Market Momentum indicator is based on the Volume Zone Oscillator (VZO), presented by Waleed Aly Khalil in the 2009 edition of the International Federation of Technical Analysts journal, and presents a fresh view of this market valuable data that is oftenly misunderstood and neglected: VOLUME. With this new approach of "seeing" Volume data, traders can infer more properly market behavior and increase their odds in a winning trade.
"The VZO is a leading volume oscillator; its basic usefulnes
FREE

Индикатор для торговли по сигналам гармонического паттерна AB=CD. Даёт сигналы и показывает уровни входа в рынок, а так же, уровни для выставления стоп приказов, что позволяет трейдеру своевременно принимать решения по входу в рынок, а также эффективно управлять позициями и ордерами. Поддерживается отправка push-уведомлений на мобильное устройство, и-мейл, а так же алерты. Данный индикатор был портирован с версии для MetaTrader 4. Больше информации, а также подробное описание и видео с демонстра

The Rise of Skywalker: It is an advanced trading system. This is a fully automatic Expert Advisor, which allows you to presize the trade according to the preferences of the trader. Is a revolution in the customization of the trading. The Rise of Skywalker is a expert advisor based in the indicator The Rise of Sky walker: ( https://www.mql5.com/es/market/product/44534 ) This system uses only one trade in each operation. Do not use Grip or martingale Low risk system since it h

Panthers Traders presents the new Expert Advisor "MRK TRADER", a robot for Forex, Indices, Commodities and Cryptocurrencies. This expert advisor works hedge strategies, has different variables to configure each other, works as a work tool or as a 100% automatic expert advisor, if you do not have experience, for your greater profitability, get in touch by private and I will explain your different variables and how to apply them in different assets, I recommend watching the videos of the YouTub

1. Why did I develop this series of indicators
I found that most traders need to use multiple time frame indicators. They usually switch time frame to see indicators. However, once the timeframe is switched, you cannot see the corresponding relationship between the price in the smaller timeframe and the indicator in the larger timeframe . For example: if your price chart is in H1 timeframe, you can see H4, D1 and W1 indicators in H1 timeframe Chart. This is more helpful for you to find t
MetaTrader Маркет - лучшее место для продажи торговых роботов и технических индикаторов.
Вам необходимо только написать востребованную программу для платформы MetaTrader, красиво оформить и добавить хорошее описание. Мы поможем вам опубликовать продукт в сервисе Маркет, где его могут купить миллионы пользователей MetaTrader. Так что занимайтесь только непосредственно своим делом - пишите программы для автотрейдинга.
Вы упускаете торговые возможности:
- Бесплатные приложения для трейдинга
- 8 000+ сигналов для копирования
- Экономические новости для анализа финансовых рынков
Регистрация
Вход
Если у вас нет учетной записи, зарегистрируйтесь
Для авторизации и пользования сайтом MQL5.com необходимо разрешить использование файлов Сookie.
Пожалуйста, включите в вашем браузере данную настройку, иначе вы не сможете авторизоваться.