YouTubeにあるマーケットチュートリアルビデオをご覧ください
ロボットや指標を購入する
仮想ホスティングで
EAを実行
EAを実行
ロボットや指標を購入前にテストする
マーケットで収入を得る
販売のためにプロダクトをプレゼンテーションする方法
MetaTrader 4のためのテクニカル指標 - 120
SYSTEM INTRODUCTION: The Binary Options Channels System Is Specifically Designed For Binary Options Trading. Unlike Other Systems And Indicators That Were Adopted From Other Trading Environments For Binary Options. Little Wonder Why Many Of Such Systems Fail To Make Money . Many End Up Loosing Money For Their Users. A Very Important Fact That Must Be Noted Is The Fact That Application Of Martingale Is not Required. Thus Making It Safer For Traders Usage And Profitability. A Trader Can Use Fi
SYSTEM INTRODUCTION: The Binary Options Momentum System Is Specifically Designed For Binary Options Trading. Unlike Other Systems And Indicators That Were Adopted From Other Trading Environments For Binary Options. Little Wonder Why Many Of Such Systems Fail To Make Money . Many End Up Loosing Money For Their Users. A Very Important Fact That Must Be Noted Is The Fact That Application Of Martingale Is not Required. Thus Making It Safer For Traders Usage And Profitability. A Trader Can Use Fi

TradeMo は、価格アクションのみに反応する 100% 正確なシグナル インジケーターです。 したがって、8 線形移動平均線が 10 線形移動平均線を超えると買いシグナルが予想され、8 線形移動平均線が 10 線形移動平均線を下回ると売りシグナルが予想されます。 それでおしまい! ここで使用方法を説明するのを見てください。
インジケーターはすべての時間枠に調整されますが、ピップを最大化するには、1 時間の時間枠などのより高い時間枠を使用することをお勧めします。 ここでは、タイムフレームが長いほど取引が容易になる理由を独自の方法で説明します。
私はストップ ロスを使用しませんが、必要に応じて 5 ピップのストップ ロスのみを使用することをお勧めします。
インジケーターの説明: 誤ったシグナルを回避するには、シグナル アラート ボックスが表示されたときにのみ取引を開始します。 音声通知が利用可能です。 最良の結果を得るには、1 時間枠で取引することをお勧めします。 チャートには、売りトレードでは下向き、買いトレードでは上向きの矢印も表示されます。アラートなしで矢印が表示された場

VaviStar is an indicator based on trend retracements determined by ZigZag segments. It is theorized, and statistics confirm, that stocks react to certain retracement levels. Many use Fibonacci retracement levels (23.6%, 38.2%, 61.8%). It is assumed that once the price goes beyond the 61.8% retracement, we can already speak of a trend reversal. This indicator allows you to comfortably chart a segment of the ZigZag with the relative operating levels chosen. With a reversal mindset , you can use it
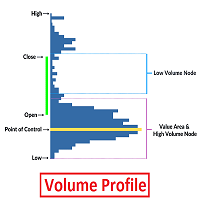
Volume Profile is an advanced charting study that displays trading activity over a specified time period at specified price levels. The study (accounting for user defined parameters such as number of rows and time period) plots a histogram on the chart meant to reveal dominant and/or significant price levels based on volume. Essentially, Volume Profile takes the total volume traded at a specific price level during the specified time period and divides the total volume into either buy volume or s

MAD - Moving Average Distance The MAD Indicator uses ATR and the distance to a moving average to determine if price has the potential for mean reversion. Works on all time frames and pairs. It will only check for the condition at the beginning of a new candle so it doesn't repaint. A signal will include an arrow on the chart, alert popup and cell phone notification.
Settings: ATR_Multiplier: Multiplier of ATR for the calculation. (Recommended: 5)
MA_Period: Moving Average Period to use (EMA).

Real Trade は、1 時間未満の時間枠で取引します。 上昇トレンドと下降トレンドの方向で取引します。 より高い時間トレンド方向で取引し、最初のろうそくを取引します. 反対を使用して終了するか、レシオを使用して 1:1 以上を終了し、トレーリング ストップと共に使用します。 最良の結果を得るには、アクティブな時間帯にリアル トレンドをトレードし、より高いトレンド方向でトレードします。 結果と可能性を調べるためにテスターにインジケーターをロードします。 トレンドと取引するスキャルピング矢印を使用するか、Fib ターゲットを使用するか、またはその両方を使用します。 5 分または 15 分のチャートにおすすめです。
ターゲットとストップに FIb を使用: https://www.mql5.com/en/code/12813

Dear Trader It is my pleasure to introduce to you my tool called the " Forex Sniper Indicator" . The major aim of this tool is to help serious traders and investors in all type of Financial Markets to catch price next movement right at the moment the price direction is about to change. This tool can be used to snipe the price direction in both down trend, uptrend and ranging markets. This tool can be used as the stand alone tool though it may be combined with other tools as well. My goal is to h
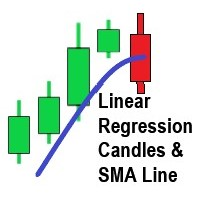
MT4 のこのインジケーターは、類似した名前の Trading View で現在人気のあるインジケーターに基づいています。
4 (OHLC) 配列には、各価格の線形回帰値が入力されます。 線形回帰の期間は、2 より大きくなければならない入力です (1 を入力しようとすると、デフォルトで 2 になります)。
線形回帰の期間は、市場の状況に応じて調整できます。 SMA には期間調整もあります。
ローソク足は、「アップ」ローソクの緑と「ダウン」ローソクの赤で生成されます。 LR Close の SMA が含まれているのは、このインジケーターの使用方法が次のように想定されているためです。
緑色のろうそくが SMA を上回っている場合は、ロングにします。 赤いろうそくが SMA を下回っている場合は、ショートします。
間違いなく平均足感があります。

DYJ RSIコントローラは全通貨RSI取引システムである M1からMNまでの各通貨ペアのRSI値を表示できます 1サイクルのRSI値がスーパーエリアとスーパーエリアに到達すると、色のヒントがあります。 これらの情報に基づいて正しい取引をすることができます RSI指標テンプレートを作成してDYJ RSIと名付け、それを保存してください
スーパーストアまたはスーパーストアをマウスでクリックすると、該当する通貨対周期のグラフが自動的に開き、RSI指標がロードされます INPUT
InpPairs = "GBPUSD,EURUSD,USDJPY,USDCHF,XAUUSD,USDCAD,GBPJPY,EURJPY,EURGBP,EURAUD,EURNZD,EURCAD,CADJPY,AUDUSD,AUDNZD,AUDCAD,AUDJPY,NZDJPY,NZDUSD,NZDCAD,GBPAUD,GBPNZD,GBPCAD,CHFJPY,NZDCHF,AUDCHF,EURCHF"; InpStrategyMinTimeFrame

Bank Executive Indicator Uses A Simple method of tracking price as it moves across the chart and signals when a potential long or short position is active and indicates this to the trader giving you the opportunity to take a position on the market. Or you can simply use this indicator to give yourself signals and determine if you want to take the trade or learn the strategy on your own.
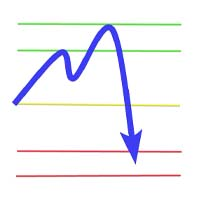
To measure the daily range, sell when above 30 pips in the European or US session, buy when below 30 pips in the European or US session. Take profit only around 30 pips because this is only an indicator for daily trading. FEATURES : Sum Range, max 30 Show Rectangle
Show Level
OC SR Line Width OC SR Line Color Show Label
Custom Label Position
Custom Font Label
Custom Font Size
Custom Mark Session
Show Line Break Event Point

Median Renko Terminator works best with renko charts if you do not have a renko chart generator I will email it to you for free and give you the correct settings for scalping or to swing trade NON-REPAINT COMES WITH ALERTS WHEN THERE IS A SIGNAL Conditions to sell: big purple arrow shows you the direction first then you take the small purple arrow to enter the same direction of the purple arrow. Conditions to buy: big white arrow shows you the up direction first then you take small white arrow
Exponential moving average (EMA) and super trend are popular and good indicators that is often and used to determine the trend direction. One of the best trading strategies with trailing stop is trading strategy with using a combination of Exponential Moving Average (EMA) and Super Trend indicators. EMA SuperTrend Strategy Indicator is the indicator consist of EMA, Super Trend and Alert function also other calculations are needed. It's also has extra indicator there are Automated Fibonacci Retr

Bank Expert Indicator Uses A Simple method of tracking price as it moves across the chart and signals when a potential long or short position is active and indicates this to the trader giving you the opportunity to take a position on the market. Or you can simply use this indicator to give yourself signals and determine if you want to take the trade or learn the strategy on your own. The Signals From this indicator are targeted at long-term positions and focus on top quality call outs.
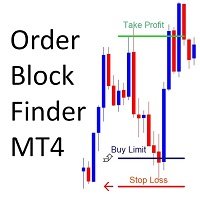
!! FLASH SALE !! Over 80% off !! For ONE week only. Now only $47 - normally $297! >>> Ends on 30 June 2023 - Don't miss it!
Sends Alerts – On MT4 To Your Phone To Your Email
Does not repaint .
Works on any Forex pair, any timeframe.
10 Activations allowed so you are free from limitations >> MT5 Version Here
For spreads from a tiny 0.1 pips RAW/ECN Accounts, click here . Check out my Waka Esque EA signal here: >> High Risk Settings or Medium Risk Settings .
What Is An Order Blo

The indicator is coded to be suitable for every parity and every period. The purpose of the indicator is to capture the correct signal levels. The product is equipped with all notification and alarm options. In this way, you will be able to receive signals even if you are not at the screen. The product tries to find the signals in the trend direction as a strategy. Thus, it is more reliable. you have input signals. For default settings, recommended periods should be M15,M30,H1.

Tame the trend just got easier! The PDS indicator will signal the use of price sentiment. Just one setting!
Study the offer of the indicator and get the opportunity for profitable trading based on a proven and tested strategy. The mathematical algorithm proves its performance even to skeptics under any market conditions. It goes well with any trading strategy. Never recalculates signals. Signals appear at the opening of the bar. Works with any financial instruments, including forex, cryptocurr
Based on Trend Following Strategy, QCAFE SUITE was built to get more accurate signal for Traders to decide whether to enter trades, included in the SUITE is QCAFE+ filter to eliminate false signals. The Signals are generated based on formula of Hull Moving Average ( HMA ) to minimize the lag of a traditional moving average - developed by Alan Hull in 2005 Setting: Limited Bars of back test Fast Period Low Period Fast/Low period to generate Buy/Sell signal
Based MA Period B ased Moving Average
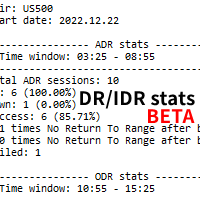
Based on the free DR/IDR indicator but with basic stats. Has the feature to export the daily data to a HTML file. So you can check the daily DRs yourself. Be mindful that the stats can vary from different broker feeds. So make sure your MT4 has enough data.
Scroll back in your MT4 and check for any gaps in the feed. Sometimes you will have to scroll back to update the stats. Feel free to contact me for questions related to the purchase, installation and use of the Indicator.

We’ll start off by just testing the default DMI crossover strategy. We’ll buy when the 14-period DMI-plus crosses above the 14-period DMI-minus, and sell once the former crosses below the latter. Here are the results: As you see, the strategy seems to work well in bull markets. Still, this isn’t something we’d like to trade in its raw form! So how could we go about improving the strategy? We’ll one common approach is to demand that ADX is above 25. However, in our tests, we’ve found out that a l

The Accelerator MT4 forex indicator was designed by Bill Williams’ and warns you of early trend changes for any currency pair. The indicator is also known as the Accelerator/Deceleration forex indicator. It basically looks for changes in momentum, either accelerating or decelerating. As you can see from the EUR/USD H1 chart shown below, the indicator draws green and red bars above and below the 0.00 level. Green and red bars above the 0.00 level suggest bullish momentum in price (price goes up).

Accumulation/Distribution Technical Indicator is determined by the changes in price and volume. The volume acts as a weighting coefficient at the change of price – the higher the coefficient (the volume) is, the greater the contribution of the price change (for this period of time) will be in the value of the indicator. In fact, this indicator is a variant of the more commonly used indicator On Balance Volume . They are both used to confirm price changes by means of measuring the respective vo

Prometheus Trade Engine is an indicator that combines price action, ratio based indicator with custom indicators& other lagging indicators to create this leading indicator that has a multi-timeframe approach to trading so that you are able to see what other timeframes are doing all in one chart and give you high probability trade setups to assist you to make a prediction on what is MOST likely to happen in the market going foward
Chart Features 1. Reversal Zone
It is the rectangular box on you
Parabolic SAR Parabolic SAR Technical Indicator was developed for analyzing the trending markets. The indicator is constructed on the price chart. This indicator is similar to the Moving Average Technical Indicator with the only difference that Parabolic SAR moves with higher acceleration and may change its position in terms of the price. The indicator is below the prices on the bull market (Up Trend), when it’s bearish (Down Trend), it is above the prices. If the price crosses Parabolic SAR
In fact, this indicator is a variant of the more commonly used indicator On Balance Volume . They are both used to confirm price changes by means of measuring the respective volume of sales. When the Accumulation/Distribution indicator grows, it means accumulation (buying) of a particular security, as the overwhelming share of the sales volume is related to an upward trend of prices. When the indicator drops, it means distribution (selling) of the security, as most of sales take place during t

In fact, this indicator is a variant of the more commonly used indicator On Balance Volume . They are both used to confirm price changes by means of measuring the respective volume of sales. When the Accumulation/Distribution indicator grows, it means accumulation (buying) of a particular security, as the overwhelming share of the sales volume is related to an upward trend of prices. When the indicator drops, it means distribution (selling) of the security, as most of sales take place during t

When the Accumulation/Distribution indicator grows, it means accumulation (buying) of a particular security, as the overwhelming share of the sales volume is related to an upward trend of prices. When the indicator drops, it means distribution (selling) of the security, as most of sales take place during the downward price movement. Divergences between the Accumulation/Distribution indicator and the price of the security indicate the upcoming change of prices. As a rule, in case of such divergen

Everyday trading represents a battle of buyers ("Bulls") pushing prices up and sellers ("Bears") pushing prices down. Depending on what party scores off, the day will end with a price that is higher or lower than that of the previous day. Intermediate results, first of all the highest and lowest price, allow to judge about how the battle was developing during the day. It is very important to be able to estimate the Bears Power balance since changes in this balance initially signalize about possi

Everyday trading represents a battle of buyers ("Bulls") pushing prices up and sellers ("Bears") pushing prices down. Depending on what party scores off, the day will end with a price that is higher or lower than that of the previous day. Intermediate results, first of all the highest and lowest price, allow to judge about how the battle was developing during the day. It is very important to be able to estimate the Bears Power balance since changes in this balance initially signalize about possi

Everyday trading represents a battle of buyers ("Bulls") pushing prices up and sellers ("Bears") pushing prices down. Depending on what party scores off, the day will end with a price that is higher or lower than that of the previous day. Intermediate results, first of all the highest and lowest price, allow to judge about how the battle was developing during the day. It is very important to be able to estimate the Bears Power balance since changes in this balance initially signalize about possi

トレンドシグナルインジケーター。 チャート上の矢印でトレーダーに価格反転ポイントとトレンドの方向を示します。 赤い矢印が表示されると、価格が下がります。 青い矢印が表示されると、価格が上向きに反転します。 指標はその値を再描画しません。 矢印を再描画しません。 ローソクの始まりに矢印が表示されます。 "period_long" および "period_short" パラメータを使用して、シグナルの精度を調整できます。 これらのパラメータの値をより小さく設定すると、指標は短距離でより正確な価格反転ポイントを表示します。 より長いトレンドを見る必要がある場合は、これらのパラメーターの値をさらに指定する必要があります (例: period_long =77 および period_short=55)。
インジケーターの利点: 信号を再描画しません。 より正確な作業のために簡単に調整できます。 価格反転ポイントを矢印で示します。
取引に関する推奨事項: 任意の通貨ペア。 時間枠 M5、M30、H1、H4、D1
インジケーターの設定: period_long - トレンドの長波を計算するた
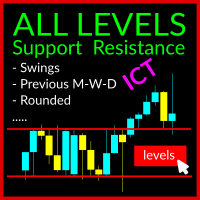
The Swing Levels Support and Resistance Indicator is a robust tool designed for MetaTrader 5 traders (also available for MT4). It aids in identifying crucial market levels where price direction may change by showcasing: Swing High and Swing Lows across all timeframes Previous Highs and Lows for Day, Week, and Month ICT US Midnight level and Yesterday Midnight Level ICT US Preopen 8:30 AM Level Rounded Levels This indicator features a toggle button, enabling you to display or hide these levels o

An Ultimate Tool for quick and efficient market analysis. Unique combination of solid indicators defining market direction for trend tracking and filtration designed for you to stay on the right side of the market.
Market Rider Tools gives you access to one of the most used from professional trades indicators on worldwide, which were not build in for MT4 and MT5 terminals . These are unique non-repainting indicators designed to be used on all time frames for all instruments classes: Forex

An Ultimate Tool for quick and efficient market analysis. Unique combination of solid indicators defining market direction for trend tracking and filtration designed for you to stay on the right side of the market.
Market Rider Oscillators gives you access to one of the most used from professional trades indicators on worldwide, which were not build in for MT4 and MT5 terminals . These are unique non-repainting oscillators designed to be used on all time frames for all instruments classe

This Nice Trade Point indicator is designed for signal trading. This indicator generates trend signals.
It uses many algorithms and indicators to generate this signal. It tries to generate a signal from the points with the highest trend potential.
This indicator is a complete trading product. This indicator does not need any additional indicators.
The indicator certainly does not repaint. The point at which the signal is given does not change.
Features and Suggestions Time Frame

この指標は、金およびその他の通貨ペアの価格反転ポイントを示します。 作業の推奨期間: M1、M5、M15、M30、H1。 インディケータは市場を分析し、反対方向に価格が反転する可能性があるポイントをトレーダーに示します。 信号の精度は、設定、期間、および選択した動作モードによって異なります。 平均して、シグナルの精度は最大 93% で、日中のスキャルピング取引に適しています。 「期間」設定のパラメーターを使用して、インジケーター信号の精度を制御できます。 また、信号の精度は、「再描画」パラメータを使用して選択した信号フィルタリング モードによって異なります。 「redraw=false」モードでは、インディケータはシグナルを再描画せず、日中取引の多数のシグナルを表示します。
XAUUSD 通貨ペアのさまざまな時間枠での取引に推奨されるパラメータの表: 期間 M1 - パラメータ設定 period=2 期間 M5 - パラメータ設定 period=2 期間 M15 - パラメータ設定 period=3 期間 M30 - パラメータ設定 period=5 期間 H1 - パラメータ設定

This indicator labels swing highs and swing lows as well as the candle pattern that occurred at that precise point. The indicator can detect the following 6 candle patterns: hammer , inverse hammer , bullish engulfing , hanging man , shooting star and bearish engulfing .
The notations HH, HL, LH, and LL you can see on the labels are defined as follows:
HH : Higher high
HL : Higher low
LH : Lower high
LL : Lower low
Setting
Length: Sensitivity of the swing high/low detection,

Lets dabble a bit into Elliot Waves.
This is a simple indicator which tries to identify Wave 1 and 2 of Elliot Impulese Wave and then projects for Wave 3.
Ratios are taken from below link: https://elliottwave-forecast.com/elliott-wave-theory/ - Section 3.1 Impulse
Wave 2 is 50%, 61.8%, 76.4%, or 85.4% of wave 1 - used for identifying the pattern. Wave 3 is 161.8%, 200%, 261.8%, or 323.6% of wave 1-2 - used for setting the targets
Important input parameters MaximumNumBars : To calculate back

The Price Action Finder Multi indicator is an indicator of entry points that searches for and displays Price Action system patterns on dozens of trading instruments and on all standard time frames: (m1, m5, m15, m30, H1, H4, D1, Wk, Mn). The indicator places the found patterns in a table at the bottom of the screen. By clicking on the pattern names in the table, you can move to the chart where this pattern is located. Manual (Be sure to read before purchasing) | Version for MT5 Advantages
1. Pat

The indicator changes the current chart timeframe depending on the drawdown in the deposit currency, the number of orders or the percentage of the deposit. You can set the drawdown in the deposit currency, the number of orders in one direction or the percentage of the deposit, at which the current timeframe will change to the selected one. This significantly reduces the drawdown during the work of Expert Advisors using order networks.
Indicator parameters: Drawdown in currency, orders or percen

1 つのウィンドウで通貨ペアの複数の時間枠を分析すると、混乱する可能性があります。
複数の時間枠を分析するには、信頼できるインジケーターが必要です。
そのうちの1つが9TF Double RSI Double MAを使用しています。
シンプルでありながら信頼性が高く、1 つのインジケーターで 9 つの時間枠すべてをカバーするコードを作成するために、昼夜を問わず取り組んできました。
このインジケーターの利点のいくつかを見てみましょう。
RSI を 2 倍にします。つまり、RSI が速く、RSI が遅くなります。 MA を 2 倍にします。つまり、MA が速くなり、MA が遅くなります。 10配色。 各時間枠の曲線の色は互いに異なります。 RSIのOBOSレベルライン。 リアルタイム 9TF ダッシュボード モニター。 ある時間枠から別の時間枠に変更しても、9TF ダッシュボード モニターの計算は非常に正確です。 どの RSI 曲線が買われ過ぎのレベルを上回っており、どの RSI 曲線が売られ過ぎのレベルを下回っているかを監視します。 MA ファスト ラインが MA スロー ラ

1 つのウィンドウで通貨ペアの複数の時間枠を分析すると、混乱する可能性があります。
複数の時間枠を分析するには、信頼できるインジケーターが必要です。
そのうちの1つが9TF Double CCI Double MAを使用しています。
シンプルでありながら信頼性が高く、1 つのインジケーターで 9 つの時間枠すべてをカバーするコードを作成するために、昼夜を問わず取り組んできました。
このインジケーターの利点のいくつかを見てみましょう。
CCI を 2 倍にします。つまり、CCI が速く、CCI が遅くなります。 MA を 2 倍にします。つまり、MA が速くなり、MA が遅くなります。 10配色。 各時間枠の曲線の色は互いに異なります。 CCIのOBOSレベルライン。 リアルタイム 9TF ダッシュボード モニター。 ある時間枠から別の時間枠に変更しても、9TF ダッシュボード モニターの計算は非常に正確です。 どの CCI 曲線が買われ過ぎのレベルを上回っており、どの CCI 曲線が売られ過ぎのレベルを下回っているかを監視します。 MA ファスト ラインが MA スロー ラ

Identify Engulfing candle pattern with Arrows & Alert ( built-in RSI filter). This indicator helps you to identify Engulfing candle pattern or Outside bar (OB) on the chart with arrows, along with an alert when a new Engulfing candle appears. Engulfing candle pattern is one of the most important reversal Price Action signals. You can choose between standard Engulfing (Engulfing based on candle body) or non standard Engulfing (Engulfing based on candle high - low )
Alerts can be turned on an
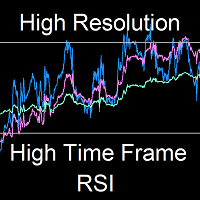
MUST READ CAUTION BEFORE PURCHASE
This one-of-a-kind indicator displays the instantaneous high resolution High Time Frame Relative Strength Index (HTF RSI), where up to three higher time-frame RSI's can be displayed simultaneously on the current chart. The indicator differs drastically from previous multi-time-frame RSI indicators in that it displays the high resolution bar-by-bar calculation of the HTF RSI - and not just the discrete values at the HTF bar closings. This allows for earlier

Identify Pinbar Candle Pattern with Arrows & Alert (built-in RSI filter).
This indicator helps you to identify Pin bar Candlestick Pattern (or shooting star & hammer pattern) on the chart with arrows, along with an alert when a new Pin bar appears. Pin bar pattern is one of the most important reversal Price Action signals.
You can set Minimum Percent of Wick (or Tail) Length over full bar length (Recommended: 60%, 70%, 75%).
Alerts can be turned on and off: Popup Email Push Notification Soun
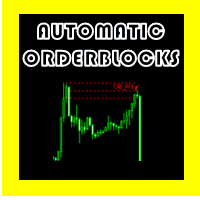
AUTOMATICS ORDERBLOCKS OSW
(メタトレーダー5)
このインジケーターは、いくつかの事前に確立されたルールの下で注文ブロックを表示する役割を果たします。
>以前の衝動を壊す衝動があること。
>それが見つかった場合、形成されたローソク足パターンを見つけ、最も効率的な方法で場所の高値と安値を計算し、オーダー ブロックの高値と安値を作成します。
>注文ブロックが作成された後、インジケーターは、ローソク足が注文ブロックの上下の線を横切るかどうかを常にチェックして、シグナルの可能性があることを示すアラートシグナルを生成します。
>インジケーターによって提供されるシグナルは、他の戦略のように 100% 効果的ではないため、手動のテクニカル分析を併用することをお勧めします。
> PC、モバイル、メールの 3 種類のアラートが生成されます。

Fibonacci por color en niveles para aplicar estrategia profesional inicialmente se coloca en el punto mas alto del dia y mas bajo con esto es para ubicar operaciones a una distancia exacta con lo cual se busca generar ganancias residuales internas en el mismo dia con esto las lineas fusias es para colocar las entrdas sell y las lineas verdes amarillas van los buy

This Trusty Strong Arrow indicator is designed for signal trading. This indicator generates trend signals.
It uses many algorithms and indicators to generate this signal. It tries to generate a signal from the points with the highest trend potential.
This indicator is a complete trading product. This indicator does not need any additional indicators.
The indicator certainly does not repaint. The point at which the signal is given does not change.
Features and Suggestions Time Fr
SSL Channel Indicator MT4 で取引の精度を高めましょう。このダイナミックなツールは、革新的な Semaphore Signal Level(SSL)アプローチを通じて価格トレンドのダイナミクスを視覚化するために設計されています。MQL5やForex Factoryなどのトレーディングコミュニティで普及したテクニカル分析のコンセプトに根ざし、このインジケーターは高値と安値に対してそれぞれ10期間の単純移動平均(SMA)を使用して、適応性の高い価格チャネルを形成します。トレンド変化を特定するシンプルさと有効性で知られ、複雑な計算をせずに明確な反転または継続シグナルを求めるトレーダーのお気に入りです。 SSL Channel Indicatorは、「フリップテクニック」を使用してトレンドの形成と変化をシグナル化するのに優れ、価格が高値SMAと安値SMAのチャネルを交互に上下します。価格が高値SMAを下回る場合、高値チャネルを保持し、価格が安値SMAを上回る場合、安値チャネルを保持し、トレンド反転または継続のための明確な視覚的キューを提供します。利点には、トレンド追

MT5 Version Kill Zones
Kill Zones allows you to insert up to 3 time zones in the chart. The visual representation of the Kill Zones in the chart together with an alert and notification system helps you to ignore fake trading setups occurring outside the Kill Zones or specific trading sessions. Using Kill Zones in your trading will help you filter higher probability trading setups. You should select time ranges where the market usually reacts with high volatility. Based on EST time zone, followin
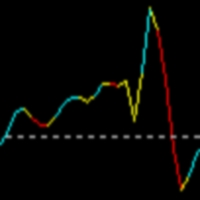
Индикатор использует сложный алгоритм, который позволяет ему обнаруживать потенциальные развороты тренда. На основе его кода, индикатор сравнивает движение цены со средним диапазоном свечей. Так же индикатор показывает места флета где появляется разворот и приостанова движения цены Работает на любой валютной паре, с любым таймфреймом Дополнительно можно встроить передачу сигналов в телеграм, Выбор цветов позволяет пользователю настроить свою цветовую гамму.

[ MT5 Version ] [ Kill Zones ] [ SMT Divergences ] How to trade using Order Blocks: Click here Experience the ultimate in trading precision with the Order Blocks ICT indicator, designed to empower traders with unparalleled insights into market dynamics. This advanced tool leverages order flow and volume analysis to reveal crucial buying and selling pressures driving price action. Why Choose Order Blocks ICT? Unleash Market Insights: Order Flow Analysis: Discern buying and selling pressure

これは 3Bar_Play として知られるプライス アクション ベースの戦略であり、3Bar ローソク足パターンの形成に基づいています。買い/売りシグナルの矢印をポップアップする前に、フィルターと確認のために追加のインジケーターが追加されます。上昇トレンド、下降トレンド、または横ばい市場のいずれかで取引できます。 追加された指標は次のとおりです。 確率的 - モメンタム フィッシャー - トレンド ATR - シグナル矢印のベースでのストップロスの配置も明確に定義するボラティリティ。 報酬に対するリスクは、1:1 から 1:4 のいずれかになります。 買い - 2 つの弱気バーと 1 つの強気バーの後に買いシグナルがポップアップする場合。 売り - 2 つの強気バーと 1 つの弱気バーの後に売りシグナルがポップアップする場合。 追加機能 - チャート上のシグナルをオン/オフするためのトグル ボタン。 非常に使いやすいインジケーターで、すべての市場に対応しています。 注意 インジケーターが表示されない場合は、私に連絡してカスタム インジケーター (Fisher) をインストールする必要

任意の通貨ペアで、M5 期間 (M5 時間枠) でスキャルピングするための既製の取引戦略。 取引戦略はテストされており、良好なパフォーマンスを示しています. すべてのトレーダーは、初心者であっても、この戦略を使用してスキャルピングできます。 取引を開始するには、PC で Metatrader4 を開き、このページから「スキャルピング シグナル インジケーター」をダウンロードして、取引する通貨ペアのチャートに追加する必要があります。 M5 時間枠を選択する必要があります (インジケーターは、特別な最適化なしでは他の時間枠では機能しません)。 これらの手順を完了した後, チャートに 77 の期間を持つ標準の「移動平均」インジケーターを追加する必要があります. このインジケーターは無料で、端末のトレンドインジケーターフォルダーにあります. これで取引を開始できます。 以下に取引戦略について説明します。
「スキャルピング シグナル インジケーター」を使用した取引戦略: 買い取引を開くには: インジケータが緑色の矢印を描くのを待ちます. その後、「移動平均」インジケーターを見て、Open[0
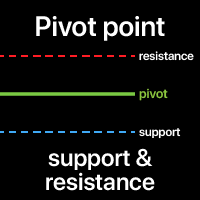
ピボットポイントは市場全体のトレンドを決定するために使用されます。 ピボットレベル自体は、前バーの高値、安値、終値の平均です。
次のバーでピボットポイントを超えて取引することは、継続的な強気相場を示すと考えられており、ピボットポイント以下で取引することは弱気相場を示します。
ピボットポイントはインジケーターの基盤ですが、ピボットポイントに基づいて投影された他のサポートとレジスタンスレベルも含まれています。 これらのレベルはすべて、価格が拒否される可能性のある場所を見るのに役立ちます。 多機能ユーティリティ : 66以上の機能を含む | ご質問があればご連絡ください | MT5 バージョン インジケーターの設定で、次の項目を構成できます: 期間 計算に使用(古典的な方法では日次タイムフレームで計算されます)
線 の色 と スタイル テキストの位置 フォントのスタイルとサイズ プログラムファイルは " Indicators " ディレクトリに配置してください。

PSAR Scanner Dashboard for MT4:
(Multi-timeframe and Multi-currency) Parabolic SAR (Stop and Release) Indicator is mainly for analyzing the trending markets. And this dashboard will look for the switch and also other strategies. Features: Scan for PSAR Switch Show how many bars back the switch happened Check ADX line is between min and max range specified Check -DI > +DI for SELL And +DI > -DI for BUY Check Higher Timeframe PSAR Alignment Check if Moving Averages are stacked in an up/down trend
Download the filter for the indicator to work BetterVolume_1_4.mq4 https://drive.google.com/file/d/1Mgsjj7MxZn9yTjwyL7emKkfQKorl40AJ/view?usp=sharing
The arrow indicator without redrawing shows potential entry points to the market in the form of arrows of the appropriate color: the up arrows (usually green) offer to open a purchase, the red down arrows – a sale. The appearance of arrows may be accompanied by sound signals. It is usually assumed to enter at the next bar after the pointer, but t

This Special Strong Arrows indicator is designed for signal trading. This indicator generates trend signals.
It uses many algorithms and indicators to generate this signal. It tries to generate signals from the points with the highest trend potential.
This indicator is a complete trading product. This indicator does not need any additional indicators.
The indicator is never repainted. The point at which the signal is given does not change. When the signal comes the arrows are put back one ca

the Super Smart Candles detection indicator
It detects the major breakout Candles amplified by the volume and Candle body size and shows it in a separate window to give a great indication of market power - if Bears dominates :: you will see big Red lines during the day bigger than green ones - if Bulls dominates :: you will see big Green lines during the day bigger than red ones It works on any time frames indicator inputs * frequency : from 1 t0 4 : : higher value gives more signals - lo
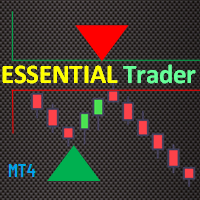
The Essential Trader indicator is more comfortable with whipsaw/ranging market conditions. It is not a complicated trading indicator and can be used on any timeframe with high level of confidence. Besides, it has notifications and alerts. The dotted essential points show spots where you can make immediate entries and benefit from breakout on either side of the region. On the other hand, the color filled points display reversal regions. These are important in that you can trade along the trend or

R Scalper Arrows インジケーターは、通貨ペアの読みやすい売買シグナルの矢印を提供します。
短期的な傾向を予測するのに適しています。 上向きの矢印は、ペアが短期的な上昇トレンドにあることを示します。 下向きの矢印は、ペアが短期的な下降トレンドにあることを示します。 ロングトレードの場合は、ストップロスをピップの下に置きます。
ショート トレードの場合は、ピップの上にストップ ロスを設定します。
一緒に行く このインジケーターは、単純移動平均や指数移動平均などの外国為替インジケーターに続く長期トレンドと共に使用できます。
トレンド フォロー インジケーターが示すトレンドの方向にのみトレードします。
基本的な取引シグナル R Scalper Arrowsインジケーターシグナルは解釈が簡単で、次のようになります。
買い取引 – 紫色の上向き矢印がチャートに表示されたら、買い取引を開始します。
売り取引 – 紫色の下向き矢印がチャートに表示されると、売り取引が開始されます。
取引終了 – 反対のシグナルに基づいて取引を終了するか、独自の取引終了方法を使用します。

This Pure Super Signal indicator is designed for signal trading. This indicator generates trend signals.
It uses many algorithms and indicators to generate this signal. It tries to generate signals from the points with the highest trend potential.
This indicator is a complete trading product. This indicator does not need any additional indicators.
The indicator is never repainted. The point at which the signal is given does not change. When the signal comes the arrows are put back one ca
The indicator is specialized for use in scalping strategies. It has the ability to send buy/sell signals. the indicator highlights signals during the formation of any fresh tick and the investor has the opportunity to apply them not alone, but taking into account the n number of specific signals for a specific time. In other texts, it is necessary to take into account which way the indicator advises trading in its own 5-7 last signals. It is not recommended to use this indicator as a single and
IconTradeSL. Возможность выставлять sl по уровням. В индикаторе установлена возможность показывать историю уровней на графике. Возможность выставлять sl по уровням. Настройки индикатора: ЦВЕТ_BAR - цвет баров по которым ищем SL
ЦВЕТ_Тек_BAR - Purple;//цвет текущего бара
BAR - поиск в последних BAR барах (по умолчанию 200)
show_bar - показывать бары по которым ищем SL

R Chimp Scalper は、外国為替投機家やデイトレーダーにとって優れた取引ツールです。
このスキャルピング インジケーターのシグナルは非常に明確で読みやすいです。
個別の取引ウィンドウで、ゼロ レベルの上下に緑と赤のバーを描画します。 緑色のバーはゼロ レベルの上に並んでおり、強気の投機傾向を示しています。 赤いバーはゼロ以下に並んでおり、スキャルピングの下降トレンドを示しています。 ゼロレベルを超えるインジケーターの読み取り値は、スキャルピングの上昇トレンドを示しており、トレーダーはペアを購入しようとしています.
ゼロレベルを下回るインジケーターの読み取り値は、弱気のスキャルピング トレンドを示しており、トレーダーはペアを売却すると予想されます。
ベター プラクティス このスキャルピング オシレーターをトレンド フォロー インジケーターと共に使用し、メイン トレンドの方向にトレードします。
基本的な取引シグナル R Chimp Scalper インジケーターのシグナルは解釈が簡単で、次のようになります。
買いシグナル: インジケーターがゼロレベルを上向きに横切
This Perfective Signal System indicator is designed for signal trading. This indicator generates trend signals.
It uses many algorithms and indicators to generate this signal. It tries to generate a signal from the points with the highest trend potential.
This indicator is a complete trading product. This indicator does not need any additional indicators.
The indicator certainly does not repaint. The point at which the signal is given does not change.
Features and Suggestions Time

正確な CCI インジケータが利用可能です。
ダッシュボード トレンド バー スマート レベル 9TF ダブル CCI。 Double CCI、つまり Fast CCI と Slow CCI 2 番目の CCI が必要な理由 追加のインジケーターを使用すると、ライブ取引でより説得力が増します 9TF ファスト CCI カーブ 9TF スロー CCI カーブ 9TF リアルタイム CCI 角度 9TF リアルタイム CCI 値 9TF リアルタイム CCI 方向/位相 9TF トレンドバー トレンドバーを計算する新しいアルゴリズム オン/オフボタン。 ワンクリックでインジケータを表示/非表示にするのに非常に便利 リアルタイム 9TF ダッシュボード モニター トレンドバーのみ表示可能 CCI 曲線のみを表示する機能 ダッシュボードのみを表示する機能 表示する CCI 曲線を選択する機能 トレンドの矢印タイプを選択可能 obos ライン スタイルを選択する機能 凡例を表示/非表示にする機能 小節の数を増減する機能 配色レベルを選択する機能 最大 10 個のダッシュボード トレンド バー

正確な RSI インジケーターが利用可能です。
ダッシュボード トレンド バー スマート レベル 9TF ダブル RSI。 ダブルRSI、つまり速いRSIと遅いRSI なぜ2番目のRSIが必要なのですか? 追加のインジケーターを使用すると、ライブ取引でより説得力が増します 9TF 高速 RSI 曲線 9TF スロー RSI カーブ 9TF リアルタイム RSI アングル 9TF リアルタイム RSI 値 9TF リアルタイム RSI 方向/位相 9TF トレンドバー トレンドバーを計算する新しいアルゴリズム オン/オフボタン。 ワンクリックでインジケータを表示/非表示にするのに非常に便利 リアルタイム 9TF ダッシュボード モニター トレンドバーのみ表示可能 RSI 曲線のみを表示する機能 ダッシュボードのみを表示する機能 表示するRSI曲線を選択する機能 トレンドの矢印タイプを選択可能 obos ライン スタイルを選択する機能 凡例を表示/非表示にする機能 小節の数を増減する機能 配色レベルを選択する機能 最大 10 個のダッシュボード トレンド バーの配色を選択する機能 RS

This indicator is a too that : calculates position size based on account balance/equity , currency pair, given entry level, stop-loss level and risk tolerance (set either in percentage points or in base currency). It displays reward/risk ratio based on take-profit. Shows total portfolio risk based on open trades and pending orders. Calculates margin required for new position, allows custom leverage.
MetaTraderマーケットはトレーダーのための自動売買ロボットやテクニカル指標を備えており、 ターミナルから直接利用することができます。
MQL5.community支払いシステムはMetaTraderサービス上のトランザクションのためにMQL5.comサイトに登録したすべてのユーザーに利用可能です。WebMoney、PayPal または銀行カードを使っての入金や出金が可能です。
取引の機会を逃しています。
- 無料取引アプリ
- 8千を超えるシグナルをコピー
- 金融ニュースで金融マーケットを探索
新規登録
ログイン