YouTubeにあるマーケットチュートリアルビデオをご覧ください
ロボットや指標を購入する
仮想ホスティングで
EAを実行
EAを実行
ロボットや指標を購入前にテストする
マーケットで収入を得る
販売のためにプロダクトをプレゼンテーションする方法
MetaTrader 4のための無料のエキスパートアドバイザーとインディケータ - 17

This indicator displays Stochastic osc signals on the price chart and allows the user to receive notifications of such signals. The Stochastic indicator is a classic and proven indicator of the technical analysis of the markets. Despite its age, it is still relevant today. Depending on the settings, the indicator allows you to work effectively on various TFs and any markets. Signals are given on fully formed bars and are not redrawn.
Custom Parameters: Stochastic_Price (0-1) - The applied pric
FREE

The indicator is a 15-minute signal indicator for all types of traders. Meaning, you could make lots of profits trading two different signals in one indicator.
NOTE: Both indicators are channels for achieving the same result. RED ARROW -- Sell Signal BLUE ARROW -- Buy Signal
Purchase now to be part of our community. We offer standard chart setups for both novice and intermediate traders. Trade with ease!
FREE

Master Candle (MC) Indicator automatically detects "Master Candles", also known as "Mother Candles", i.e. candle that engulf several candles that follow them. See screenshots. You can choose how many candles Master Candle should engulf. By default it is set to 4. Feel free to change colour and thickness of lines as it suites you.
I find this indicator to be very useful to identify congestions and breakouts, especially on 60 minutes charts. Usually if you see candle closing above or below "Mast
FREE
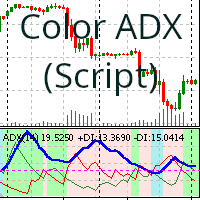
平均方向指数 (ADX) 指標の背景を買いまたは売りのトレンドに応じて色付けする (ドラッグアンドドロップ) スクリプト
平均方向指数 (ADX) 指標は、トレンドの強さを測定するために使用されるテクニカル指標です。この (ドラッグアンドドロップ) スクリプトは、買いまたは売りのトレンドに応じて ADX 指標の背景を色付けします。背景色は、スクリプトのパラメータによって決まります。 変更可能なパラメータ: Period: ADX 指標の期間。 Level: トレンドが強気か弱気かをフィルタリングするために満たす必要がある最小レベル (デフォルトは 0)。 Apply To: (Close price, Open price, High price, Low price, Median price, Typical price, Weighted price)。 Color Positive Trend: 強気トレンドの背景色。 Color Negative Trend: 弱気トレンドの背景色。 Color Neutral Trend: 中立トレンドの背景色。 Save variabl
FREE

The purpose of this new version of the MT4 standard indicator provided in your platform is to display in a sub-window multiple timeframes of the same indicator. See the example shown in the picture below. But the display isn’t like a simple MTF indicator. This is the real display of the indicator on its timeframe. Here's the options available in the FFx indicator: Select the timeframes to be displayed (M1 to Monthly) Define the width (number of bars) for each timeframe box Alert pop up/sound/ema
FREE

株式取引を次のレベルに引き上げたいとお考えですか?
そのスマートなアルゴリズムとエキスパートの注文により、常にゲームの先を行くことができます。 上昇相場と下降相場から利益を上げ、トレンドを簡単に予測し、投資ポートフォリオを常に把握する - Stock Flow なら、それがすべて可能です!
インプットとアウトプットの注文は、どの MT4 プラットフォームでも見られる 2 つのインジケーター (MACD シグナル、モメンタム インジケーター、マネー フロー インデックス インジケーター) の組み合わせによって与えられます。
指標には、最高の純利益になるように最適な組み合わせで調整された期間とレベルの値があります。
また、ストップロスとテイクプロフィットが含まれており、ボラティリティが高まる時期に資本のセキュリティをもたらします。
エキスパートは、2021 年 1 月 1 日から 2023 年 1 月までの GBPUSD M30 履歴データでテストされました (MT4 での 2 年間のバックテスト)。
ダウンロードして自分でテストしてください。
Metatra
FREE

Welcome to Phoenix EA Generator MQL4! Welcome to the freedom of setting the rules and creating your own EA. Our mission is to provide you the tools you need to build your winning strategy. If you are tired of using EAs with unknown algorithms, if you have trading ideas you want to build, test and optimize, if you want an EA that is only watching the market and notifying you when certain conditions are met - than Phoenix EA Generator is the EA you are looking for. The EA has 2 modes : "Make trade
FREE
Forex and Gold OBI is an innovative indicator based on a study of price and market dynamics, utilizing the RSI indicator. This indicator helps you find the best moment to enter the forex market by signaling when the market is in overbought or oversold conditions. Moreover, The indicator calculates two possible targets and the stop loss for each trade, allowing you to optimize your risk/reward ratio. Price This indicator is easy to use and set up, working with any currency pair and timeframe. If
FREE

This is a free version of the EA TrendSurfer OsMa https://www.mql5.com/en/market/product/104264 TrendSurfer OsMa receives signals from a technical analysis of in-built MetaTrader 4 indicator Oscillator of a Moving Average (OsMA) and then implements The Quantum Forex Trading System to generate positive results. Discover: The Quantum Forex Trading System _Mastering the Market with Advanced Algorithms & Multifaceted Strategies_ --- Redefining Forex Trading: In the vast realm of forex, wh
FREE

This indicator uses Bollinger Bands lines to detect markets trend. It's a very useful tool for manual trading. Furthermore it is possible to use the indicator with ATR as a filter , as well as the option to pop up an alert when a reverse trend occurs. The readings are very simple to use and understand. Indicator works best on H1 timeframe.
You can to get source code from here .
Parameters BarsCount - How many bars used to show the line. BBperiod - Period of Bollinger Bands. BBdeviations - De
FREE
Tipu Panel series is set of innovative indicators created to consolidate indicators in form of a panel. As a trader, indicators can easily create a cluster on the chart and distract you from the bigger picture. It can also be overwhelming and visually exhausting. Tipu Panel simplifies this by displaying each indicator in a beautifully boxed panel. You can customize the panel to display indicator signals for multiple time frames and also to quickly switch time frames. There are two types of indic
FREE

Suitable for multi time frame market direction prediction. Green and red color indicate the buy and sell call respectively. Green indicator is denote buy call and Red indicator denote the sell call. push notification is available to send instant message to you when green or red indicator will be appear. you have to activate the option at the time of mapping this indicator to you chart
FREE

Principles of construction of the indicator. The Absolute Bands (AB) indicator is reminiscent of the Bollinger Bands indicator with its appearance and functions, but only more effective for trading due to the significantly smaller number of false signals issued to them. This effectiveness of the Absolute Bands indicator is due to its robust nature. In the Bollinger Bands indicator, on both sides of the moving average - Ma, there are lines spaced from Ma by the standa
FREE

The indicator displays two Moving Average lines on the chart with parameters specified in the settings. It issues a signal in the form of arrows and a sound at the intersection of these Moving Average. In the indicator settings, you can set the period of fast Moving Average ( Fast MA Period ) and slow Moving Average ( Slow MA Period ). And also Shift, Applied Price, Method and Timeframe for two Moving Averages separately. Important:
The main difference from oth
FREE

Local_Timeは、チャート下部に指定の時差または、自動計算された時差でオリジナルの時間目盛りを追加します。
時間目盛りには、「DD.MM hh:mm」「DD MMM hh:mm」「MM-DD hh:mm」「MM/DD hh:mm」「DD hh:mm」「hh:mm」などなど対数のフォーマットに対応しています。
時差計算の必要性がない方でも、標準の時間目盛を消して、この時間目盛でサーバー時間の表示形式を変えるだけで、チャートの見やすさがアップするでしょう。
また、この日時バーよりも下にサブウインドウが作られてしまった場合は、赤いバーが表示されクリックすると最下部に移動する機能も付いています。
表示イメージは、スクリーンショットをご覧ください。
how to use
https://www.mql5.com/en/blogs/post/752455
FREE

Channels indicator does not repaint as its based on projecting the falling and raising channels. As a trader you need a path to be able to place your buy and sell trades such as: Supply and Demand , Falling & raising channels. Falling and raising channels can be in any time frame and also can be in all time frames at the same time and the price always flows within these channels. Experienced trades will draw the key levels and channels around the timeframes. But, they will not be able to draw
FREE

Diversify the risk in your trading account by combining our Expert Advisors. Build your own custom trading system here: Simple Forex Trading Strategies
The expert advisor opens trades when EMAs cross and the Average Directional Index is above 25. The Stop Loss, Take Profit, and Trailing Stop are calculated based on the ATR indicator. The recommended currency pair is GBPAUD. The recommended timeframe to operate and to do backtests is D1. This Expert Advisor can be profitable in any TimeFrame
FREE

This is a forex supporting tool for all manual traders.
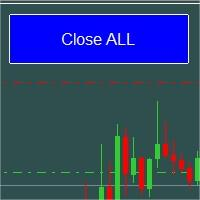
You can close positions immediately at once on the MT4 Terminal by a single click. CLOSE SELL: You can close SHORT positions of the target currency pair (same as the chart you’re using this EA). CLOSE BUY: Same as above but LONG positions will be closed. CLOSE ALL: All opened positions will be closed (no matter of currency pairs). You can select the closing method from CLOSE ALL or CLOSE ONE BY ONE. You can choose the positions to be close
FREE

EZ Risk Reward Ratio is a simple to use MT4 indicator that allows the user to automatically change the Risk Reward Ratio of an open trade simply by dragging the Take Profit or Stop Loss lines to desired positions on any chart. Risk to reward ratio is displayed in whichever corner you choose and can be changed by dragging TP and SL lines.
First, place the EZ Risk Reward Ratio indicator on the MT4 chart. Second, open a trade on the MT4 chart. EZ Risk Reward Ratio works on any currency pair and
FREE

移動平均は移動中に変化します。 インジケータは、移動平均を計算する期間を自動的に選択します。 動きの方向性が高いほど、平均化期間は長くなります。 トレンドが遅くなると、移動平均の期間が減少し、より速くなります。 これは傾向の変更により速く反応することを可能にする。
この指標は、トレンドまたはトレンド反転ポイントでうまく機能します。 横方向では、速い動きのあるものが遅いものを上に横切るときなど、インジケータは逆の方法で使用することができます-これは売りシグナルです。 または、チャネルを使用しておおよその購入ゾーンまたは販売ゾーンを決定することもできます。 チャンネル表示は、設定で有効にすることができます。
パラメータ:
自動計算のためのバー-このバー数について、インジケータは極端を検出し、最後の極端な時間に応じて移動平均の期間を計算します。
乗数-移動平均の差を設定します。
速度-ある期間から別の期間への移動平均の移行率を変更します。
channel-チャンネル表示を有効または無効にします。
インターフェイスの利便性のために他の設定もあります。
移動
FREE

The Pivot Point indicator automatically calculates and displays the pivot point line and support and resistance levels. Pivot can be calculated according to the Classic, Floor, Fibonacci, Woodie, Camarilla or DeMark formula. It is also possible to select the period for calculating the indicator. A trader can choose from daily, weekly, monthly, or user-defined periods.
Types of pivots Classic Floor Fibonacci Woodie Camarilla DeMark
Main features The indicator shows the current and histor
FREE

Diversify the risk in your trading account by combining our Expert Advisors. Build your own custom trading system here: Simple Forex Trading Strategies
The expert advisor opens trades after CCI indicator exit the oversold or overbought areas. The Stop Loss, Take Profit, and Trailing Stop are calculated based on the ATR indicator. The recommended currency pair is GBPUSD and the recommended timeframe to operate and to do backtests is D1. This Expert Advisor can be profitable in any TimeFrame
FREE

Fibonacci SR Indicator
This indicator creates support and resistance lines. This indicator is based on Fibonacci Retracement and Extension levels. It will consider many combinations of the Fibonacci levels and draw support/resistance lines based on these. This indicator uses tops and bottoms drawn by the ZigZag indicator in its calculations. The ZigZag can also be drawn on the chart, if necessary. The indicator considers many combinations of past reversal points and Fibonacci ratio levels, and
FREE

POWERFUL CANDLE USES THE TREND WAVE INDICATOR AND IT CAN IDENTIFY THE BEGINNING AND THE END OF A NEW WAVE TREND MOVEMENT.
AS AN OSCILLATOR, THE INDICATOR IDENTIFIES THE OVERBOUGHT AND OVERSOLD ZONES.
IT WORKS GREAT TO CATCH THE SHORT TERM PRICE REVERSALS AND USES A MARTINGALE STRATEGY TO CLOSE ALL TRADES IN PROFIT.
USE DEFAULT SETTINGS ON H1 OR HIGHER TIME FRAME ON ANY PAIR FOR MORE ACCURATE TRADES
WHY THIS EA :
Smart entries calculated by 4 great strategies The EA can be run on even
FREE

This indicator is not only for trading but also for learning, thanks to it, you can learn to identify trend, support and resistance.
You've probably heard about the Dow trend theory, where higher highs and higher lows indicate an uptrend, and lower highs and lower lows indicate a downtrend. This indicator determines this trend based on the Dow Theory. You just need to enter a number representing the number of candles between extremes. The optimal solution is the number 3 (H1 TF), unless you
FREE

The Volume Weighted ATR indicator is a helpful tool for measuring market activity. It is based on the idea of the Volume-Weighted ATR. Combining these two elements helps identify potential turning points or breakout opportunities. The indicator for the classification of the activity of the market uses the moving average and its multiples. Accordingly, where the VWATR bar is located (relative to the moving average), it is labelled as ultra-low, low, average, high, very high or ultra high. Th
FREE

Super Channels indicator is a channel indicator created by calculating support and resistance levels. It calculates by taking the average of support and resistance levels. After determining the number of candles, it takes the levels of the number of candles and creates an autonomous channel according to these levels. If you want to calculate how many candles, you must enter the number in the parameter section. Also, there are two types of modes in the indicator. The first is to calculate based o
FREE

Double Breakout is an automatic expert advisor with two separate strateges that uses martingale. The MACD indicator with adjustable parameters is used as inputs for each flow of orders. The specified takeprofit and stoploss levels are used to exit the position. General recommendation
The minimum recommended deposit is 1000 cents. Spread is recommended not more than 3 points. It is better to use trend currency pairs. The martingale parameter can be set from 0.1 to any value. When martingale
FREE

Blahtech Moving Average indicator is a multitimeframe version of the standard Moving Average indicator. It is also enhanced with customisable alerts, period breaks and other configuration options. The 50 day and 200 day moving averages are widely followed by investors and traders, with breaks above and below the MA lines considered to be signals of interest. Links [ Install | Update | Training | All Products ]
Feature Highlights Up to three timeframes Configurable calculation variab
FREE
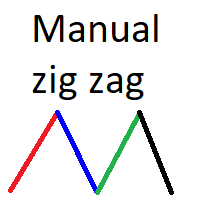
Manual Zig-zag allows you to build a zig-zag with the mouse, to build it is necessary to turn on the zig-zag and left-click. The file must be placed in the \ MQL4 \ Indicators folder then in the terminal from the list of indicators put it on the chart.
A zigzag can be built so that this zigzag can only be seen on the current time frame or in all halves at once.
You can change the color and thickness of the line while on the chart without getting into the settings.
You can quickly remove e
FREE

The indicator draws lines the the price highs and lows. Break through the high or low usually indicates trend change (or continuation). Once the price moves through a line, and the candlestick closes, the indicator draws an appropriate arrow (also, you can enable alerts). A deal should be conducted in the breakthrough direction immediately or after a slight rollback. It is best to trade following the trend on a larger timeframe. This indicator is easy to use, but nevertheless, there are many tra
FREE
Please leave 5 Stars to me
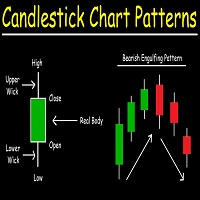
Candlestick Patterns Scanner is professional indicator that will assist and alert you to identify candlestick patterns on meta trader 4 charts whenever a pattern appears on the chart. In financial technical analysis , a candlestick pattern is a movement in prices shown graphically on a candlestick chart that some believe can predict a particular market movement. The recognition of the pattern is subjective and programs that are used for charting have to
FREE

FTUイディオテック このインジケーターはMT4プラットフォーム用で、単独で使用できますが、他のインジケーターや戦略と組み合わせるのが最適です。 macd、adxなどの様々なインジケーターを組み合わせて矢印を描き、エントリーやトレンド転換を示唆 YouTube で短い紹介ビデオをご覧ください: https://youtu.be/lCRJ3mFNyOQ インジケーターの特徴: 矢印の販売と購入 視覚と音による警告 トレンド継続 / 早期トレンド転換シグナル 新機能: 履歴内のバーの数を制限する バーから矢印までの距離を変更する 使用法: このインジケーターは、ほとんどの資産グループ、外国為替、商品、指数などで使用できます。 すべてのタイムフレーム、再描画なし、高速読み込み 私の FTU Predictor と組み合わせると、確実に優位性が得られます。 いくつかのアドバイス: 資金管理と規律が鍵であり、単一の戦略や指標が成功をもたらすことはありません。損失は発生するものであり、それをどのように回復するかを理解することが重要です。小さな勝ったり負けたりして、市場に恩返しすることがすべての日
FREE
Vanesa RSI Reverse provides an amazing trading strategy. Use optimization function of Strategy Tester in MetaTrader 4 to find out many high potential parameter sets in very long term of history data (more than 2 years). The EA works well with XAUUSD in M15 but it also give similar results in others symbols and time frame. It just takes some minutes to try it out in your own history data to see the very good performance. We will continue to improve the strategy to get better performance in next v
FREE

This indicator mostly inspired from BW-ZoneTrade custom indicator from MT5. How To Use:
BUY when both dots colored Green. SELL when both dots colored Red. In addition to original one, MACD-OsMA-generated signal also can be drawn. Input Description:
MA_period_short: Faster EMA period for MACD. Applied when drawMACD is true. MA_period_long: Slower EMA period for MACD. Applied when drawMACD is true. MACDperiod: MA period for MACD. Applied when drawMACD is true. drawMACD: When true, draw an addi
FREE

About Waddah Multimeter (free): This product is based on the WAExplosion Indicator. It helps identify explosive market trends and potential trading opportunities. Waddah Multi-meter (Multi-timeframe) Check out the detailed product post here for scanner and multimeter both: https://www.mql5.com/en/blogs/post/758020
Please note that scanner is paid and multimeter is free.
Features: Waddah Trend Direction Trend Strength (above/below explosion line or deadzone) Trend Explosion Alert Alignment al
FREE

ITS FREE I Recommend www.CoinexxBroker.com as a great broker and the one I personally use Asia session 1:00 to 9:00 (6pm est to 2 am est) Eur means London Session 10:00 to 18:00 (3 am est to 11 am est) USA means New York Session 15:00 to 23:00 (8 am est to 4 pm est) Session indicator highlights the start of each trading session. You can show all sessions or edit the settings to only show the hours you want highlighted (Asia) means Asian Session ,(Eur) means London Session , (USA) means New
FREE
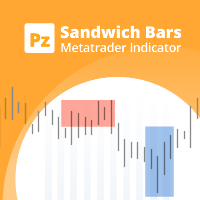
This indicator detects Sandwich Bars of several ranges, an extremely reliable breakout pattern. A sandwich setup consists on a single bar that engulfs several past bars, breaking and rejecting the complete price range. [ Installation Guide | Update Guide | Troubleshooting | FAQ | All Products ] Easy and effective usage Customizable bar ranges Customizable color selections The indicator implements visual/mail/push/sound alerts The indicator does not repaint or backpaint The indicator could not b
FREE

Investment Castle Support and Resistance Indicator has the following features: 1. Dictates the direction of Buy or Sell trades based on Support and Resistance Levels automatically . 2. Candles stick colors will change to Red for Sell and Blue for Buy (Default settings, user can change from the inputs). 3. This indicator is built-in the Support & Resistance based Investment Castle EA which works with Psychological Key Levels "Support & Resistance".
FREE

The Expert Advisor of the Forex Fraus is designed for scalping the EURUSD (for five-digit quotes) and adapted for the accounts with fast execution of orders.
Operation Principle When a signal is received, the orders are opened by accumulation using tick data; The robot does not apply indicators and other analytical systems. The signals are calculated using H1 and M1 chart processing results; The EA has three operation modes; Normal : uses the filter for trend trading; Turbo : uses the filter t
FREE

究極の取引指標である Constant Grow を使用して、取引口座の一貫した成長の秘密を解き明かしましょう。 RVI シグナル、移動平均、出来高、ストキャスティクス、アリゲーターなどの高度な指標の組み合わせを利用したこの革新的なツールは、その有効性を確保するために 2 年間 (2021 ~ 2023 年) にわたって綿密にバックテストが行われています。
Constant Grow を使用すると、リスクを最小限に抑えながらアカウント残高を保護および拡大できるようになります。 当社の専門アドバイザーが資金管理のあらゆる側面を担当し、お客様が収益性の高い取引を行うことに集中できるようにします。 利用可能なポジションに固定ロットサイズを設定するだけで、残りの作業は GBPJPY H1 エキスパートにお任せください。
複雑な設定や推測を心配する必要はありません。 Constant Grow は、あらゆる通貨ペアとシームレスに連携し、独自の機能を活用して最大の収益性を実現するように設計されています。 トレーディング ゲームを強化し、比類のない成功を体験するこの機会をお見逃しなく。 C
FREE
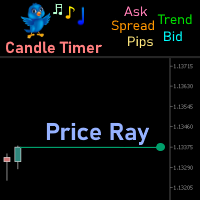
Price Ray indicator is a utility that will improve the way you trade. Primarily, it shows the Bid, Ask or Last price as a line ray which beams till the current candle, last visible chart candle or extended to all candle bars. The enhanced features in this indicator provide information in an area where you focus most, right next to the current candle. You can select text to be shown above or below the Price ray. The indicator is fully customizable, allowing it to fit any strategy requirements. Th
FREE

The Heikin Ashi indicator is our version of the Heikin Ashi chart. Unlike competitor products, this indicator offers extensive options for calculating Heikin Ashi candles. In addition, it can be displayed as a classic or smoothed version.
The indicator can calculate Heikin Ashi with moving average by four methods: SMA - Simple Moving Average SMMA - Smoothed Moving Average EMA - Exponential Moving Average LWMA - Linear Weighted Moving Average
Main features The indicator shows Heikin
FREE

スタイルが重要だから
キャンドルの色や背景の明暗を変えたり、グリッドを付けたり消したりするために、いちいちプロパティをクリックするのが面倒なのはよくわかります。ここでは、1つのクリックで解決策です。 トレーダーが望むキャンドルのスタイルを選択するための3つのカスタマイズ可能なボタン。 昼と夜のモードを切り替えるには、1つのボタン。 チャート上のグリッドを表示または非表示にするには、1つのボタン。 ***** 設定で、ボタンを画面上のどこに表示するかを選択できます*****。
私の他の製品をチェックすることを検討してください https://www.mql5.com/en/users/javimorales.fer/seller
MT5 VERSIONを確認する: https://www.mql5.com/en/market/product/69070
RSIインジケーターとは何ですか?
RSIは、0から100まで測定できるオシレーターとして表示されます。この指標は、J. Welles Wilder Jr.によって開発され、彼の代表的な1978年の著書 "New C
FREE

このモジュールは、Practice Simulator と同期して、チャートの時間と位置の情報を表示します。同じ通貨ペアだけでなく、さまざまな時間枠や異なる通貨ペアの同期チャートも表示します。
注: このモジュールは単独では機能しません。 「 Practice Simulator 」が必要です。
Practice Simulator
https://www.mql5.com/ja/market/product/98348
2 つの同期モードが利用可能です。
簡易同期モード:
同期したいチャートを開いてこのツールを挿入することで、同期されたチャートを簡単に作成できます。
チャートが指定した位置に移動され、部分的に非表示になります。 そのため、チャートがチャート シフトやサブウィンドウなどに表示される場合があります。
アクティブ同期モード:
オフライン チャートを使用して、同期用のチャートを作成します。
このプロセスはより複雑ですが、ライブ チャートとほぼ同じように機能します。
詳しい設定情報につい
FREE
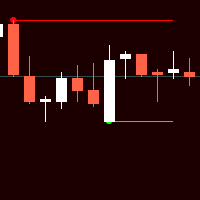
Индикатор Форекс и бинарных опционов основан на простых паттернах из двух свечей. Стрелки вообще не рисуют. Даже при смене таймфреймов.
В настройках можно включить или отключить линию уровня.
Также в настройках можно менять коды стрел, их цвета (также цвета линии уровней), Размер и расстояние от свечи (баров).
Индикатор прост в применении. А настройки тоже не сложные. Единственно не рекомендуется увеличивать период (step). По умолчанию прописано 500. Больше этого уже загружает терминал.
FREE

MACD is well known indicator that still can be use for prediction where price will go next few minutes, hours or even weekly With colored bar of Macd, your eyes can easily catch when color is changed based what market price movement to find any early trend on market. here is the parameter of the indicator: TF_MACD , default is 1 Hour , this mean you can see clearly MACD of 1 Hour TimeFrame on Lower TimeFrame. InpPrice , default is Price Close , this is original MACD parameter from Metaquotes st
FREE

If you trade or wish to trade the popular HLHB Trend-Catcher System, then this indicator is for you! It detects when the HLHB system entry rules are met and sends out an alert in the form of notifications to your mobile phone and to your pc. By automatically sending you notifications, this indicator lessens your trading work load as you don't have to sit in from of your pc all day checking all the chats for when the entry rules are met. This indicator does all the dirty work for you. When the si
FREE
Expert Advisor Features trailing profit in the deposit currency (Trailing Stop Money) closing by a profit or loss in the deposit currency opening orders at a specified time managing positions opened manually or by another Expert Advisor calculating initial lot based on the current balance limiting the maximum lot volume choosing trading type several types and methods of averaging visually displays the current breakeven price, draws horizontal lines "Line break even BUY"-blue, "Line break even
FREE
The Wave Scalper EA is fully automated scalping system that uses price action to identify good scalping trades and executes them with an invisible trailing stop loss. It also includes a money management feature which calculates lot size based on account size and risk with an option to set a maximum draw down at which the EA will stop trading. This is a long term strategy combined with money management which works well on most pairs, but predominantly GBPUSD, USDCAD, EURUSD, AUDUSD & USDJPY. Plea
FREE
阳线开多,阴线开空! 阳线开多,阴线开空! 阳线开多,阴线开空!
阳线开多,阴线开空! 阳线开多,阴线开空!
阳线开多,阴线开空! 阳线开多,阴线开空! 阳线开多,阴线开空! 阳线开多,阴线开空!
阳线开多,阴线开空! 阳线开多,阴线开空!
阳线开多,阴线开空! 阳线开多,阴线开空! 阳线开多,阴线开空! 阳线开多,阴线开空!
阳线开多,阴线开空! 阳线开多,阴线开空!
阳线开多,阴线开空! 阳线开多,阴线开空! 阳线开多,阴线开空! 阳线开多,阴线开空!
阳线开多,阴线开空! 阳线开多,阴线开空!
阳线开多,阴线开空! 阳线开多,阴线开空! 阳线开多,阴线开空! 阳线开多,阴线开空!
阳线开多,阴线开空! 阳线开多,阴线开空!
阳线开多,阴线开空!
FREE

The Awesome Oscillator (AO) Signal Candle Indicator is an indicator used to measure market momentum. Awesome Oscillator (AO) Signal Candle Indicator will change bar's color when set overbought or oversold levels reach. Colored Candles, based on Awesome Oscillator (AO) Signal.
-If the indicator is above zero, the market is bullish. -If the indicator is below zero, the market is bearish. -If the market is bullish, you can take a stand with green candle signals. -If the market is bearish,
FREE

This is an unconventional version of the Heiken Ashi Smoothed indicator implemented as lines rather than a histogram. Unlike a usual histogram, the indicator draws the readings of the two moving averages in the form of colored lines.
Example If the candle crosses two indicator lines upwards, a trend is assumed to be changing from bearish to bullish. If the candle crosses two indicator lines downwards, a trend is assumed to be changing from bullish to bearish. The indicator is good at displayin
FREE
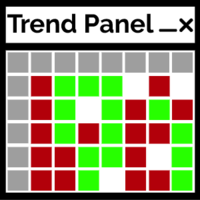
トレンドパネルは、ユーザーが選択した10ペアを使用して、時間枠M1〜D1の確認されたトレンド方向を表示するシンプルで便利なツールです。 インディケータは、任意の戦略/テンプレートに方向性の確認を追加するように設計されており、チャートを別のペアまたは時間枠にすばやく変更するためのクリーンなインタラクティブインターフェイスとしても機能します。 グループチャット: https://www.mql5.com/en/users/conorstephenson セットアップのアドバイスと無料のエキスパートアドバイザーについては、購入後に私に連絡してください! 私の製品はMQL5でのみ販売されています 。この製品を他の場所で見た場合、それは模倣品です。だまされてはいけません。 主な機能
チャート上のパネルをきれいにして、時間枠の傾向をすばやく判断できるようにします。 インタラクティブ機能。 チャート上のキャンドルの色を変更します-現在と過去のトレンドを簡単に確認できます。 ペアと時間枠のボタンはクリックすると機能し、現在開いているチャートを変更します。 チャートのパネルをクリックして、テンプレート
FREE

This is a simple Bollinger Band EA This works by activating a trade whenever the input parameters are met, including the Bollinger Band parameters The Bollinger Band Parameters determines when a buy or sell trade is opened: If the price is outside the lower bounds of the activated bollinger bands, a buy trade is opened (given that all other criteria are met) If the price is outside the upper bounds of the activated bollinger bands, a selltrade is opened (given that all other criteria are met)
FREE

It is an indicator which notifies via push notification when an order is closed by Take Profit/Stop Loss It indicates via pc alert and or mobile alert Psychologically you can hold order for long time If stop loss hunting happens you can re-enter with same direction If real break out happens you can reverse the position Overall it Alerts when position reach stop - loss or take-profit level
FREE

A simple but effective helper that will allow you to track both global and local market trends. The indicator combines the work of two oscillators: Stochastic and RSI. Both indicators can be set to any timeframe.
Advantages of Use Multitimeframe - you can adjust both indicators to the desired timeframes. To obtain the entry points, you can use the Elder's triple screen system. Highly customizable - you can configure not only the parameters of the indicators, but also their appearance (color an
FREE

This indicator is designed to find the difference in RSI price and indicator. This indicator shows the price and indicator difference on the screen. The user is alerted with the alert sending feature. Our Popular Products Super Oscillator HC Cross Signal Super Cross Trend Strong Trend Super Signal
Parameters divergenceDepth - Depth of 2nd ref. point search RSI_Period - Second calculation period indAppliedPrice - Applied price of indicator indMAMethod - MA calculation method findExtInt
FREE
This expert advisors trades donchian breakouts according to Bill Williams's definition of "Trading in the Zone". It uses alligator to find strong trends, AC and AO to identify trading zones and MACD to avoid trading exhausted trends. [ Installation Guide | Update Guide | Troubleshooting | FAQ | All Products ] Easy to use and supervise Fully configurable indicator settings Customizable break-even, stop-loss, take-profit and trailing-stop settings Works for ECN/Non-ECN brokers and 2-3-4-5 digit s
FREE

The selective pin bar is designed to identify reversals. To use the selective pin bar effectively, traders typically look for Strong Rejection: The tail of the pin bar should extend significantly beyond the surrounding price action. It indicates that there was a sharp rejection of higher or lower prices during the trading period. A strong rejection suggests that the market sentiment may be changing.
FREE

the AK CAP toolbox free to use;
it includes the same indicators we use for our daily trading and we think the simpler the better. Lightweight indicator for use on all timeframes. that includes VWAP with vwap value indicator on top right. 3 EMA: FAST, MEDIUM, SLOW the candle timer to show how much time left in a candle.
colors and positions are fully customizable.
enjoy
FREE

In a departure from the conventional approach, traders can leverage the bearish engulfing candlestick pattern as a buy signal for short-term mean reversion trades. Here's how this alternative strategy unfolds: The bearish engulfing pattern, (typically signaling a reversal of bullish momentum) , is interpreted differently in this context. Instead of viewing it as a precursor to further downward movement, we perceive it as an indication of a potential short-term bounce or mean reversion in prices.
FREE
アドバイザー アシスタント「Breakeven quick stop loss」は、トレーダーが利益を維持し、リスクを軽減するのに役立つように設計されたツールです。このツールは、損益分岐点を迅速かつ確実に設定し、手動でもトレーディング アドバイザーを使用しても、取引中に大きな損失を回避できます。トロールとは異なり、SL は移動せず、オープン ポジションをロールバックまたはトレンドの急激な変化から保護するだけです。相場が変化する速度のため、これを手動で行うことは非常に困難です。これは、ブレイクアウト戦略を使用するトレーダーにとって特にありがたいものです。
デフォルト設定では、損益分岐点は 3 ポイントに設定されています。価格が目的の方向に 15 ポイントを超えるとすぐに、保護 SL がトリガーされます。標準 TP もインストールされています。
このプログラムを使用すると、トレーダーは、市場が突然変化した場合でも、預金が保護されることを確信できます。「Breakeven quick stop loss」を使用すると、損益分岐点を特定のレベルに設定して、損失を最小限に抑え、トレーダ
FREE

このスクリプトを使用すると、トレンド ライン、フィボナッチ リトレースメントなど、あらゆる種類の描画オブジェクトを 1 つ以上の他のチャートにコピーできます。
デフォルトでは、スクリプトは現在のチャート (スクリプトが適用されたチャート) のすべてのオブジェクトを、現在ロードされている同じシンボルの他のチャートにコピーします。
設定
目的地の時間枠 PERIOD_CURRENT 以外に設定すると、スクリプトが適用されたチャートと同じシンボルの開いているチャートにオブジェクトがコピーされます。 値を特定の時間枠、たとえば PERIOD_D1 に設定すると、同じ銘柄と期間のチャートのみが更新されます。 CopyObjectsOfType これをコピーしたい特定のタイプのオブジェクトに設定すると、そのタイプのオブジェクトのみが他のチャートにコピーされます。 CopyIndicatorWindowObjects True に設定すると、インジケータ ウィンドウのオブジェクトもコピーされます。これは、ソース チャートと同じ指標を同じ順序で持つ 2 番目のチャートに依存します。
FREE

親愛なる友人、ご清聴ありがとうございました。 異なる通貨ペアの動きが相互に関連していることを観察したい場合は、インジケーター Visual Correlation に注目してください。 異なる通貨ペアの動きは相互に関連しています。 Visual Correlation インジケーターを使用すると、スケールを維持しながら 1 つのチャート上にさまざまな金融商品を表示できます。 正の相関、負の相関、または相関なしを定義できます。
親愛なる友人、あなたは、いくつかの楽器が他の楽器よりも先に動くことをご存知でしょう。 このような瞬間は、グラフを重ね合わせることで判断できます。
親愛なる友人へ、チャート上に商品を表示するには、Symbol フィールドに商品名を入力する必要があります。 Version for MT5 https://www.mql5.com/ja/market/product/109155
FREE

The indicator is completely based on the classic MFI indicator. I recommend watching my advisor - Night Zen EA
It contains two basic trading strategies: The output of the MFI line from overbought/oversold zones. The entry of the MFI line into the overbought/oversold zones. Arrows are drawn after confirming the signal by strategies and are not redrawn.
Alerts are also registered: Alerts Push notifications to the mobile terminal email Settings: MFI period - the period of the MFI indicator L
FREE

The indicator is specially designed for the trading utility Trade Shell (included Trade Shell SMC ) to get it working on visual strategy tester.
Backtest your trading ideas and indicators. Run Trade Shell on visual tester and then put this indicator on the chart. After that you will be able to control all functions of the Trade Shell as well as with live using! It does not work live! Use it with visual tester only. It does not require to set any setting on input parameters.
Have a good luc
FREE

After purchasing, you can request and receive any two of my products for free!
После покупки вы можете запросить и получить два любых моих продукта бесплатно! Fully automated trading algorithm Golden Scanner. The advisor is easy to use! Install it on the timeframe chart (M1) with the attached settings in the discussion . Working symbol XAUUSD (GOLD), Timeframe - (M1), Minimum deposit - $100. The EA does not have: Recommended settings martingale grid averaging methods Always protected by fixed
FREE

Indicador "Trade Zones: Supply and Demand Opportunities" para MetaTrader: Eleva tu Trading con Precisión Estratégica El indicador "Trade Zones: Supply and Demand Opportunities" es una herramienta revolucionaria diseñada para potenciar la toma de decisiones de los traders al identificar claramente las zonas de oportunidad basadas en los principios fundamentales de oferta y demanda. Este indicador, compatible con MetaTrader, proporciona una visión intuitiva de las áreas críticas del mercado donde
FREE

There are many candlestick patterns but only a few are actually worth knowing. Candlestick Pattern Filter detects and marks the most reliable candlestick patterns. Remember that these patterns are only useful when you understand what is happening in each pattern. They should be combined with other forms of technical analysis for best result. These patterns are included: Hammer / Hanging Man Inverted Hammer / Shooting Star Bullish / Bearish Engulfing Piercing Line / Dark Cloud Cover Morning Star
FREE
MetaTraderプラットフォームのためのアプリのストアであるMetaTraderアプリストアで自動売買ロボットを購入する方法をご覧ください。
MQL5.community支払いシステムでは、PayPalや銀行カードおよび人気の支払いシステムを通してトランザクションをすることができます。ご満足いただけるように購入前に自動売買ロボットをテストすることを強くお勧めします。
取引の機会を逃しています。
- 無料取引アプリ
- 8千を超えるシグナルをコピー
- 金融ニュースで金融マーケットを探索
新規登録
ログイン