YouTubeにあるマーケットチュートリアルビデオをご覧ください
ロボットや指標を購入する
仮想ホスティングで
EAを実行
EAを実行
ロボットや指標を購入前にテストする
マーケットで収入を得る
販売のためにプロダクトをプレゼンテーションする方法
MetaTrader 4のための無料のエキスパートアドバイザーとインディケータ - 40
Moving average cross over notification !
How to use Add NotifyMaCross indicator into the chart. Set Moving average line one and two. Wait the notification when moving average cross over Support for development : https://www.buymeacoffee.com/itwetrade
Check out all indicator and expert advisor here https://www.mql5.com/en/users/thanksmybot/seller ------------------------------------- Como usar
Adicione o indicador NotifyMaCross ao gráfico.
Defina a linha média móvel um e dois.
FREE

Auto Close & Delete All is an assistant to help you quickly close all trades of a selected symbol or all symbols and delete pending orders. Through its flexible settings, you can set the script to either close only trades, or only pending orders, or both market trades and pending orders. The script can close deals and delete pending orders wither for the current instrument, or for all instruments. This is selected in settings. The settings are displayed on the screen before the script execution,
FREE

Check my paid tools they work great and I share Ea's based on them for free please r ate
The Dual Timeframe RSI (Relative Strength Index) indicator is a novel trading tool that allows traders to monitor RSI readings from two different timeframes on a single chart. This dual perspective enables traders to identify potential trend confirmations and divergences more effectively. For instance, a trader might use a 1-hour RSI alongside a daily RSI to ensure that short-term trades align with the bro
FREE

FusionAlert StochRSI Master is an indicator available for MT4/MT5 platforms, it is a combination of RSI & Stochastic indicator which provide "alerts" when the market is inside "overbought and oversold" regions combined for both indicators, results in more precise and accurate signals to be used as a wonderful tool, in the form of "buy or sell" signals. This indicator comes with many customization options mentioned in the parameter section below, user can customise these parameters as needful. Jo
FREE

Currency Explorer is the absolute tool for traders that want to know with quantified certainty the currency strength & weakness of each currency and to trade these by using applicable strategies. Our machine learning models run and provide the strength/weakness of each currency based on multiple factors besides price action. It provides the trader with a QUANTIFIED result for the strength of the 8 most popular and major currencies (EUR, USD, JPY, GBP, AUD, NZD, CAD and CHF) with a scale from 0-1
FREE

NEW : integration with Ofir Signals to send personalized alerts Ofir Notify is a tool which send alerts on trades to Telegram Alert on any event concerning a position : Opening, Closing, modification (SL, TP) Send alerts to Chats, Groups and Channel Alert on Equity change Display Risk, Reward and progress of profit/lost for each position Customization of alerts Sending charts screenshots with alerts Send signals from your indicators or experts Multi-lingual NEW : version 2 brings integratio
FREE

The indicator searches for the largest candles with minimum wicks for the last X candles. Sometimes, such candles mark the presence of a strong buyer, who quickly and strongly pushes the price in the right direction. However, most often, these are culmination candles, especially at the end of a prolonged trend when a single large candle knocks out stop losses of the most persistent traders and the price reverses instantly. The indicator allows you to open a position on the very edge of the marke
FREE

---> Check all the other products <---
The Multi Time Frame Chandelier Channel is a good synthesis of the chandelier trailing stop and let you analyze the trend.
Enter when the price breaks one of the two lines, then trail using the opposite line. Ideal for scalping, entering after the dot appears.
Plenty of customization: Choose the lookback period, the longer, the slower Choose the Time Frame to use (must be greater or equal your chart TF Play around with the options to get the
FREE
The presented indicator marks signals on the price chart with arrows in accordance with the data of the FATL Momentum AM indicator. The indicator gives a signal and sends a notification to the mobile terminal and email. The FATL Momentum AM indicator is the difference between the current price and the price some number of periods ago. The difference from the classic indicator Momentum is the preliminary smoothing of prices by an adaptive digital filter - FATL. Confirmation of the indicator signa
FREE

An indicator in the form of a panel for collecting statistics on spreads from a specified list of pairs. It is enough to open one chart and set an indicator to collect statistics for all specified pairs.
After completion of work, the panel writes values to a file, which allows not to interrupt statistics after completion of work.
Input parameters:
-Interval to update the spread for pairs (sec) Allows you to specify how often to collect statistics (allows you to reduce the load) -List of p
FREE

Introducing Momentum Jurik—an innovative indicator designed to optimize your forex trading strategy by incorporating custom moving averages based on the Momentum indicator with the MetaTrader 4 indicator, Momentum.
Jurik moving averages are renowned for their precision and reliability in analyzing price movements in the forex market. They provide traders with smoother representations of price action, reducing noise and offering clearer signals for identifying trends and potential reversals.
FREE

Introducing RSI Jurik—an innovative indicator designed to revolutionize your forex trading strategy by combining custom moving averages based on the Relative Strength Index (RSI) with the MetaTrader 4 indicator, RSI.
Jurik moving averages are renowned for their accuracy and reliability in analyzing price movements in the forex market. They provide traders with smoother representations of price action, reducing noise and offering clearer signals for identifying trends and potential reversals.
FREE

Just a panel for drawing levels. Minimal but very useful thing. This is a reimagining of Color Levels Pro. ---- 4 types of customized levels. support for rectangle and line levels. The indicator parameters are very simple and are divided into blocks. For any update idea please contact me here. ---- don't suffer don't suffer ---- Enjoy your work!!!!!!!! ----
FREE

基于股票软件黄金线指标改编。可根据需要调整参数值。具体使用规则请参考相关股票软件说明。 ////////////////////////////////////////////////////////////////////////////////////////// //股票公式源码如下:
VAR1:=(HIGH+LOW+OPEN+CLOSE)/4;
黄金线:EMA(3*VAR1-2*SMA(VAR1,2,1),13); //////////////////////////////////////////////////////////////////////////////////////////
声明 1 指标计算均基于价格变化而来, 不保证使用此指标的盈利性,作者不对使用此指标的任何损益负责。 2 本指标免费使用。
FREE

"Forex Super Robot AIB is a free robot that anyone can easily trade with. By simply attaching it to the EURUSD H1 chart, your life will be rosy from today on. This robot was created to fulfill your dreams. Please enjoy. The robot will make multiple entries, with a default of 20 orders. These orders will be closed together. The initial settings are TP=50 and SL=50, so please find the best settings for yourself."
FREE

M ulti Cross Alert! on your smartphone. Use multiple indicators to get a crossover signal on chart as well as on MetaTrader app. You can use all crossovers at the same time but it is not recommended cause your chart will look messy. Instead use combination of two indicators which will be better. IMP NOTE:- More indicators will be added in future updates. Any suggestions regarding indicators are welcome! Indicators List: 1. MA (Cross) 2. RSI (OB/OS) 3. MACD Lines (Main Line & Signal Line Cross)
FREE

PanelTool Button Click trading (Replace Default Trade Panel)
Features
01. Button Click open or close Long positions
02. Button Click open or close Short positions
03. Set Lot sizes
04. Set SL or TP points
05. Set order's commentment
06. Show BreakEven price
07. Show Long or Short Lots
08. Show Profit or Loss USD
09. Show Daily Profit or Loss USD
10. Set ID=0 to handle manual orders together
FREE

Trading is about waiting for the right time. This indicator was created to know what is happening on our charts without having to cover the screen with indicators. In addition, it has several types of alerts that allow us to dedicate our time to other things until something interesting happens. You can use multiple alarms at the same time. It is not a problem.
By default AlterAlert offers us alerts when the following indicators give us a signal:
Moving average (MA crosses) Stochastic Oscill
FREE
Description PirDpo is a mean reversion trading robot that works only LONG. It can be used on several indexes like sp500, dow jones 30, eurostoxx 50, dax 30, etc., on a daily timeframe. It basically applies this algorithm: Calculate detrended price with this formula detrend = (close - simple_moving_average(length))/simple_moving_average(length) if detrend <= min(detrend,length) the BUY SELL after timeExit days Key Features Absence of dangerous algorithms. It works just when the bar is closed. Ea
FREE

この指標は、前月の始値、高値、安値、終値を今月の低い時間枠でプロットします。
これらのレベルは良いサポートとレジスタンスレベルとして機能します。
時間価格の大部分はレベル内で変動します。
価格がこれらのレベルに達するのを待って、それに従って行動してください。
レベルの合流点に特に注意してください。
私の観察によると、Close(White)レベルが他のレベルとコンフルエントになっている場合は、脱落またはバウンスの可能性が高いです。
前の月にスクロールして、理解を深めるためにこれらのレベルで価格アクションを観察します。
入力パラメータ
入力パラメータなし
オープン=カラースプリンググリーン
高=カラーマゼンタ
低=カラーダークカーキ
閉じる=カラーホワイト
指標をお楽しみください。
FREE

This is a demo version of Telegram Signal Utility . In this version, messages are sent only about opening / closing positions. Utility Full version Description A utility that sends text messages from MetaTrader to Telegram . The information transmitted relates to trading activity on the account:
Opening \ closing deals; Placing \ deleting pending orders; Modification of Stop Loss \ Take Profit \ pending order prices; Triggering Stop Loss \ Take Profit; Pending order activation. It does not
FREE

このEAは、マーケットの変動に関係せず安定したトレードをできるようにデザインされました。
M5のタイムフレームが最適です。上位足H1とH4の価格の変更を計算して、大きくトレンドが発生した後に、価格が戻されるタイミングを見てEntryします。
takeprofit と stoplossはあえて、広めに設定しておくのがコツです。1日1回のトレードにはちょうど良いですね。
そして、もし1回のトレードが負けてしまった場合、ロットサイズを2倍で再トレードの機会を待ちます。
もしトレードがtake profitでクローズした場合は、その日のトレードは終わりです。
また次の日になるまでEAは停止します。
今まで、数多くのトレードを重ねて大きなドローダウンや損失を出してきた反省からこのEAはつくられました。
初期設定ではtakeprofit =40pip, stoploss =40pipsの設定にしてありますが、最適な値に調整してください。
また、stoplossでオーダーがクローズした場合の次のロットサイズの倍率も変更可能です。
安定した利益をコツコツ重ねて大きな夢をつかみまし
FREE

I present an effective tool for determining the reversal on the H4 timeframe. The indicator is installed on the M30 chart. All parameters are already set. Proper use of the indicator: Unfortunately, the test in the tester will not give a correct idea about the indicator, so the rent for one month is as affordable as possible. You do not need to install the file on a remote server. Install it
FREE

The MAtrio indicator displays three moving averages on any timeframe at once with a period of 50-day, 100-day, 200-day. After attaching to the chart, it immediately displays three moving averages with the parameters of simple (SMA) moving average SmoothingType50 , simple (SMA) moving average SmoothingType100 , simple (SMA) moving average SmoothingType200 . Accordingly, with the price type ValuePrices50, ValuePrices100, ValuePrices200 , by default, the price is Close price everywhere. All parame
FREE

This classic "old school" MAGIC MACD indicator gives you the cross of the parameters you set. Standart setting is (12,26,9) . The arrows give you a possible change of trend. Be careful and do not use this indicator as a single signal source.
FREE version Please feel free to check out our other REX indicator series. We do have other free indicators.
"OLD BUT GOLD"
FREE

The purpose of this new version of the MT4 standard indicator provided in your platform is to display in a sub-window multiple timeframes of the same indicator. See the example shown in the picture below. But the display isn’t like a simple MTF indicator. This is the real display of the indicator on its timeframe. Here's the options available in the FFx indicator: Select the timeframes to be displayed (M1 to Monthly) Define the width (number of bars) for each timeframe box Alert pop up/sound/ema
FREE
The purpose of this new version of the MT4 standard indicator provided in your platform is to display in a sub-window multiple timeframes of the same indicator. See the example shown in the picture below. But the display isn’t like a simple MTF indicator. This is the real display of the indicator on its timeframe. Here's the options available in the FFx indicator: Select the timeframes to be displayed (M1 to Monthly) Define the width (number of bars) for each timeframe box Alert pop up/sound/ema
FREE

Footmarks Pro Footmarks Pro is a MetaTrader 4 Essential Indicator that create round number or sweetspot on chart with "Button". Parameter Indicator Name - Footmarks Pro Pair Selection - 250 points / 500 points / 1000 points Sweetspot Setting Sweetspot Line Color Sweetspot Line Style Sweetspot Line Thickness Sweetspot Button Setting Button Axis-X Button Axis-Y Thanks...
FREE
This indicator allows to hide Bollinger Bands (on all MT4 timeframes) from a date define by the user, with a vertical line (Alone) or a panel (with "Hidden Candles"). Indicator Inputs: Period Deviations Shift Apply To Color Style Width Information on "Bollinger Bands" indicator is available here: https://www.metatrader4.com/en/trading-platform/help/analytics/tech_indicators/bollinger_bands ************************************************************* Hey traders!! Give me your feeds! We are
FREE

The FxSProWPR oscillator generates signals for trend confirmation, which can also nbe used to confirm the emergence of new trends.
Indicator Parameters NumberBars - the number of bars to display the indicator. Too many bars may significantly slow down the operation of the trading terminal. SignalAlert - an Alert notifying of a trend. SignalSound - sound alert to notify of a trend. The sound will be played once the histogram exceeds the level of 15.
Rules to confirm position entry Green histo
FREE
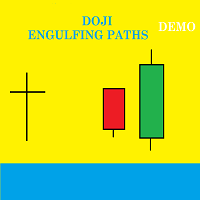
Presentation Doji Engulfing Paths enables to get signals and data about the doji and the engulfing patterns on charts. It makes it possible to get opportunities from trends, and to follow the directional moves to get some profits on the forex and stocks markets. It is a good advantage to take all the appearing opportunities with reversal signals and direct signals in order to obtain some profits on the forex market. With the demo version, only the signals starting with the 20th candle or bar are
FREE

この製品は、手動で開かれた各取引、特にそれが接続されているチャート上で自動ストップロスを設定できるように設計されていることに注意してください。 未決注文に関しては、未決注文が有効化された後にのみストップロスが設定されます。 希望のストップロスをポイント単位で設定するには、InpStopLossPoints パラメーターを使用できます。
この商品はGBPUSDなどの通貨ペアのみでテストされていることに注意してください。 他のシンボルでも機能する可能性がありますが、テストされていないため、目的に応じて機能するかどうかを判断するのはあなた次第です。 この製品にはいかなるクレームや権利も与えられないため、実際の口座ではなくデモ口座で製品をテストすることをお勧めします。
この製品を使用するかどうかは完全にお客様の判断によるものであり、弊社ではいかなる保証も提供できません。 この MT4 エキスパートには、開かれたすべての取引ではなく、適用されるチャートに基づいて作業する追加機能が組み込まれました。
Google翻訳
FREE

This indicator alerts you when indicator-created lines are "touched" by price, You can change the interval between alerts. You can change colors and styles of lines as you want. However, lines must be named "Upper" and "Lower.
There is a more powerful PRO version .
Input Parameters WaitTime: Interval between alarm.
How To Use Place lines wherever you want to add alarms.
FREE

A utility for automatically detecting the GMT offset of your broker To use the utility, place it in the Scripts folder of the terminal data directory, enable WebRequest in the terminal settings and add the address https://www.worldtimeserver.com/ to the list of allowed ones. Run the Check GMT script on the chart with any currency pair There is only one setting in the script: site = https://www.worldtimeserver.com/ just for your convenience. Copy this address from the script setti
FREE

Gain Guard MT4
secures the profits of all or selected trades on one terminal or on several terminals with the same account number. The selection can be configured according to Magic numbers and/or symbols, so that the Magic numbers and/or symbols that are not selected remain unconsidered. What is it useful for? For example, when several experts trade on one terminal and manual trading also takes place. Experts have different strategies and SL/TP. In particular, some experts let the trades run
FREE

This indicator is a histogram showing the trend based on 3 different moving averages. When all averages are set in ascending order, the indicator is green, and when in descending order, it is red. If the averages do not show a trend, the color is yellow. Additionally, each average can have different settings, such as Mode MA and Price MA. You can also set an alert and receive notifications on your phone.
To enable the alert and push notification, you need to activate them first in the MT4 setti
FREE
This indicator gives the highest and lowest information of the currency you have selected and the day you selected. It also shows the average. In this way, you can find out the profit / loss probability of your transactions for the same days. Reported: Average points per week Average points per year Lifetime average points Note: It does not provide you with buy / sell signals. Shows average points only
FREE
Добрый День, Всем. Решил выложить свой индикатор, предложить на просмотр. Я трейдер, Вадим Сергеевич Лепехо. Индикатор не стандартный, сделан не по канонам. Индикатор рисует маржинальные зоны на графике, пока полет нормальный. Но строит зоны по индикатору AO(Awesom) конкретней по фрактальным зонам индикатора AO. Зоны стандартные 1/4, 1/4, и НКЗ. Пример привожу по EURUSD + в картинках. На данный момент 14.10.23 - нкз=1920 пипсов(192 пункта) предлагаю преобразить до 192пипсов(19.8пунктов). Поясняю
FREE

This indicators when combine with its slave version can help you a better view in backtesting visual mode. https://www.mql5.com/en/market/product/61574 They will help you in developing a multi time frame trading strategy. 1) Run backtest in visual mode 2) Add the master indicator to the backtesting chart 3) Add the slave indicators to other charts of the same symbol with different time frames. Run the backtest and you will see all the charts auto scrolling.
FREE

Robot basado en indicadores para realizar operaciones de forma tendencial. Ideal para cuentas de cualquier capital, como un balance mínimo de 100$ Funciona con cualquier Timeframe. El bróker recomendado es Swissquote. Si desea utilizar el robot le recomendamos que se ponga en contacto con nosotros para asesorarle en la mejor configuración posible del sistema.
FREE
Introduction and Description The commodity channel index (CCI) is an oscillator originally introduced by Donald Lambert in 1980. Since its introduction, the indicator has grown in popularity and is now a very common tool for traders in identifying cyclical trends not only in commodities but also equities and currencies. The CCI can be adjusted to the timeframe of the market traded on by changing the averaging period. CCI indicator with different colors at levels 0, 100 and -100. The cross is a
FREE

Use this indicator to ensure all your open charts are constantly displaying the same time frame. Change the time frame in any one chart and watch the others instantly change to the same time frame. Also allows scrolling of candles in one chart to be replicated in all other synchronized charts. Analyze correlation between different symbols by linking charts together on the same time frame Display a vertical marker move across all your open charts, so you can quickly compare price action at the sa
FREE

Active Price Lines
Indicator gives you full custom control over the Bid and Ask price lines, both color and style. Color control is also customizable based on increased or decreased price by the tick.
Options include: Show both the Bid line and the Ask line Set unique color for each Set unique line style for each Set unique color for increased price (by the tick) Show only Bid line Show only Ask line
Rider Capital Group
FREE

EUR INDEX
The Currency Index Project is ONE part of a thorough Forex study. Many people do not know the theoretical basis that drives currency exchange rates to move on the market. With this set of tools you will be able to have a more complete view of the entire market by analyzing not only the single currency of an exchange, but all the exchange rates that make up that currency by looking at a single window!
The indicator faithfully represents the real index of a single currency present in
FREE

Smart Trend Line Alert Demo is a unique professional Trend Line, Support Line and Resistance Line Touch and Break out Alert with awesome Alert History feature, designed to help traders easily manage many charts and symbols without staring at the monitor. Note: This a Demo version operating only on USDCHF . Full version link: https://www.mql5.com/en/market/product/3085
Features Candle Break Out Alert, Price Touch Alert and Time Line Alert; 1 click for converting any drawn line into an alert lin
FREE

The EVO Exclusive EA Lite EA is based on support/resistance level breakthroughs. It works autonomously on a VPS server. The EA passed testing on real ticks. Pro or ECN accounts with Market Execution are required for correct operation. The Expert Advisor controls the spread and slippage, thereby protecting your capital from risks. No martingale, no grid, no hedging. The EA applies stop loss, take profit and trailing stop. This is a free version. Not all functions operable! The free version has a
FREE

複数の時間枠での移動平均線の交差。
従来のトレンド戦略は、日次のような 1 つの時間枠を選択してトレンドを推定することですが、このエキスパート アドバイザーは、5M から月次までのすべての時間枠が同じトレンドを示したときに、トレンドの方向に取引を開始します。
SINGLE_CURRENCY = true、単一通貨での操作を許可します。無効 (FALSE) の場合、メタトレーダーのマーケット ウォッチ ウィンドウで選択された通貨を取引します。
CONCURRENT_ORDERS=0、同時に開かれる複数の注文の数を制限します。
PIPS=100、利益PIPS
DODDFRANK_COMPLAINCE = false、米国ベースのアカウントで取引する場合、FIFO 違反の受信を防ぐために FIFO を有効にする必要がありますか?
LOTS=-1、LOTs パラメーターが 0 未満 (または負) の場合、ロット サイズは、アカウントの資産 (残高ではなく) $100 USD ごとに 0.01 ロットに基づく内
FREE

The Stochastic Basket Currency Strenght brings the Stochastic indicator to a new level. Expanding the boundaries of TimeFrames and mono-currency analysis, the SBCS take the movements of each currency that composes the cross and confront them in the whole basket of 7 crosses. The indicator works with any combination of AUD, CAD, CHF, EUR, GBP, JPY, NZD, USD pairs and with full automation takes in account every stochastic value (main line) for the selected Time Frame. After that, the indica
FREE
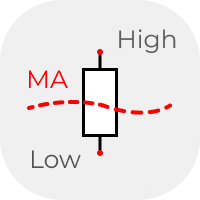
The classic idea of comparing the size of candles. Above / below - the average for a certain period. Usually used on D1, W1 and higher timeframes in candlestick analysis patterns. But you can also use the data from the indicator in your analysis system. The data is presented as a histogram in a separate window. The averaging method can be selected in the settings.
FREE
The script changes the timeframe of all open charts on the MetaTrader platform in a simple click without having to do it manually by going through all the open charts and changing them one by one, it is handy when there are many open charts. The script lets you choose which timeframe to apply to the open charts. The timeframes available in the dropdown menu are the ones already available on the MetaTrader platform : M1, M5, M15, M30, H1, H4, D1, W1, MN1.
FREE

Msg2Lineはテキストボックスからフリーテキストやキャプチャを「LINE Messenger」に送信します。 グラフに線やマーク、コメントを書くと画像が送信されます。 自分宛またはグループ宛に送ることができます。とても便利でシンプルなツールです。 - フリーメッセージの送信
1. 編集ボックスにフリーテキストを入力します。 2. 送信ボタンを押します。
- フリーメッセージ+画像キャプチャの送信
1. 編集ボックスにテキストを入力します。 2. w/imgボタンを押します。
- キャプチャ画像の送信
1. w/IMGボタンを押すだけです。
*パラメータとしてLINE TOKENが必要です。 *このツールは「WebRequest」を使用
これは単純な機能ですが、LINEユーザーにとって便利なツールになるでしょう。
FREE

The purpose of this new version of the MT4 standard indicator provided in your platform is to display in a sub-window multiple timeframes of the same indicator. See the example shown in the picture below. But the display isn’t like a simple MTF indicator. This is the real display of the indicator on its timeframe. Here's the options available in the FFx indicator: Select the timeframes to be displayed (M1 to Monthly) Define the width (number of bars) for each timeframe box Alert pop up/sound/ema
FREE

Acceleration/Deceleration Technical Indicator (AC) measures acceleration and deceleration of the current driving force. This indicator will change direction before any changes in the driving force, which, it its turn, will change its direction before the price. If you realize that Acceleration/Deceleration is a signal of an earlier warning, it gives you evident advantages. But, a classical AC indicator does not include any input parameter. In the source file we can see that this indicator are us
FREE

RSI Bands is a powerful indicator which displays an upper and lower band corresponding to the RSI overbought and oversold levels. The band shows what price must be reached during that specific candle in order for the RSI overbought/oversold level to be reached. This is an extremely useful tool for spotting when a trend has begun and when a trend is about to end. The indicator provides buffers, allowing you to use it in your own Expert Advisor. Please message me if you have any questions.
CURRE
FREE
Use Forex Trading Profit Tracker to keep a record of your earnings across accounts. This indicator will show a dashboard in the Meta Trader chart to show for the profit or loss money in your account. It’s easy to see just how much money you’re making matched betting with the Forex Trading Profit Tracker. Key features: Track your profit over time Check out your stats. Track expected profits against actual profits. Export account history to Excel.
MT5 version(*): https://www.mql5.com/en/market
FREE

Moving Average Convergence Divergence (MACD) Signal Input parameters: signal mode: set it to true if you want to plug it into STAT (Signal Tester and Trader) arrow shift: distance between fast EMA line to arrow on chart standard entry mode for MACD fast EMA period slow EMA period MACD period MACD price method Standard Entry mode: buy when slow EMA cross and close above fast EMA while above the 0 line sell when fast EMA cross and close above slow EMA while below 0 line You can find the best set
FREE

Fassi Fassi is optimized EA for EURJPY M15. This robot opens trades by level Breakout. And uses Stops to exit. Use EA on M15 Time Frame. Lot size. (0.01/USD100) The EA also can be used on different currency. The EA does not trade many deals. Better to use on ECN broker. Back-test EA before use. And do a forward test on demo account before using on Real money. And do not forget, always invest only the amount you are prepared to lose. You miss 100% of the shots you don't take.
Monitoring Accoun
FREE

The indicator plots an affine chart for the current instrument by subtracting the trend component from the price. When launched, creates a trend line in the main window. Position this line in the desired direction. The indicator plots an affine chart according to the specified trend.
Input parameters Maximum number of pictured bars - the maximum number of displayed bars. Trend line name - name of the trend line. Trend line color - color of the trend line. Black candle color - color of a bullis
FREE

Scientific Calculator is a script designed to compute expressions of science, engineering and mathematics.
General Description
The expression to calculate must obey syntax rules and precedence order, being constituted by the following elements: Integer and real numbers. Mathematical operators for addition (+), subtraction (-), multiplication (*), division (/) and exponentiation (^). Mathematical and trigonometric functions . Curved parentheses (()) to define the precedence and c
FREE

どうもこんにちは! 私は日本の個人投資家のタツロンです。FXで10億円以上運用していました。 そこで、私が使っていてとても便利なインディケータをご紹介しましょう。
相場の基軸となるインディケーター。 ThreeLine(スリーライン)は、移動平均線(SMA)を改良し長期のSMAの数値設定に答えを出しました。 日々のトレードや検証を繰り返すほど、このThreeLineの信頼感は増していくことでしょう。 ThreeLineの角度が上向きなら白くなります。下向きならそれぞれの色です。 視野的にも上げ、下げ、がわかりやすいので、相場の環境も一目で確認できます。
長期用の移動平均線(SMA)の数値はどのように設定すればよいのか。 そういった悩みから解放されます。 ブレイクアウト手法や、カウンタートレンドも狙いやすいです。 トレード、インディケータの基本でもあるSMAはこの ThreeLineにお任せください。
日本語のスクリーンショットのサポートが必要な場合は、 こちら をご覧ください。 実際にインディケータが動いている動画もありますのでご確認ください。 ThreeLineは1:12
FREE

バランスエントリー by VArmadA
シンプルでありながら強力なフラクタルベースの支持/抵抗インジケータ
1H以上のタイムフレームで動作し、すべての主要なペアでテストされています。シグナルに注意してください。長いか短いエントリを示す矢印。
それはどのように動作します。
矢印は、サポート/レジスタンスを反転させたことを示しています。上矢印はロングを意味します - 下矢印はショート取引を示しています。
インストラクション.
- インジケータロング/インジケータショート:与えられたインジケータの矢印の色を選択します。
- 抵抗レベルを表示します。エントリーシグナルを決定するために使用される抵抗レベルを視覚化します。
- サポートレベルを表示します。エントリーシグナルを決定するために使用されるサポートレベルを視覚化します。
FREE

このユーティリティは、いくつかのアクションを自動化する必要があるトレーダーに役立ちます。次の機能を実行できます。
TakeProfitレベルを設定します。 ストップロスレベルを設定します。 StopLossを損益分岐点に転送します。 トレーリングストップを使用してストップロスを転送します。 このユーティリティには次の入力パラメーターがあります。
TakeProfit-TPレベル。 StopLoss-SLレベル。 TrailingStop-トレーリングストップを使用しない場合は、0に設定します。値が正の場合、トレーリングストップに使用されます。負の値を設定すると、SLが適切なレベルに達したときに損益分岐点に移動するために使用されます。 ゼロ値のみの変化の兆候-レベルが0に等しい場合にのみレベルを変更します。つまり、レベルを手動で転送する場合、アドバイザーはそれらに触れません。 BuyOrderColor-買い注文のレベルの色。 SellOrderColor-売り注文のレベルの色。 EAはシンプルで使いやすく、不要なコンピューターリソースを消費せず、追加の設定もありません。
FREE

The relative strength index ( RSI ) is a technical indicator used in the analysis of financial markets . It is intended to chart the current and historical strength or weakness of a stock or market based on the closing prices of a recent trading period. The indicator should not be confused with relative strength . The RSI is classified as a momentum oscillator , measuring the velocity and magnitude of price movements. Momentum is the rate of the rise or fall in price. The RSI c
FREE

Candles Size ( Points ) Please leave a review about this product to help other users benefit from it. This simple tool provides crucial insights into current and historical market conditions, helping traders make informed decisions. Identify the longest candlestick over a customizable historical period. This information helps you spot significant price movements. See on YOUTUBE for key features This indicator is compatible with MetaTrader 4 The indicator is easy to install and use, making it
FREE

FREE
Questo indicatore personalizzato per MetaTrader 4 (MT4) genera segnali di acquisto e vendita basati sulla variazione percentuale dell'RSI (Relative Strength Index) rispetto a un periodo specifico. Ecco come funziona in breve:
1. L'indicatore calcola l'RSI per il periodo specificato (`RSI_Period`) e confronta il valore RSI corrente con quello di un numero di barre precedenti (`Bars_Back`).
2. Calcola la variazione percentuale dell'RSI tra i due periodi.
3. Se la variazione percentuale supe
FREE

The Point-Percent Price Channel (PPPC or PP Price Channel) indicator is designed to display on the chart a channel whose width is specified both as a percentage of the current price and in points. Its appearance is presented on slide 1. When the market moves up, the upper border of the channel is built at the price of High candles. In this case, the lower boundary follows the upper one at a strictly specified distance. When the price touches the lower border of the channe
FREE
Simple indicator that shows your history in pips and profit. You can use it to follow your progress on the positions. It shows you the trade progress only for the symbol that the indicator is on and only for your trade history. Label text is updated when order is closed. The text can be displayed on each corner, it is in the parameters.
Basic input parameters: Label color Font size Conrner position Anchor position Note: corner and anchor have to be the same position.
FREE
The indicator shows the High and Low levels of candles for timeframes selected in the settings. It is recommended to use it on smaller timeframes to determine the levels of higher timeframes.
Parameters TYPE_LINE - type of the line (short based on the bar time, or long for the entire chart) ============= TF 1 ============= block of lines for the first timeframe TF_1 - timeframe of the first block of lines Bars_1_from=1 - Bar of the beginning of the line of the corresponding Timeframe. Bars_1
FREE
MetaTraderマーケットはトレーダーのための自動売買ロボットやテクニカル指標を備えており、 ターミナルから直接利用することができます。
MQL5.community支払いシステムはMetaTraderサービス上のトランザクションのためにMQL5.comサイトに登録したすべてのユーザーに利用可能です。WebMoney、PayPal または銀行カードを使っての入金や出金が可能です。
取引の機会を逃しています。
- 無料取引アプリ
- 8千を超えるシグナルをコピー
- 金融ニュースで金融マーケットを探索
新規登録
ログイン