YouTubeにあるマーケットチュートリアルビデオをご覧ください
ロボットや指標を購入する
仮想ホスティングで
EAを実行
EAを実行
ロボットや指標を購入前にテストする
マーケットで収入を得る
販売のためにプロダクトをプレゼンテーションする方法
MetaTrader 4のための無料のエキスパートアドバイザーとインディケータ - 12

A simple and effective trend indicator. It will be a good assistant when trading. A minimum of understandable settings. Put it on a chart and set it up Good to combine with other indicators. I will post another trend indicator soon. The combination of these two indicators gives good results. Works on all timeframes. Suitable for any couple. Experiment, adjust, observe. Filter by higher timeframes.
FREE

The LexusBO indicator is recommended for trading binary options . Signals are generated when the RSI, ADX, CCI indicators cross the customizable levels. The indicator displays signals using "up/down" arrows on the chart. Their values are available in the buffer arrays (buffer with index 0 - "up" arrow, with index 1 - "down" arrow). This makes the indicator easy to use for automated trading through specialized Expert Advisors. The recommended timeframe is M5. The indicator has a built-in counter
FREE
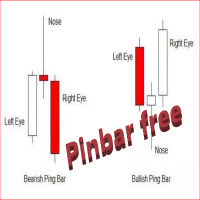
The Free Pin Bar MT4 indicator identifies Pin Bars It will even give you sound or email alerts if want them. If you download it and like it please leave a review! It would be wonderful
Pin Bars are purely based on price action as reflected by the candle formations created by Forex price movements. input Parameters are maximum allowed body/length ratio for the Nose bar. Nose body should be position in top (bottom for bearish pattern) part of the Nose bar. tells the indicator that the Left E
FREE

Two Period RSI compares long-term and short-term RSI lines, and plots a fill between them for improved visualization. Fill is colored differently according to an uptrend (short period RSI above long period RSI) or a downtrend (short period RSI below long period RSI). Short-term RSI crossing long-term RSI adds a more robust trend confirmation signal than using single period RSI alone. This is a small tool to help visualize and confirm RSI trends. We hope you enjoy! Looking for RSI alerts? You can
FREE

The Candle Countdown Timer for MetaTrader 4 (also available for MT5) is a vital indicator designed to help you manage your trading time effectively. It keeps you updated about market open and close times by displaying the remaining time before the current candle closes and a new one forms. This powerful tool enables you to make well-informed trading decisions. Key Features: Asia Range: Comes with an option to extend the range. Broker Time, New York, London Time: Displays the current broker time
FREE
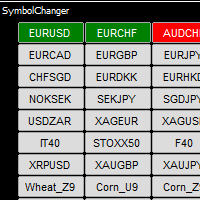
Symbol Chart Changer is an indicator/utility that offers you the option to switch between symbols and timeframes. You can choose any symbol and timeframe on the same chart with just a few clicks. In addition, this indicator also shows the profit of the symbol through the color of the buttons. For MT5: Symbol Chart Changer for MT5 Features
All symbols selected in MarketWatch, that allow you to monitor your favorite instruments on the same chart. Works smoothly on any symbol/instrument, accou
FREE

Automatic trading Advisor .This is a free version of the expert Advisor "Trend Analyzer Pro" https://www.mql5.com/ru/market/product/42792.В the robot is based on 2 strategies: at the intersection of moving averages and Bollinger bands indicator .In the paid version, three strategies are available, which increases profitability several times .Designed for the EURUSD H1 currency pair.It is possible to use it on other tools after optimization.Test only on tick data.
** Does not use such dangerou
FREE

This indicator calculates the volume profile and places labels that correspond to the VAH, VAL and POC levels, for each candle individually.
Indicator operation features The indicator works on the timeframes from M5 to MN, but it uses the history data of smaller periods: M1 - for periods from M5 to H1, M5 - for the H4 period, M30 - for the D1 period, H4 - for the W1 period, D1 - for the MN period. The color and location of the VAL, VAH and POC labels on the current candle are considered to be
FREE

The new era of trading automation is here with Nemiga Prop Scalper! Our robot is not just software; it's a powerful tool that takes your trading strategy to new levels of efficiency and effectiveness. Prop Firm Ready.
Requirements Trading pairs EURUSD,XAUUSD
Timeframe 1H Minimum deposit
$100
Leverage
1:200 Brokers
PRO,ECN,LOW Spread
Features: Advanced Trading Algorithms: Nemiga Prop Scalper is equipped with cutting-edge algorithms that analyze the market in real-time, forecast tre
FREE

Local_Timeは、チャート下部に指定の時差または、自動計算された時差でオリジナルの時間目盛りを追加します。
時間目盛りには、「DD.MM hh:mm」「DD MMM hh:mm」「MM-DD hh:mm」「MM/DD hh:mm」「DD hh:mm」「hh:mm」などなど対数のフォーマットに対応しています。
時差計算の必要性がない方でも、標準の時間目盛を消して、この時間目盛でサーバー時間の表示形式を変えるだけで、チャートの見やすさがアップするでしょう。
また、この日時バーよりも下にサブウインドウが作られてしまった場合は、赤いバーが表示されクリックすると最下部に移動する機能も付いています。
表示イメージは、スクリーンショットをご覧ください。
how to use
https://www.mql5.com/en/blogs/post/752455
FREE

このインジケーターは 1 つのチャートに 2 つの異なるペアを表示し、表示される情報を簡素化するように設計されています。 ターミナルで利用可能なほぼすべての商品(通貨ペアだけでなく、金属や原材料も)を扱うことができます。 あらゆる通貨ペアに対して視覚的な相関手法を使用する機能 サブシンボル。 通貨ペアは色付きのキャンドルで画面に表示されます。 これは同じ相関ペアです。 ミラーリング。 補助通貨。 このインジケーターは 2 種類の相関関係を反映します。
設定
サブシンボル = "USDCHF";
BullBarColor = オレンジレッド;
BearBarColor = 黄色; color GridColor = 白; ミラーリング = false;
The indicator displays two different pairs on one chart, designed to simplify the displayed information, Capable of working with almost all instru
FREE

Fibonacci Retracement object is an object that has been provided by metatrader 4 platform. But Fibonacci Retracement object doesn't automated adjust the chart. You have to put and manage it manually to the chart. Because of that, this indicator was created. If you like using filbonacci retracement indicator, highly recommended to use Automated Fibonacci Retracement Indicator if you want to get better result in here:
https://www.mql5.com/en/market/product/95515
LT Automated Fibonacci Retrace
FREE
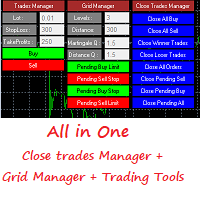
This is a demo version . Download the full version from this link https://www.mql5.com/fr/market/product/84850
Full version Allows you to : Set the number of levels (trades). Lot size and you can do Martingale to raise the lot size for each level. Set distance between levels, and you can manage the distance for each level using Distance Q. Static TP and SL for each level. You can open : BUY STOP / BUY LIMIT / SELL STOP / SELL LIMIT (levels in one click). Close all buy orders. Close all
FREE

Introducing "Forex Mastery Escort EA," a game-changing Expert Advisor (EA) specifically designed for the MQL5 market. This innovative EA combines the power of multiple indicators, including IMA (Intrabar Moving Average), CCI (Commodity Channel Index), and MACD (Moving Average Convergence Divergence), to provide you with unparalleled trading accuracy. Forex Mastery Escort EA leverages a sophisticated algorithm that meticulously analyzes market conditions, taking into account the insights derived
FREE

This indicator is a simple tool to spot a possible trend.
When the ribbon below the price bars, It will turn to Green color and the trend is seen to be bullish When the ribbon above the price bars, it will turn to Red color and the trend is seen to be bearish. It can be used a either Entry Signal Exit Signal or trailing stop, so it is very versatile. By default color : Green is UP trend and Red is Down trend and this work perfect with Bar4Colors.ex4
FREE
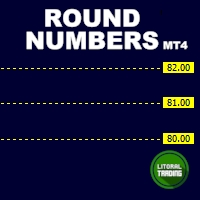
Round numbers (or key levels) is an amazing strategy. These numbers are strong support and resistance levels. So what this indicator does is draw horizontal lines on the chart to help you find these levels. Configurations: 1St level: Color - lines color. Style - lines style. Width - lines width. 2Nd level: Second level lines? - turn off second level lines. Color - lines color. Style - lines style. Width - lines width. Space between lines in points - I don't need explain :) Display at backg
FREE

FREE

This indicator uses the Zigzag indicator to identify swing highs and swing lows in the price chart. Once it has identified the swing highs and swing lows, it can use them to determine potential support and resistance levels. A support level is formed when the price drops and bounces back up from a swing low, indicating that there is buying pressure at that level. A resistance level is formed when the price rises and reverses downward from a swing high, suggesting selling pressure at that leve
FREE

The Multi Trendlines indicator automatically draws the dominant trendlines on the current chart. The indicator looks for the 5 best Up trends and the 5 best Down trends as at the current price, drawing each trendline if filter conditions are met. The trendlines are named "Trendline"+[Direction]+Symbol()+TrendlineSequenceNumber For example: The second Up trendline on a EURUSD chart would be named "TrendlineUpEURUSD2". To get its current value would be: ObjectGet("TrendlineUpEURUSD2",OBJPROP_PRI
FREE

Blahtech Moving Average indicator is a multitimeframe version of the standard Moving Average indicator. It is also enhanced with customisable alerts, period breaks and other configuration options. The 50 day and 200 day moving averages are widely followed by investors and traders, with breaks above and below the MA lines considered to be signals of interest. Links [ Install | Update | Training | All Products ]
Feature Highlights Up to three timeframes Configurable calculation variab
FREE

How To Trade
Execute your trades in 3 Easy Steps!
Step 1: Trade Setup Entry Buy in Line color Blue Touch on line color Red. Entry Sell in Line color Blue Touch on line color Green. Success Rate ≥ 80% 100:20 depend your experience and fast your take. Step 2: Set Stop Loss Stop loss BUY ----> You can not put stoploss with a fixed price, your speed in determining the closing request------>Line color Blue Touch on line color Green. Stop loss SELL ----> You can not put stoploss with a fixed price,
FREE
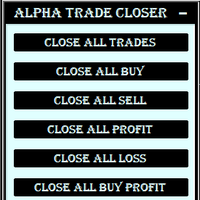
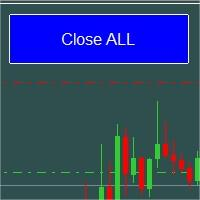
This Utility is created to close Open Trades on the go by filters.
If you want any custom feature or want to remove something from this product for your personal use. Please send me a personal message, I'll be happy to do so for you.
Buttons & their Tasks :
CLOSE ALL TRADES : Close all open trades CLOSE ALL BUY : Close all Buy trades CLOSE ALL SELL : Close all Sell trades CLOSE ALL PROFIT : Close all trades that in Profit CLOSE ALL LOSS
FREE

Basic Theme Builder: チャートカスタマイズを簡単に Basic Theme Builder インジケーターで、MetaTrader 4 のチャート外観のカスタマイズをシンプルに変革しましょう。この直感的なインジケーターは、使いやすいパネルを提供し、さまざまなテーマやカラースキームを簡単に切り替えることができます。これにより、取引環境の視覚的な魅力と機能性が向上します。 Free MT5 version Basic Theme Builder インジケーターは、MetaTrader 4 のチャートを簡単にパーソナライズしたいトレーダーに最適なツールです。シンプルなパネルインターフェースとさまざまなテーマプリセットを使用して、取引スタイルや気分に合わせてチャートの外観をすぐに調整できます。クラシックなルックからモダンな美学まで、多彩なオプションを提供する Basic Theme Builder で、視覚体験を最適化しましょう。 主な機能: 簡単なテーマ管理: 便利なパネルインターフェースを使用して、ワンクリックでチャートのテーマを素早く変更
FREE

This indicator shows us the trend or direction of the market and a possible stop loss
This indicator works with two parameters, period and multiplier. Buy and sell signals are generated when the indicator crosses the closing price and it changes color.
This indicator is used in all types of markets such as stocks, futures, forex, cryptos, additionally it can be used in different time periods: hours, daily, weekly, etc.
It is recommended not to use it while the market is sideways, this can
FREE
This expert is a pure volatility scalper working with two pending orders (buy stop and sell stop). Expert not use any indicator, only use prices action and volatility of price to generate signals. There are three conditions for it to work: Tight spread Fast execution Stop level = 0 Please during the tests of this EA do not simultaneously use another EA in the same terminal because it affects the modification speed. Try expert on demo account first before use it on real one.
FREE
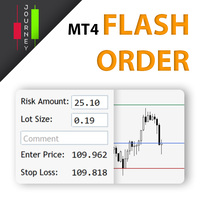
Trading has never been easier! Let's check this out! MT5 version: https://www.mql5.com/en/market/product/72120 The story: How I boost up my trading speed without any "Invalid SL or TP" error
NOW ALL YOU NEED TO DO IS Drag the lines Press Open Order button Enjoy! With this tool, you will no longer have to enter prices manually, which can cause many mistakes and you could miss the trade! From the board, we have: Risk Amount : the risk you want to apply for your trade Risk Unit : USD : If se
FREE

このエキスパートアドバイザー(100%自動)は2つのインジケーターを組み合わせて戦略を作成できます。このバージョンは「ベアバージョン」(BASICバージョン)と呼ばれ、CCIとRSIの2つのインジケーターが含まれています
簡単な個人的なメッセージで私に連絡して、選択した指標と条件を記載したEAの「ベアバージョン」(または優れたバージョン)を要求することができます。テレグラムの連絡先に移動するページの下部。
あなたにぴったりの戦略が見つからない場合、私はあなたのためにそれを作成できます(EAに基づく)
条件は明確に指定されています。
長いエントリー; CCIはレベルラインより高い/低い エントリーショート; CCIはレベルラインより高い/低い Longを終了します。 RSIがレベルラインを上/下に横切る ショートを終了します。 RSIがレベルラインを上/下に横切る テイクプロフィットとストップロスは自由に変更できます 100%自動 このEAには、「スプレッドリミット」と呼ばれる統合機能があります。この機能を使用すると、スプレッドがユーザーが決定した入力以下の場合にのみ市
FREE

Rsi indicator and Stochastic Combined into one indicator , the Supreme StochRsi doesnt repaint / Back-paint / delay. can be used as overbought oversold strategy , or trend following on 50 level cross. if you like this indicator please check my Supreme Trendhisto: here , and my Supreme Diamond indicator : here ========================================================================= Parameters : Stochastic K and D value , Stochastic period Rsi Period Rsi price ====================================
FREE

「GA Moving Average」(「GA 移動平均線」)は、移動平均線クロスオーバー戦略を用いたエキスパートアドバイザー(EA)であり、完璧なトレード戦略を実現するための多くの設定が可能です。
「GA Moving Average」の中心コンセプトは、移動平均線インジケーターを利用して潜在的なトレード機会を特定することです。異なる移動平均線の相互作用を分析することで、このEAは市場での買いシグナルと売りシグナルを生成することを目指しています。
主な特徴とカスタマイズオプション: 1. 移動平均線のパラメーター:トレーダーは、短期と長期の移動平均線の特定の期間を設定できます。これにより、トレーディングスタイルや好みに合わせて柔軟に適応することができます。さまざまな市場条件や時間枠に対応することが可能です。
2. クロスシグナルの生成:EAは、短期移動平均線が長期移動平均線を上回ると買いシグナルが生成され、短期移動平均線が長期移動平均線を下回ると売りシグナルが生成されるよう監視します。これにより、潜在的な買いチャンスや売りチャンスを示します。
3. リスク管理:EA
FREE
HMA Grid EA is a grid system which analyzes trend based on the Hull Moving Average (HMA) indicator. Unlike the Simple Moving Average (SMA) the curve of HMA attempts to give an accurate signal by minimizing lags and improving the smoothness. This EA proposes two trading strategies which combine a slow period HMA to identify the main trend and a short period HMA to identify short trend reversal movement. This combination make usually sell and buy signals accurate and in case if the trend reverse w
FREE

Advantages: Based on classic indicators - ATR, Moving Average Determines the trend / flat in the market by coloring the histogram with the appropriate color Arrows indicate confirmed signals It is an excellent filter for channel strategies (by extremes)
Settings:
Наименование Описание настройки Period of Flat Detector Number of bars / candles for analysis Period of EMA Period of EMA (Moving Average) Period of ATR Period of ATR (current timeframe) Coefficient of deviation Coefficient of devia
FREE

YOU CAN NOW DOWNLOAD FREE VERSIONS OF OUR PAID INDICATORS . IT'S OUR WAY OF GIVING BACK TO THE COMMUNITY ! >>> GO HERE TO DOWNLOAD Most of the time, market reversals / pull backs usually follow volume and price spikes thus these spikes could be the first indication of an exhaustion and possible reversal/pullback. High volume Turns is an indicator that scans the market for price and volume spikes around over-bought/over-sold market conditions. These spikes when spotted serves as the first ind
FREE

In the world of finance, correlation is a statistical measure of how two securities move in relation to each other. Correlations are used in advanced portfolio management. This indicator measures how different securities move in relation to a reference one, thus making portfolio management easier. [ Installation Guide | Update Guide | Troubleshooting | FAQ | All Products ] Avoid concurrent trades in highly correlated instruments Find trading opportunities among highly correlated instruments Cor
FREE

I made this RSI Indicator into multi time frame monitoring to monitor the occurrence of OverBuy and OverSell in real time on one monitor screen. My hope is that this indicator can help friends in the analysis process and also take trading moments with the system that friends have If this indicator is useful, friends can help me by giving likes to my channel and 5 stars on this indicator
Indicator RSI ini saya buat menjadi multi time frame monitoring untuk memantau terjadi nya OverBuy dan
FREE
ADX for majors "インディケータは、外国為替市場で主要通貨ペアの強 度を測定するために使用されるテクニカルツールです。このインディケータは、トレンドの強さとその方向を判断できるADX (Directional Movement Index)に基づいています。
このインディケータは、トレーダーが、ある時点の市場の値動きがどの程度活発かを知るのに役立ちます。さらに、「ADX for majors」は、主要通貨間のリーダーの変化に関する シグナルを提供し、これは取引の意思決定に有用な情報となり得ます。
トレーダーは、このインディケータを使用して、クロス・レートでの取引のエントリー やエグジットのタイミングを判断することができます。
例えば、NZDUSDのリーダー(成長)に関するシグナルを受信したとします。これは、NzdChfを買い、AudNzdを売る必要があることを意味します。 良い取引を! ..
FREE
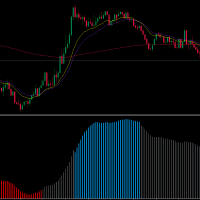
Welcome traders, MA SLOPE SCALPER is a really powerfoul tool to boost up your scalping! Have you been struggling with your scalping Strategies? Have you tried price action? Well, it does not work. Have you tried Rsi - Reversal Strategies? Well it'is not a clever idea. MA SLPOPE SCALPER IS A TREND FOLLOWER SYSTEM MA SLOPE SCALPER is based upon 3 different Exponential Moving averages that have bees studied and selected in order to maximize the precision of the signals! Ma SLOPE SCALPER has an
FREE
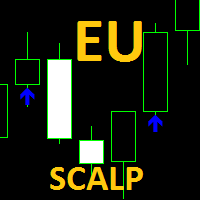
アラート付きのスキャルピングインジケーター:
EU頭皮インジケーターは2つのワーキングセットの組み合わせです。1つは価格変動の方向に逆らって機能するように事前設定されており、2つ目は価格変動またはブレイクアウトが発生する確率に基づいて価格変動の方向に取り組んでいます。重要な貿易レベル。
デフォルト設定は、EurUsdペアM5タイムフレーム用に最適化されています。その他の設定は、最初のコメントの「コメント」セクションにあります。
期待される結果と取引レベルの値を取得したい場合は、チャートにロットziseの推奨事項が表示されます。トレードレベルも線としてチャートに描かれます。
インジケーターは、価格がアクティブな取引レベルの1つに達したときにアラートを送信するように事前設定されており、矢印は買い(青)または売り(赤)を示し、注文を閉じる必要がある場合も示します。注文アラートは、新しいろうそくが表示され、最後のろうそくの本体によって取引レベルが破られた場合にのみアクティブになります。
この指標のように機能するエキスパートアドバイザーは、私の売り手プロファイルにあり、さら
FREE
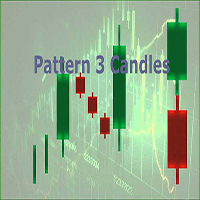
An Expert Advisor based on the 3 candlestick pattern.
1-SL, 2-TP, 3-OFF - 1 pulls up StopLoss. 2 pulls up TakeProfit. 3-disabled.
auto SL / TP on hi-low count bars - number of bars for 1-SL, 2-TP expiration on profit - after passing N bars, TP changes
expiration on loss - after N bars have passed SL to open an order + commission pips for loss expiration - the number of points for expiration on profit
The rest of the settings are intuitive.
FREE

This indicator is one of the useful tools for traders who trade on currency pairs and based on the strength of each currency they can make a correct decision or confirmation in the positions. It has been calculated for all the minor currency pairs supported by the broker and displays the values of the major currencies. These currencies are displayed horizontally or vertically according to the trader's config when executing the indicator. One of the trading strategies that can be used is to cho
FREE
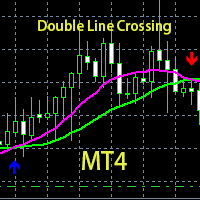
his is a custom indicator based on double-average crossing and arrow marking.
Make multiple lists when blue arrows appear up.
Make a blank list when the red arrow appears down.
When the pink line crosses the green line upwards, the pink line is above, the green line is below, the golden fork appears, and the blue arrow appears.
When the pink line crosses down through the green line, the pink line is below, the green line is above, a dead fork appears, and a red arrow appears.
This is a
FREE
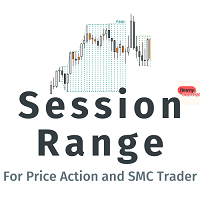
Session Range Highlight インジケーター紹介 Session Range Highlight インジケーターで、外国為替取引の精密な力を解き放ちましょう。このツールは、取引体験をシンプルにすることを目的としており、セッションの高値と安値を手軽に見つける鍵です。 主な特徴: 明瞭なセッションの視覚化: チャート上でセッションの範囲を簡単に識別し、視覚化します。 特定の市場セッション中の重要な価格水準をピンポイントで把握し、トレード戦略を向上させます。 シンプルで洗練されたデザイン: シンプルな美しさ - 当社のインジケーターは洗練されたユーザーフレンドリーなデザインを誇ります。 機能性を損なうことなく、セッションの範囲を視覚的に魅力的に表示します。 簡単にセッションの極値を見つける: 各取引セッション内で最高値と最安値を即座に認識します。 強調表示されたセッションの範囲を一目で見て、情報を基にトレードの決断を行います。 ️ 簡単なカスタマイズ: カスタマイズ可能な設定でインジケーターを自分好みに調整します。 お好みに合わせた色やスタ
FREE

Простой советник основанный на сигналах индикатора Relative Strength Index (RSI) в зоне перекупленности - продаем, в перепроданности - покупаем. Моя версия всем известного "Dynamic". Я рекомендую использовать этот советник в полуавтомате.
Добавляйтесь в друзья, присылайте свои интересные стратегии. Возможно после обсуждения всех нюансов напишу советника бесплатно . Параметры: "_Slippage" - Проскальзывание; "_ M
FREE
阳线开多,阴线开空! 阳线开多,阴线开空! 阳线开多,阴线开空!
阳线开多,阴线开空! 阳线开多,阴线开空!
阳线开多,阴线开空! 阳线开多,阴线开空! 阳线开多,阴线开空! 阳线开多,阴线开空!
阳线开多,阴线开空! 阳线开多,阴线开空!
阳线开多,阴线开空! 阳线开多,阴线开空! 阳线开多,阴线开空! 阳线开多,阴线开空!
阳线开多,阴线开空! 阳线开多,阴线开空!
阳线开多,阴线开空! 阳线开多,阴线开空! 阳线开多,阴线开空! 阳线开多,阴线开空!
阳线开多,阴线开空! 阳线开多,阴线开空!
阳线开多,阴线开空! 阳线开多,阴线开空! 阳线开多,阴线开空! 阳线开多,阴线开空!
阳线开多,阴线开空! 阳线开多,阴线开空!
阳线开多,阴线开空!
FREE

FUNDING DEVIL INDICATOR has been developed by traders for traders and is not another combination out of existing indicators or a "magic, solve all situations" tool.
PASS THE FUNDED ACCOUNTS WITH IT.
It is the answer for beginners and experienced traders about the misleading concepts of the mainstream, causing 90% of retail traders, never making a living out of trading.
Successful traders are "following the smart money" and do NOT try to catch every move from start to end. Consistent trade
FREE

Basic Fibonacci Calculation Indicator
shows Trend, Stoploss, Profit 1,2,3, will show you your daily Highs and your Daily Lows , it will also show you where it expects the price to move to. best time frame is H1 or higher .
For a better system that also includes my Non-repaint Indicator please check out my paid Fibo Indicator https://www.mql5.com/en/market/product/82323
FREE

Expert advisor based on your own personal moving average strategy. Whatever your strategy is, it's him. You can use it on all parities. No restrictions. Settings : Buy Settings 1.Moving Average Period 1.Moving Average Method 2.Moving Average Period 2.Moving Average Period Buy Lot Size Buy Stop Loss Level Buy Take Profit Level
Sell Settings 3.Moving Average Period 3.Moving Average Method 4.Moving Average Period 4.Moving Average Period Sell Lot Size Sell Stop Loss Level Sell Take Profit Level
FREE

The Green Dragon is a strategy that uses the Ichimoku Kinko Hyo system to place trades. The primary element of the Green Dragon is the use of the Chinkou Span as it crosses price action to place trades. This is a classic strategy of the Ichimoku even though its not as popular as some of the other strategies. The Chinkou Span is normally thought of as a market momentum indicator and used to give a trade set up more conviction when analyzing price movement. I find this description somewhat vague a
FREE

中央ピボット範囲レベルは、中央ピボットポイントの周囲に形成されます。
中央ピボットに関連するこれらのレベルは、多数の市場行動と考えられる結果を決定するために使用できます。
中央ピボットからの距離、および前日のレベルと比較して新しいレベルが形成する価格を使用して、次の日のトレンドの方向と強さを決定できます。
セントラルピボットレンジはサポートとレジスタンスとして機能し、ストップロスを置く場所のガイドを提供し、価格の継続的な動き/ブレイクアウトのシグナルを提供します。 グループチャット: https://www.mql5.com/en/users/conorstephenson セットアップのアドバイスと無料のエキスパートアドバイザーについては、購入後に私に連絡してください! 主な機能 追加のピボットポイントとフィボナッチレベルを備えた中央ピボット範囲フォーカスインジケーター。 ピボットポイントを描画します-R1、R2、R3、S1、S2、S3。 フィボナッチレベル-0、0.23、0.38、0.50、0.61、0.78、1を描画します。 アラート機能。 -MT4モバイルアプリを
FREE
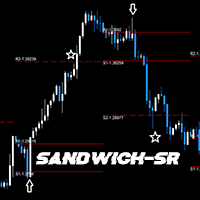
GENERAL DESCRIPTION
Simple SR Projection based on selected instrument's historical data. Best used in conjunction with current market sentiment, and fundamental analysis. Currently limited to selected pairs due to of historical data to project accurate levels.
Generally, for support and resistance, 2 levels are drawn, respectively. The inner levels (R1,S1) project the highs and lows during the opening stages of selected time frame. The outer levels, represent the targets to reach during the c
FREE

A Moving Average (MA) Trading Expert Advisor (EA) for MetaTrader 4 (MT4) is an automated trading system designed to execute trades based on signals generated by one or multiple moving averages. Moving averages are a popular technical analysis tool used to smooth out price data and identify trends. Here's a description of how a Moving Average Trading EA typically operates: Moving Averages Used : The EA utilizes one or more moving averages to generate buy or sell signals. Common choices include t
FREE

MT4 Candlestick Pattern Alert Indicator: Stay Ahead of Trading Opportunities Overview The MT4 Candlestick Pattern Alert Indicator is a robust tool designed to empower traders by detecting candlestick patterns and delivering timely alerts through notifications, emails, and pop-up alerts. This invaluable tool saves traders precious time, allowing focused analysis on patterns and potential profitable trades. Importance of Candlestick Patterns Candlestick patterns are pivotal in technical analysis,
FREE

DEMO version of GoldSuperTrendEA the demo version only works in backtesting.
TestGoldSuperTrendEA uses a strategy that combines RSI and Moving Average.
High winning percentage and a high profit factor make this Expert advisor very profitable.
It was developed for XAUUSD pair.
Setup and tips:
I recommend using a balance of $1500 and an initial lot of of 0.05 with leverage 1:100
Low timeframes are more sensitive to price swings, so it is best to use moving averages and low RSIs to
FREE
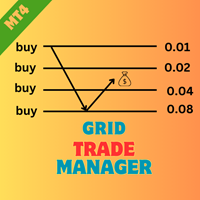
Product Name : Grid Trade Manager Description :
The "Grid Trade Manager" EA is designed to manage trades using a grid trading strategy. It places a series of pending buy and sell orders at predetermined intervals, creating a grid pattern. The EA monitors market movements and adjusts the grid as necessary to maximize potential profits. It also incorporates risk management features to control the grid size and limit potential losses. For detailed documentation Overall Settings/Input Guide High
FREE

Expert description
The Expert Advisor's trading system is based on entry and exit at a certain deviation of the asset price from the moving average value. The Expert Advisor has a number of parameters, by manipulating which you can implement different trading systems and also get different results when trading on different assets, keep this in mind when setting up an Expert Advisor and do not use standard settings on all instruments and time frames.
Recommendations for use
The EA working t
FREE
WHAT IS NEXT MOVE? SIMPLE ANSWER IS, THIS PROGRAM IS BASED ON PRICE ACTION THEREFORE FINDING NEXT MOVE IS EASY TO IDENTIFY THIS PROGRAM IS USING STANDARD CALCULATIONS FOR SUPPORT RESISTANCE IN SHAPE OF 2 WAYS TREND LINES SELECT HORIZONTAL LINES TREND LINES WILL GUIDE TRADERS TO TRADE IN RANGE WITH PIVOT LEVEL ALSO HORIZONTAL LINES GUIDE YOU ABOUT SUPPORT RESISTANCE OF DIFFERENT TIMEFRAMES FOR EXAMPLE: IF TRADER INTERESTED TO TRADE IN 15 MINUTES TIME FRAME, THEN HE CAN SELECT 15 MINUTES IN PR
FREE

The " YK Find Support And Resistance " indicator is a technical analysis tool used to identify key support and resistance levels on a price chart. Its features and functions are as follows:
1. Displays support and resistance levels using arrow lines and colored bands, with resistance in red and support in green.
2. Can be adjusted to calculate and display results from a specified timeframe using the forced_tf variable. If set to 0, it will use the current timeframe of the chart.
3. Uses t
FREE

Moving Along USES THE TREND WAVE INDICATOR AND IT CAN IDENTIFY THE BEGINNING AND THE END OF A NEW WAVE TREND MOVEMENT.
AS AN OSCILLATOR, THE INDICATOR IDENTIFIES THE OVERBOUGHT AND OVERSOLD ZONES.
IT WORKS GREAT TO CATCH THE SHORT TERM PRICE REVERSALS AND USES A MARTINGALE STRATEGY TO CLOSE ALL TRADES IN PROFIT.
USE DEFAULT SETTINGS ON M15 OR HIGHER TIME FRAME ON ANY PAIR FOR MORE ACCURATE TRADES
WHY THIS EA :
Smart entries calculated by 5 great strategies The EA can be run on even a
FREE

Super Channels indicator is a channel indicator created by calculating support and resistance levels. It calculates by taking the average of support and resistance levels. After determining the number of candles, it takes the levels of the number of candles and creates an autonomous channel according to these levels. If you want to calculate how many candles, you must enter the number in the parameter section. Also, there are two types of modes in the indicator. The first is to calculate based o
FREE
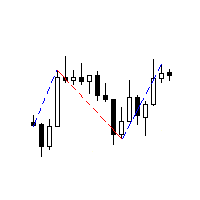
The Expert Advisor receives signals from an artificial neural network that uses the RSI indicator. Trades are closed by the opposite signals. Presence of a signal is checked at the closing of the bar. The EA also has the following functions: changing a position volume in proportion to the change in balance (function for the tester); transfer of unprofitable trades into breakeven;
Parameters Start with lot - initial position volume increased in proportion to the balance change; Lotsize by balan
FREE

With this easy to set up indicator you can display and set alerts for the following candlestick formations: Bull Breakout, Bear Breakout, Hammer, Pin, Bullish Engulfing, Bearish Engulfing. I'd appreciate if you would review the indicator
Input parameters: ShortArrowColor: The color of the Arrows, displaying a Bearish candle formation LongArrowColor: The color of the Arrows displaying a Bullish candle formation BullishEngulfing: Disabled/Enabled/EnabledwithAlert BearishEngulfing: Disabled/Ena
FREE

The Pivot Indicator is a vital tool for technical analysis used by traders in the financial markets. Designed to assist in identifying potential reversal points or trend changes, this indicator provides valuable insights into key levels in the market. Key features of the Pivot Indicator include: Automatic Calculations: The Pivot Indicator automatically calculates Pivot Point, Support, and Resistance levels based on the previous period's high, low, and close prices. This eliminates the complexity
FREE

OHLC マグネットは、水平線、長方形、価格ラベルに欠落しているマグネットポイントを追加します。 あなたはこのユーティリティが好きなら、 とコメントを評価してください。
指示:
前述のオブジェクトの1つを、ピクセルの近接範囲内の目的の始値、高値、安値、または終値にドラッグするだけで、選択した正確な価格ポイントにオブジェクトが自動的にアタッチされます。
パラメーター:
近接 (ピクセル): その特定の価格ポイントに接続するためのユーティリティの始値/高値/安値/終値をマウスカーソルがどの程度閉じるかをピクセル単位で指定します。デフォルトは10です。 価格ラベルを自動調整する: 価格ラベルを左側 (左の価格ラベルの場合) または右 (価格ラベルの場合) に自動的に調整します。既定値は有効です。
FREE

RangeMasterFXは、複数の時間枠に基づいたトレンド分析とテクニカル指標を組み合わせ、信頼性の高い取引シグナルを生成し、効果的な取引を自動化します。 主な機能: 多時間枠分析 : 日足(D1)、4時間足(H4)、1時間足(H1)の3つの時間枠でトレンドを分析し、正確なエントリーポイントを見つけます。 RSIフィルター : RSI(相対力指数)を使用して、買われ過ぎや売られ過ぎの市場状況を識別し、エントリーをフィルタリングします。 トレーリングストップ : 利益を最大化するために、ポジションが有利な方向に動いた場合にトレーリングストップを適用します。 動的ストップロスとテイクプロフィット : ATR(平均真の範囲)インジケーターに基づき、市場のボラティリティに応じてストップロスとテイクプロフィットを動的に設定します。 自動利益確定 : 目標利益率を設定し、その達成時に自動的にすべてのポジションをクローズします。 フィルター機能 : 複数の時間枠でトレンドの方向を確認し、トレンド方向に基づいたフィルターを使用してエントリーの質を向上させます。これは、上昇トレンドの場合に買い注文の
FREE

A.このピボットインジケータは日ピボット価格を示します。
B.抵抗R0.5、R1、R1.5、R2、R2.5、およびR3も表示されます。
C.サポートS0.5、S1、S1.5、S2、S2.5、およびS3も表示されます。
入力:
入力の下に、3つの変数があります。
1.ExtFomula。ここでは、チャートウィンドウ上の抵抗または支点に1または2または3以下の値で優先出口を設定できます。 1は抵抗または支持体1での出口を表し、2は抵抗または支持体2での出口を表す。3は抵抗または支持体3での出口を表す。
ExtHowmanyDays。デフォルトは30日間です。 ExtFomulaに1、2、3のいずれかを入力すると、過去30日間の出口サポートとレジスタンス価格がチャートウィンドウに表示されます。
3.ExtDraw。チャートウィンドウまたはその逆ビザにサポートとレジスタンスを描画できるようにするには、trueを選択します。
利点
1.表示器はサポート3か抵抗3まで見ることを可能にします
2.インジケーターを使用すると、選択した任意の抵抗またはサポートでチ
FREE
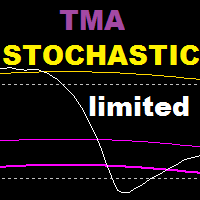
TMA Stochastic is an indicator based on stochastic oscillator and tma bands indicator , this indicator is based on a reversal strategy . Recommended time frame : 15 and above Recommended settings : lower values for scalping , higher values for swing trading WORKS ONLY ON EURUSD , GET THE FULL VERSION : https://www.mql5.com/en/market/product/108378 ======================================================================= Parameters : tma history : how many bars back to show tma bands on stochas
FREE

updated hidden market support and resistance. this indicator is made for new current market that has new support and resistance that some traders struggle to see. The indicator works on all timeframes from the 1-minute timeframe to the monthly One Trading tip to use When price is at resistance and the indicator appears wait for a bearish candle to close then enter a sell trade. Same applies for a buy trade when price reaches support level, and the indicator appears wait for the bullish candle
FREE

Asesor Experto "Sniper FX": Precisión Milimétrica para Tus Operaciones El asesor experto "Sniper FX" redefine la precisión en el trading automatizado al ofrecer un enfoque estratégico centrado en pocas, pero extraordinariamente precisas, entradas en el mercado. Inspirado por la agudeza de un francotirador, este asesor experto utiliza algoritmos avanzados para identificar oportunidades óptimas de compra y venta, maximizando el potencial de beneficios mientras minimiza la exposición al mercado.
FREE
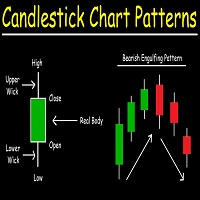
Please leave 5 Stars to me
Candlestick Patterns Scanner is professional indicator that will assist and alert you to identify candlestick patterns on meta trader 4 charts whenever a pattern appears on the chart. In financial technical analysis , a candlestick pattern is a movement in prices shown graphically on a candlestick chart that some believe can predict a particular market movement. The recognition of the pattern is subjective and programs that are used for charting have to
FREE

アカウントダッシュボードの統計
これは、アカウントの損益を把握するために集中的に表示するのに役立つツールであり、それを追跡することができ、また、得られるリスクを知るためのドローダウン分析も提供します。 アカウントにダウンロードしてアクティブ化した後、EURUSD H1 などの任意のシンボルに添付する必要があります。その後、この瞬間からツールが統計の監視を開始します。
パネルは完全に高度になっており、非表示にしたり、好きな場所に移動したりできます アカウント操作に基づく主な特徴は次のとおりです 毎日の期間(毎日の利益と損失は毎日更新されます) 毎週の期間 (毎週更新される週ごとの利益と損失) 毎月の期間(毎月の損益は毎月更新) 年間期間 (年間の損益は毎年更新) 最大ドローダウン(残高に基づいて最大リスクに達するのを毎秒監視して制御) たとえば、残高が 1000 米ドルで、引き出しが 10% をマークしている場合、ある時点でアカウントの合計リスクが 100 米ドルに達したことを意味します。
FREE
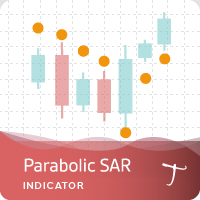
Tipu Parabolic SAR Panel is the modified version of the original Parabolic SAR indicator published by MetaQuotes here . Dashboard Panel (multi symbol) version for this indicator is available here .
Features An easy to use Panel that shows the Parabolic SAR trend and signals of selected timeframe. Customizable Buy/Sell alerts, push alerts, email alerts, or visual on-screen alerts. Customizable Panel. The panel can be moved to any place on the chart or minimized to allow more space. To enable th
FREE
MetaTraderマーケットは、開発者がトレーディングアプリを販売するシンプルで便利なサイトです。
プロダクトを投稿するのをお手伝いし、マーケットのためにプロダクト記載を準備する方法を説明します。マーケットのすべてのアプリは暗号化によって守られ、購入者のコンピュータでしか動作しません。違法なコピーは不可能です。
取引の機会を逃しています。
- 無料取引アプリ
- 8千を超えるシグナルをコピー
- 金融ニュースで金融マーケットを探索
新規登録
ログイン