Kostenlose Handelsroboter und Indikatoren für den MetaTrader 4 - 17

Discount 50% for 20 first customers
This Trading System from Scarface Trades. This expert does not use dangerous martingale, grid , have stoploss and tp, recommended to use 1% risk and 1:2 RR Ratio. The best pair is Tesla, i use icmarkets to backtest. It scan the 5 min opening range, and define order block after breakout the opening range, will take position on retest the order block. So far i have backtested only Tesla make a good profit. Use default setting Pair: TESLA TimeFrame: M1
Descri
FREE
The "FracLine" Expert Advisor uses trend lines based on fractals to open a position.
It works at closing prices, so optimization and testing can be performed at open prices. The time frame and tool can be anything. Definition of a fractal for this EA:
a fractal is a 9-candlestick pattern, where the central one is the maximum (in an upward movement) or minimum (in a downward movement) in this pattern.
A prerequisite is that to the left and right of the high (fractal candle) there must be at l
FREE

The Robot's Logic
Check the longer time frame range, and if the price breaks that range, it opens an entry.
BUY and SELL entries are decided based on RSI overbought and oversold conditions.
The logic is very simple, but longer time frames such as H4 give the best performance. Please attach EA on the TF H4 and buy and sell entry is closed with profit target which is auto calculation.
FREE

Constant Trader ist ein vollautomatischer, professioneller Handelsroboter. Speziell für den Devisenmarkt EURUSD entwickelt.
EA muss keine Parameter konfigurieren. Bereit, an EURUSD M30 zu arbeiten. Sie müssen sich nur noch für die Wahl des Loses entscheiden.
Es verfügt über einen intelligenten Algorithmus, der den Trend erkennt und Marktgeräusche herausfiltert. Der Experte erstellt Orders in Trendrichtung.
Eingabe- und Ausgabeaufträge werden durch eine Kombination von drei Indikatoren gegebe
FREE

This is a gamble Expert Advisor!!
It will open randomly trades on markets which are in your watchlist (left). You select how much you will risk. It uses the compound interest effect. Example: Starting with $10 1. Trade + $10 -> $20 2. Trade + $20 -> $40 3. Trade + $40 -> $80 4. Trade + $80 -> $160 5. Trade + $160 -> $320 6. Trade + $320 -> $640 .. and so on! If you reach the 17th trade sucessfully, you have over 1 Million Dollar!! (Starting with $10)
It risks max. 90% of your money stake, to
FREE

Das Panel hat die intuitivste Benutzeroberfläche, mit der jeder Anfänger umgehen kann.
In der Spalte SLp müssen Sie die SL-Größe in Pips angeben. Wenn der Wert grau wird und gleichzeitig auch die Bay / Sell-Buttons inaktiv sind, dann haben Sie einen SL-Wert angegeben, der niedriger ist als der zulässige, bevor er von Ihrem Broker festgelegt wurde.
In der Spalte TP% - geben Sie TP in% des Kontostands an. In den Einstellungen können Sie auswählen, wie dieser Indikator berechnet wird, nach Eigen
FREE

This indicator is designed to detect high probability reversal patterns: Double Tops/Bottoms with fake breakouts . This is the FREE version of the indicator: https://www.mql5.com/en/market/product/26371 The free version works only on EURUSD and GBPUSD! Please read also the blog post " Professional Trading With Double Tops/Bottoms And Divergences! " which explains the concepts behind the ULTIMATE Double Top/Bottom indicator and how you can use a professional top-down approach. The provided video
FREE

DEMO-Version von GoldSuperTrendEA Die Demoversion funktioniert nur im Backtesting.
TestGoldSuperTrendEA verwendet eine Strategie, die RSI und gleitenden Durchschnitt kombiniert.
Eine hohe Gewinnquote und ein hoher Gewinnfaktor machen diesen Expert Advisor sehr profitabel.
Es wurde für das XAUUSD-Paar entwickelt.
Einrichtung und Tipps:
Ich empfehle die Verwendung eines Guthabens von 1500 $ und eines anfänglichen Lots von von 0,05 mit einer Hebelwirkung von 1:100
Niedrige Zeitrahmen reagi
FREE

About Waddah Multimeter (free): This product is based on the WAExplosion Indicator. It helps identify explosive market trends and potential trading opportunities. Waddah Multi-meter (Multi-timeframe) Check out the detailed product post here for scanner and multimeter both: https://www.mql5.com/en/blogs/post/758020
Please note that scanner is paid and multimeter is free.
Features: Waddah Trend Direction Trend Strength (above/below explosion line or deadzone) Trend Explosion Alert Alignment aler
FREE

Sniper Advisor ist ein halbautomatischer Experte, dessen Hauptaufgabe es ist, Transaktionen für die Strategie des Händlers mit der sogenannten «Safe» -Regel sowie einer Übertaktungsposition zu eröffnen, die in Verbindung mit der nicht funktionierenden «Safe» -Regel verwendet wird.
Es ist erwähnenswert, dass der Experte den Markt nicht nach der Strategie des Scharfschützen analysiert, sondern ein gewöhnlicher Assistent für die Umsetzung des beliebten Ansatzes zur Vermögensverwaltung ist.
Es is
FREE

Features:
1- Get OB/OS Levels from Golden MA Levels
2- Wait for Buy/Sell Start Level Cross
3- Optional: Should price cross Mid Level in earlier bars
4- Optional: Crossing bar High/Medium Volume
5- Optional: MA Stacked to check up/down trend for current TF
6- Optional: NRTR higher timeframes aligned Check
Detailed blog post explained: https://www.mql5.com/en/blogs/post/758457
Levels with Buffers available here: Golden MA Levels Indicator: https://www.mql5.com/en/market/product/119515 Note: Arr
FREE

M1Arrows is a MT4 trend arrows Indicator
* Smart Scalper Setup (M1) :: Signal 5 Main 20 + Signal 20 Main 80 + Fibonacci ZigArcs 20
(Screenshot1) Add the indicator with first setting,
then add it again to the same graph with other settings.
You can add as many as you want, but 2 M1Arrows in just one graph is enought
Never open orders againt the slow setting trend
Do not open more than 3 orders per slow setting trend
It will work better in Europe/USA markets, * M15 Day Trade Setup: Signal 20 ma
FREE

The indicator displays two Moving Average lines on the chart with parameters specified in the settings. It issues a signal in the form of arrows and a sound at the intersection of these Moving Average. In the indicator settings, you can set the period of fast Moving Average ( Fast MA Period ) and slow Moving Average ( Slow MA Period ). And also Shift, Applied Price, Method and Timeframe for two Moving Averages separately. Important:
The main difference from othe
FREE

The Donchian channel is an indicator that takes a series of user-defined periods and calculates the upper and lower bands. Draw two lines on the graph according to the Donchian channel formula. This straightforward formula is based on:
The top line is the highest price for the last periods n The bottom line is the lowest price for the last periods n
Trend systems follow periods when support and resistance levels are broken. in this case when the price breaks the upper line or the lower line o
FREE

This is an indicator detecting trend direction. It uses the popular Bill Williams Alligator. It shows market state on all timeframes on one chart. As is well known, traders gain the main profit on the Forex market trading by trend, and losses usually occur when the market is flat. So, in order to gain profit a trader should learn to detect trend market and direction of a current trend in a rapid manner. This indicator has been developed for this purpose. MTF Alligator helps to: Profitably trade
FREE

In FX, signals from doji patterns can be effective in capturing potential trend developments. Therefore, setting pending orders simultaneously after the appearance of a doji can make it easier to capture the onset of a trend.
Setting stop-loss (SL) and take-profit (TP) levels more widely can enhance the probability of success, but it also increases the associated risk.
In the event of a loss, it is possible to recover by increasing the next position size through multi-lot trading, but this str
FREE

Double Breakout is an automatic expert advisor with two separate strateges that uses martingale. The MACD indicator with adjustable parameters is used as inputs for each flow of orders. The specified takeprofit and stoploss levels are used to exit the position. General recommendation
The minimum recommended deposit is 1000 cents. Spread is recommended not more than 3 points. It is better to use trend currency pairs. The martingale parameter can be set from 0.1 to any value. When martingale i
FREE

Free RSI expert advisor is a completely free expert advisor that trades using rsi level crosses. You can set which levels the Ea should use to open and close trades. The various settings are explained below. NOTE: The default settings are just place holders and not necessarily the best. Use the settings that best suites you or your strategy. Lots - This is the lot size of the EAs trades. 0.1 is the default setting. AllowBuy - Set to true to allow buy trades. This setting is true by default. Allo
FREE

Basic Theme Builder: Vereinfachen Sie Ihre Diagrammanpassung Verwandeln Sie Ihr Trading-Erlebnis mit dem Basic Theme Builder -Indikator, einem vielseitigen Werkzeug, das entwickelt wurde, um die Anpassung des Erscheinungsbildes Ihres Charts auf MetaTrader 4 zu vereinfachen. Dieser intuitive Indikator bietet ein benutzerfreundliches Panel, mit dem Sie mühelos zwischen verschiedenen Themen und Farbschemata wechseln können, um sowohl die visuelle Attraktivität als auch die Funktionalität Ihres H
FREE

The Trade Grid bot simplifies trading by executing multiple orders with a single click, as specified by the user. These orders are initiated instantly using the EA buttons on the chart and can be closed simultaneously using the close button also located on the chart. Additionally, Trade Grid efficiently manages trades by automatically closing them once they reach a predefined profit or loss threshold.
FREE

This indicator plots in the candles the divergence found in the selected indicator and can also send a notification by email and / or to the cell phone.
Works on all TIMEFRAMES. Meet Our Products
He identifies the divergences in the indicators:
Relative Strength Index (RSI); Moving Average Convergence and Divergence (MACD); Volume Balance (OBV) and;. iStochastic Stochastic Oscillator (STOCHASTIC).
It is possible to choose the amplitude for checking the divergence and the indicator has to b
FREE
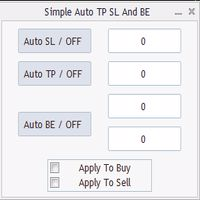
Program for automatic placement of stop loss and take profit orders. Values are calculated as points distance from open price. BreakEven option is also included. all options could be applied to BUY, SELL separately or together. Enter values in points in the fields on the right side of the menu and press dedicated button to aplly your settings.
If in doubt, The instruction is displayed in the tooltip.
FREE

Indicator overview Trend indicator usage Moving averages. Highest quality alerts that need no introduction. It is completely loyal to the original algorithm and uses other useful features.
Easy to trade Carry out all kinds of notifications It's not a new paint and it's not a back paint. Setting Indicator EMA50 in Time frame H1 for any pair currency and Gold Spot. EMA200 in Time frame H1 for any pair currency and more than EMA250 for Gold spot. Using it for maximum benefit Set up notification
FREE

CISD and Price Gap Openings Indicator MT4 The CISD CSD + Price Gap Openings Indicator is designed to highlight price gaps while marking the CISD level, providing insights into potential market reversals. This MetaTrader 4 tool, based on ICT principles, utilizes arrow markers to assist traders in recognizing fresh price gaps and possible retracement zones. CISD – CSD + Price Gap Openings Indicator Specifications The following table outlines the features of the CISD – CSD + Price Gap Openings In
FREE
Obiforex - Pending Orders Specialized for trading during news events and at any other time in the market, Obiforex - Pending Orders is a program designed to enhance your trading experience. By utilizing pending orders, you can seize market opportunities with precision and efficiency. Buy Stop: Place a pending purchase order at a higher price ("stop" price) than the current price. The Buy Stop order will be executed if the sale price ("Ask") quoted on the platform is equal to or higher than the o
FREE

This Utility is a tool to manage level of profits or losses for each order without using stop loss or take profit. The Utility applies virtual levels to close orders in profit or loss. You can use the robot to manage manually opened orders or manage orders opened by another EA.
You can to get the source code from here .
Parameters OrdersManage - orders to manage (all orders of all symbols or orders on the current chart). Stop Loss Pips - virtual stop loss level. Take Profit Pips - virtual take
FREE

This indicator helps you to scan symbols which are in the Market Watch window and filter out a trend according to RSI.
The relative strength index (RSI) is a technical indicator used in the analysis of financial markets. It is intended to chart the current and historical strength or weakness of a stock or market based on the closing prices of a recent trading period. The indicator should not be confused with relative strength. The RSI is classified as a momentum oscillator, measuring the veloci
FREE

Diversify the risk in your trading account by combining our Expert Advisors. Build your own custom trading system here: Simple Forex Trading Strategies
The expert advisor opens trades when EMAs cross and the Average Directional Index is above 25. The Stop Loss, Take Profit, and Trailing Stop are calculated based on the ATR indicator. The recommended currency pair is GBPAUD. The recommended timeframe to operate and to do backtests is D1. This Expert Advisor can be profitable in any TimeFrame
FREE
For those who have followed my FCK Quantum Scalping thread know about the FCK Quantum Scalping indicator and have taken the indicator to different levels (Mastermind) to suit his or her trading style. In this system, the Quantum indicator is only for showing us trading entries, and that’s it. Targets and stop levels are a little later. For those who don’t know what the FCK Quantum Scalping indicator is, I’ll tell you. The FCK Quantum Scalping indicator is basically a modified Wave indicator i
FREE

This outside bar indicator is the opposite of the inside bar. So what this MT4 outside bar indicator does is identifies outside bars for you as they form on your charts. Outside bar is a famous trading pattern in which the bar carry higher high and lower low compared with the previous bar, also known as mother bar. To trade based on Outside Bars, simply place buy stop order above the high price level of a bullish Outside Bar, and sell stop order should be placed below the low price level of a be
FREE

You can manually open a trade (one click), and this EA will take care of setting the SL and TP. SL and TP are set based on the number of pips you specify in the input screen. You can also choose monetary SL and TP. SL and TP are determined based on the weighted average price (WAP), so if you open a new trade, SL and TP will be updated according to the new WAP. The WAP is not unique but differentiated between buy and sell trades (this is useful only if you open opposite trades on the same chart)
FREE

There are many candlestick patterns but only a few are actually worth knowing. Candlestick Pattern Filter detects and marks the most reliable candlestick patterns. Remember that these patterns are only useful when you understand what is happening in each pattern. They should be combined with other forms of technical analysis for best result. These patterns are included: Hammer / Hanging Man Inverted Hammer / Shooting Star Bullish / Bearish Engulfing Piercing Line / Dark Cloud Cover Morning Star
FREE

PROFIT XX FULLY AUTOMATED EA (ROBOT ) This is a trend EA, Works on all symbols (EURUSD, GBPUSD, EURJPY, USDJPY, EURCAD, EURGBP ) and many more. The EA works on all time frames (1m, 5m, 15m, 30m, IHR, 4HR, Weekly, Daily). but for best results 5 minutes time frame is recommended, The default settings are set best for 5 min chart. The EA is a combination of 200 SMA, 60SMA, 10SMA and 8RSI. the 200 SMA & 60 SMA gives a signal to open trades and the 10 SMA is closing single winning trades. The lo
FREE
This EA opens a buy sell order based on the H4 trend. When the price goes over 100 pips ea keep opening orders against the price until the profit is positive and EA will close all orders and continue the new round. Requirement - Flatform: MT4 - Symbol: XAUUSD. - Time frame: M15 - Minimum deposit: >500$ - Leverage: 1:500 and higher - ECN broker - Virtual Private Server hosting (VPS) Parameters
FREE

The Colored MACD indicator is a versatile and powerful tool designed to enhance your technical analysis by providing an intuitive visualization of market momentum and trend changes. Built on the foundation of the popular Moving Average Convergence Divergence (MACD) indicator, this version introduces color-coded histograms to easily distinguish between bullish and bearish momentum. Key Features: Color-Coded Visualization : The indicator features a lime-colored histogram when the MACD is above the
FREE

Dieser Indikator trennt das Tick-Volumen auf dem Devisenmarkt effektiv in bullische und bearische Kategorien.
Darüber hinaus bietet er die Möglichkeit, die Summe der bullischen und bearischen Tick-Volumina für einen von Ihnen gewählten Zeitraum zu berechnen und anzuzeigen.
Sie können den Zeitraum ganz einfach anpassen, indem Sie die beiden blauen Linien im Diagramm verschieben. So können Sie die Analyse des Handelsvolumens genau auf Ihre Bedürfnisse abstimmen.
Wenn Sie es nützlich finden, fr
FREE

This Expert Advisor is a pure scalping system. The expert place and manage pending orders. Runs perfect on pairs with tight spread and low commission broker (commission plus spread equal or less than 1.0 pip). Choose a broker with zero stop level and fast execution to use expert.
Pairs and Time Frame Pair: eurusd Time frame: M1 Default settings are good for eurusd.
Information Please test expert on demo account first, before uses it on real account. Have on your mind, all scalpers are sensiti
FREE

Fractal is one of the main indicators in a number of strategies. Volume Fractals has expanded the functionality of the standard indicator version. The product features fractals sorting and displaying fractals representing both price and volume extreme points.
Application Stop losses Reversal signals Placing pending orders for a fractal breakout
Options Bars of history - number of chart bars the indicator is displayed for Left side minimum bars - minimum number of bars to the left of the fracta
FREE

Sometimes there is money to be made in simplicity! The DAX Bull works using a simple moving average both for short and long. It has an advanced order and trailing system which essentially helps in hitting those big wins. This bot is a trend bot and as such expect win rate to be around 40%, expect around 13-20 trades per month. As always, judge more on live signals and your own backtesting! If you have questions just message me on MQL5.
My main selling point as a EA creator? Brutal honesty. I s
FREE

Harrow Order is an Expert Advisor (EA) that works based on Support and Resistance, Martingale and Anti-Martingale methods. Support and Resistance is used to indicate the best position to place orders. Martingale is used to fix unprofitable orders. And Anti-Martingale is used for increasing potential profitable orders. This EA runs with two basic steps, namely try and execute. First, it will send one initial order to find out the market conditions at a nearest Support or Resistance level. Second,
FREE

Konto-Dashboard-Statistiken
Es handelt sich um ein Tool, das Ihnen dabei hilft, einen fokussierten Überblick über die Gewinne und Verluste Ihres Kontos zu erhalten, damit Sie den Überblick behalten. Außerdem bietet es eine Drawdown-Analyse, um auch das erhaltene Risiko zu ermitteln Nachdem Sie es heruntergeladen und in Ihrem Konto aktiviert haben, müssen Sie es an ein beliebiges Symbol anhängen, zum Beispiel EURUSD H1. Von diesem Moment an beginnt das Tool mit der Überwachung Ihrer Statistiken
FREE
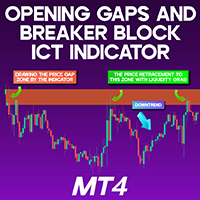
Opening Gaps and Breaker Block ICT Indicator MT4 The Opening Gaps and Breaker Block ICT Indicator MT4 is an advanced trading tool for MetaTrader 4, designed to detect daily price gaps that serve as dynamic support and resistance areas. This indicator is particularly useful for identifying key zones where price reversals may occur. Green markers indicate support gaps , while red markers highlight resistance gaps . If price moves through these zones and creates a Breaker Block (turning former supp
FREE

This trend Advisor is based on Alexander elder's multi-timeframe strategy. Automatic Advisor "Elvis79" royally strict, reliable and chic. It is optimized for the USDZAR currency pair. With the author's settings is set to the timeframe H4. At the same time, the EA trades at the level of the daily timeframe, that is, it holds the trade for several days.
The EA uses a sophisticated trading system "Giant". His whole concept is directed against the risky and irresponsible policies. Before trading on
FREE

FTU Idioteque Der Indikator ist für die MT4-Plattform bestimmt und kann allein verwendet werden, am besten jedoch mit anderen Indikatoren oder Strategien kombiniert werden Kombiniert verschiedene Indikatoren wie MACD und ADX, um einen Pfeil als Hinweis auf einen Einstieg oder eine Trendänderung zu zeichnen Sehen Sie sich ein kurzes Einführungsvideo auf YouTube an: https://youtu.be/lCRJ3mFNyOQ Anzeigefunktionen: Pfeile verkaufen und kaufen Visuelle und akustische Warnung Trendfortsetzung / Frühz
FREE

This EA using Trend Analyzer to trade follow the trend, not againts it No Martingale, No Grid, No Averaging All orders use fix SL and TP, with RRR 1:2
Recommendation Pairs :EURUSD
TimeFrame : H1
Balance : Recommended $500 with 0.01 lot
Risk Warning: Before you use this EA please be aware of the risks involved. Past performance is no guarantee of future profitability (EA could also make losses). Always run it on demo account at first
After Download please contact me for more instructi
FREE

Informational indicator to aid in trading English and Russian version Balance Equity Drawdown Margin level Opened orders Spread Total profit Profit for today Profit for yesterday Profit for the week Profit for a month Detailed statistics for 5 pairs Detailed statistics on the current pair ATR MarginCall quote and distance to it Breakeven quote and distance to it Minimum margin level Maximum drawdown Maximum possible lot to open Displaying the breakeven line Displaying MarginCall and Stopout lin
FREE
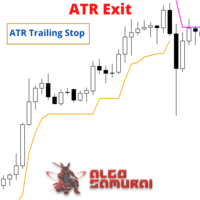
The ATR Exit indicator uses the candle close + ATR value to draw trailing stop lines (orange under buys, magenta over sells) that advance with the trend until the trend changes direction. It uses a multiple of the Average True Range (ATR), subtracting it’s value from the close on buy, adding its value to the close on sell. Moreover, the trailing stop lines are generated to support the order’s trend direction (long or short): In an upward trend, the long trailing stop line (orange line under bu
FREE

Blahtech Moving Average indicator is a multitimeframe version of the standard Moving Average indicator. It is also enhanced with customisable alerts, period breaks and other configuration options. The 50 day and 200 day moving averages are widely followed by investors and traders, with breaks above and below the MA lines considered to be signals of interest. Links [ Install | Update | Training | All Products ]
Feature Highlights Up to three timeframes Configurable calculation variabl
FREE
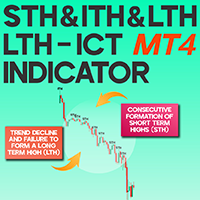
STH & ITH & LTH ICT Indicator for MT4 Free Download The STH & ITH & LTH indicator is specifically designed based on the ICT (Inner Circle Trader) methodology. This advanced liquidity tool for MetaTrader 4 employs market structure principles, marking key price levels such as short-term highs (STH), intermediate-term highs (ITH), and long-term highs (LTH). «Indicator Installation & User Guide»
MT4 Indicator Installation | STH & ITH & LTH ICT Indicator MT5 | ALL Products By TradingFinderLab
FREE
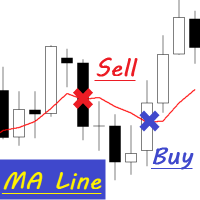
MA Line A cross between the candlestick and the moving average line.
MA Line is Expert Advisor which is very simple by working as below: Buy Condition 1. Perivious open candle bellow MA Line 2. Previous close candle above MA Line Sell Condition 1. Perivious open candle above MA Line 2. Previous close candle below MA Line
EA Parameter - Time Filter - Lot - MA Period - MA Method - Stop Loss - Take Profit - Trailing Start - Trailing Step - Trailing Stop - Magic Number
FREE

The indicator defines the Bullish and Bearish Engulfing Bar. The pattern has greater reliability when the open price of the engulfing candle is well above the close of the first candle, and when the close of the engulfing candle is well below the open of the first candle. For an engulfing bar to be valid it must fully engulf at least one previous bar or candle - includes all the body and the wick. The engulfing bar can engulf more than one bar as long as it completely engulfs the previous bar.
FREE
Daily Volatility Tracker is a practical and lightweight indicator designed to help traders monitor and analyze market volatility based on historical daily price movements. Whether you're a day trader, swing trader, or scalper, understanding how much a market moves per day is critical for: Choosing the right pairs to trade Setting accurate stop-loss and take-profit levels Adapting to changing market conditions MT5 Version - https://www.mql5.com/en/market/product/134960/ Join To Learn Market Dept
FREE

CPR Pivot Lines It Will Draw Pivot Point R1,R2,R3 S1,S2,S3 Tc Bc Best Part Is That You Can Even Add Values Of High,Low,Close Manually Also To Get Your All Levels On Chart. So If Your Broker Data Of High ,Low ,Close Is Incorrect Then You Don’t Have To Depend On Them Anymore. You Can Even Modify All Lines Style. It Will Show Line In Floating Style And Not Continues Mess.
FREE

https://www.mql5.com/en/signals/2298866?source=Unknown
https://www.mql5.com/en/market/product/135278?source=Site+Market+Product+From+Author
[Your EA Name] – Smart Algorithm for Long-Term Profit Profit from Market Trends – Smart Portfolio Management [Your EA Name] is designed to help traders capitalize on Forex market movements by integrating three powerful strategies:
Trend Following – Capture momentum for maximum profit potential
Grid Trading – Place strategic orders to optimize ran
FREE
Trend Panel ist ein einfaches, praktisches Tool, das eine bestätigte Trendrichtung der Zeitrahmen M1 - D1 unter Verwendung von zehn vom Benutzer ausgewählten Paaren anzeigt.
Der Indikator ist so konzipiert, dass er jeder Strategie/Vorlage eine Richtungsbestätigung hinzufügt und dann auch als saubere interaktive Schnittstelle funktioniert, um den Chart schnell auf ein anderes Paar oder einen anderen Zeitrahmen zu ändern. Gruppenchat: https://www.mql5.com/en/users/conorstephenson
Bitte kontakti
FREE

Rainbow MT4 is a technical indicator based on Moving average with period 34 and very easy to use. When price crosses above MA and MA changes color to green, it’s a signal to buy. When price crosses below MA and MA changes color to red, it’s a signal to sell. The Expert advisor ( Rainbow EA MT4) based on Rainbow MT4 indicator, as you can see in the short video below is now available here .
FREE
Running accounts 5000$ or more Specialize in XAUUSD pair Lot - Startot . Auto-BUY-SELL - allows to buy or sell. Auto-Grid - ON/OFF AutoLot - ON/OFF TP - Takeprofit -pips. SL - No Stoploss. Magic - Number magic. Capital Mangement - ON/OFF. GridStep - Grid replace for Stoploss = Pips. Comment - KING Profit - $ The tactics we use are always profitable. try it out in the demo account before it goes live Profit from 20-30% per month.
FREE
The presented indicator is an original development based on the idea embedded in the classic technical analysis indicator - Fractals. The Fractals indicator allows you to determine a significant trough or peak for analysis on the price chart of the financial instrument in question. The fractal itself on the price chart consists of candles, the middle of which is either the highest (up fractal) or the lowest (down fractal) of all the candles taken for analysis. The original indicator uses five ca
FREE
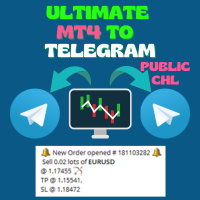
Ultimate MT4 to Telegram Public Channel sends controlled trades (via symbol, magic, comment) to a public telegram channel. It sends open and closed trades, including pending orders and TP/SL modifications, along with chart screenshots, to this public telegram channel. Additionally, you can send trade reports of open trades and summary profit/pip reports for day, week, or month. You can customize the design of the trade actions or reports with variables and emoticons.
A beautiful panel allows
FREE
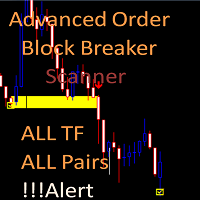
Advanced Order Block Breaker Scanner
This Scanner is free to download but is dependent on you owning the advance order block breaker indicator. Need to purchase the indicator here: https://www.mql5.com/en/market/product/59127
MT5 version: https://www.mql5.com/en/market/product/62769
The Scanner will show you on a single chart all the timeframes (M1 to Monthly) with their own status for the indicator: advance order block breaker Scan all time frame and all symbol: breaker's smart algor
FREE

McS Super Trend -This is one of the most popular classic trend indicators. It has a simple setting, allows you to work not only with the trend, but also displays the stop loss level, which is calculated by this indicator. Benefits:
Instruments: Currency pairs , stocks, commodities, indices, cryptocurrencies. Timeframe: М15 and higher. Trading time: Around the clock. Shows the direction of the current trend. Calculates the stop loss. It can be used when working with trading. Three types of not
FREE

Bitte hinterlassen Sie eine 5-Sterne-Bewertung, wenn Ihnen dieses kostenlose Tool gefällt! Vielen Dank :) Die Expert Advisor Collection „Risk Management Assistant“ ist eine umfassende Suite von Tools zur Verbesserung von Handelsstrategien durch effektives Risikomanagement unter verschiedenen Marktbedingungen. Diese Sammlung besteht aus drei Schlüsselkomponenten: Expertenberater für Durchschnittsbildung, Switching und Absicherung, die jeweils unterschiedliche Vorteile bieten, die auf unterschied
FREE
Der UzFx-Total TP'SL & Timer-MT4-Indikator wurde entwickelt, um die gesamten Take Profit (TP)- und Stop Loss (SL)-Werte aller offenen und schwebenden Trades in Echtzeit zu verfolgen. Außerdem enthält er einen Kerzen-Countdown-Timer, der die verbleibende Zeit bis zum Schließen der aktuellen Kerze anzeigt.
(Besuchen Sie das Profil und sehen Sie sich alle anderen MT4/MT5-Produkte an) (Bitte vergessen Sie nicht, eine Bewertung abzugeben)
Key Features:
Berechnet automatisch den gesamten erw
FREE

The Time Zone indicator allows users to set specific time periods for major trading sessions (Asian, European, North American) and display them with distinct colors on the chart. Users can choose how many days of trading zones to show, set the start and end times for each session, and define the color to represent each trading period. The chart refreshes at user-defined intervals to ensure the time zone data is accurate and current. Key Features: Display Trading Zones: Users can choose to
FREE

Als Neujahrsgeschenk und zur Veröffentlichung des „GoldMinerRobot“ erhalten die ersten 5 Personen, die diesen Roboter kaufen oder mieten, kostenloses MQL5 - VPS, entsprechend der Dauer ihres Kaufs.
Wenn Sie diesen Roboter für 1 Monat mieten, erhalten Sie 1 Monat „KOSTENLOSES MQL5 VPS“ als Geschenk von uns.
Wenn Sie diesen Roboter für 3 Monate mieten, erhalten Sie 3 Monate „KOSTENLOSES MQL5 VPS“ als Geschenk von uns.
Wenn Sie diesen Roboter für 6 Monate mieten, erhalten Sie 6 Monate „KOSTENLOSE
FREE
Counterattack EA is a fully automatic Grid Expert Advisor for Trend Scalping Trading on XAUUSD timeframe M1 but also in others.
Recommendations The Expert is programmed to work on XAUUSD M1, but you can use all others timeframes also. An ECN broker is always recommended A low latency VPS is always recommended. The recommended Leverage is 1:100 or more. The recommended capital is 10000 ($/cent) per 0.01 Lots or more. For higher Lots please test by yourself Please test Demo before you b
FREE

This simple indicator paints with a darker color on the volume bar when the quantity traded is above the average of select number of periods of the volume itself, highlighting the moments when there was a large volume of deals above the average. It is also possible to use a configuration of four colors where the color tone shows a candle volume strength. The indicator defaults to the simple average of 20 periods, but it is possible to change to other types of averages and periods. If you like t
FREE

Main: Not martingale, not a grid; Working on all symbols;
Signals: There is a good rational algorithm. Work of two indicators: Stochastic and OsMA (you can set a separate Timeframe for each indicator)
Stop Loss/Take Profit: There is a good money management system (there are several type for trailing stop loss); There is virtual levels of Stop Loss / Take Profit; There is smart lot (percent by risk) or fix lot
Important: EA can work on closed candles, and on current candles; Quickly opti
FREE
This indicator draw a watermark on the chart, with the timeframe and symbol name. You can change everything, including add a aditional watermark. Functions: Symbol watermark: Size - text size. Font - text font. Color - text color. Background text - watermark at foreground or background mode. Horizontal correction - x correction in pixels. Vertical correction - y correction in pixels. Separator period X symbol - what will separate the period from symbol. Aditional watermark: Enable custom
FREE

Entdecken Sie einen revolutionären Handelsansatz, der noch nie dagewesene Chancen durch Zeitausbrüche nutzt. Unsere innovative Strategie integriert ein ausgeklügeltes Martingale-System, das intelligent darauf ausgelegt ist, Gewinne zu maximieren und gleichzeitig das Risiko zu minimieren. Mit einem eingebauten Sicherheitsnetz, das auf einem vorab festgelegten Risikoschwellenwert basiert, können Sie selbstbewusst handeln, da Ihre Investitionen geschützt sind. Treten Sie den Reihen schlauer Trader
FREE
Der MetaTrader Market ist eine einzigartige Plattform für den Verkauf von Robotern und technischen Indikatoren.
Das Merkblatt für Nutzer der MQL5.community informiert Sie über weitere Möglichkeiten: nur bei uns können Trader Handelssignale kopieren, Programme bei Freiberuflern bestellen, Zahlungen über das Handelssystem automatisch tätigen sowie das MQL5 Cloud Network nutzen.
Sie verpassen Handelsmöglichkeiten:
- Freie Handelsapplikationen
- Über 8.000 Signale zum Kopieren
- Wirtschaftsnachrichten für die Lage an den Finanzmärkte
Registrierung
Einloggen
Wenn Sie kein Benutzerkonto haben, registrieren Sie sich
Erlauben Sie die Verwendung von Cookies, um sich auf der Website MQL5.com anzumelden.
Bitte aktivieren Sie die notwendige Einstellung in Ihrem Browser, da Sie sich sonst nicht einloggen können.