YouTubeにあるマーケットチュートリアルビデオをご覧ください
ロボットや指標を購入する
仮想ホスティングで
EAを実行
EAを実行
ロボットや指標を購入前にテストする
マーケットで収入を得る
販売のためにプロダクトをプレゼンテーションする方法
MetaTrader 4のための無料のエキスパートアドバイザーとインディケータ - 24
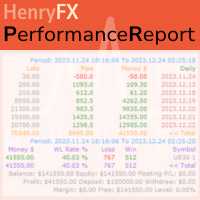
This Performance Report indicator is special design for some trader to analyst his/her performance.
FREE Version, included: - " Display Language "
- " Report Grouping "
- " Count Live Order "
- " Label Row Dis "
- " Label Font Size "
Performance Report Pro : : https://www.mql5.com/en/market/product/58287
Input Parameter: " Display Language "
:: [ English / Chinese ] Display language; " Report Title "
:: Show the report title as you want; " Report Grouping "
::
FREE

It's an expert to open and close orders on specific day and time. Expert open and close orders only with the same symbol it attached. Can set time open and close orders based day of year or day of week. Expert can send market orders and pending (stop or limit). Each order can placed with take profit and stop loss. There is option to use trailing stop loss and break even. Expert can manage only own orders or all orders of account.
Information about the expert's parameters can find on the blog .
FREE

ITS FREE I Recommend www.CoinexxBroker.com as a great broker and the one I personally use Asia session 1:00 to 9:00 (6pm est to 2 am est) Eur means London Session 10:00 to 18:00 (3 am est to 11 am est) USA means New York Session 15:00 to 23:00 (8 am est to 4 pm est) Session indicator highlights the start of each trading session. You can show all sessions or edit the settings to only show the hours you want highlighted (Asia) means Asian Session ,(Eur) means London Session , (USA) means New
FREE

The Multi-Timeframe High Low Points (MTF High Low Points) indicator is a powerful tool for traders using MetaTrader 4 (MT4) to analyze price movements across different timeframes. This versatile indicator helps traders identify significant support and resistance levels by displaying the highest and lowest price points within a specified number of bars on multiple timeframes simultaneously. Key Features: Multi-Timeframe Analysis: MTF High Low Points allows traders to monitor high and low price le
FREE
The Light Pullback Breakout Trading can determine the breakdown of price highs and lows and trade after a small pullback (depending on settings). It does not use risky methods, there are not as many settings as in the advanced version , but this EA is free and can trade on all currency pairs and timeframes. There are various settings for finding lines and filters for transactions. Full (extended version): https://www.mql5.com/en/market/product/41327 Differences from the free one: customizable
FREE

The purpose of this new version of the MT4 standard indicator provided in your platform is to display in a sub-window multiple timeframes of the same indicator. See the example shown in the picture below. But the display isn’t like a simple MTF indicator. This is the real display of the indicator on its timeframe. Here's the options available in the FFx indicator: Select the timeframes to be displayed (M1 to Monthly) Define the width (number of bars) for each timeframe box Alert pop up/sound/ema
FREE

The indicator shows entry points with Risk-Reward-Ratio 1 to 5. Main timeframe H1. Works on every pair. The main logic - is to find a reversal level, and then track the price reaction to this level. Doesn't need any settings. As a standard, it paint 5 levels of the same take-profit (red / blue for sellers and buys) and 1 stop-loss level - orange. ATTENTION! Test version of the indicator. Works only on the USDCAD pair! The full version can be bought here https://www.mql5.com/en/market/product/61
FREE
VolumeFX works placing pending orders up and down of the current price, taking benefits from the oscillations, so when the price its out of operation range a new batch of orders will be placed, allowing the program to work continously every time a new price range its shaped
All the parameters of the program may be modified, so you can adjust them to the pair you most like to operate, though the default parameters works well in the EURUSD pair with accounts of 500 usd or more. Here is how you ca
FREE

EA Protrader Pivot is a automate and semi-automate Expert Advisor based on candlestick charts. Each order set stop loss with 200points and take profit 250 points. If one of two orders reach stop loss the new order open with new lot size (start lot is 0.01 and max lot is 0.08 ). This EA was backtested with XAUUSD in time frame M15 and spread 20 point. Automate - EA open buy and sell orders based on levels of candlestick chart with the first volume is 0.01 if this order touch stop loss EA cont
FREE
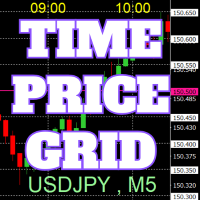
チャート上に、キリの良い数値で価格のグリッド、時刻のグリッドを描画します。
「パラメータの入力」から、各ピリオドごとに、価格の間隔設定が可能。 キリ番(ラウンドナンバー)のグリッドは、ほかの線より太く、目立つのでわかりやすいです。 キリ番(ラウンドナンバー)のグリッドは、ほかの線と異なる色に設定できます。
各所の色は、個別に設定できます。 シンボル、時間足を表示でき、場所も任意に設定できます。 時刻の表示は、上下どちらにするか設定できます。 表示する時刻は、サーバー時刻、ローカル(PCの時刻)、ユーザー設定(サーバーとの時刻差を任意で設定)から選べます。 無料でお使いになれます。 皆さんのトレードのお役に立てれば幸いです。
FREE
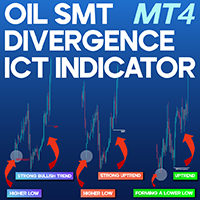
SMT Divergence ICT Oil Indicator MT4 The SMT Divergence Oil Indicator is a specialized MetaTrader 4 tool designed to identify divergence patterns between correlated assets. It assists traders in detecting price discrepancies across Crude Oil (XTIUSD), Brent Crude (XBRUSD), and the USD/CAD pair , offering insights into possible trend shifts or reversals. This indicator visually marks divergence areas on the chart, making it easier to recognize opportunities for buying or selling based on institut
FREE
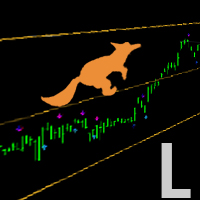
Search for an entry with low risk for trading by Lisek Moving Average Indicator. There are many ways to trade with Lisek Moving Average Indicator: Trend continuation (Trend trading). Trade pullbacks (Range trading). Trade breakouts. Trade reversals. Take profits or set stop-loss based on your MA.
Moving Averages are a frequently used technical indicator in forex trading, especially over 10, 50, 100, and 200 periods. Moving Averages are lagging indicators, which means they don't predict where p
FREE

Market Insider is an excellent indicator for scalping the trend and also trading market breakouts and reversals. It is based on a ATR measured volatility channel and the CCI indicator. The green trend line and green bars indicates an uptrend and the red trend line and red bars indicates a downtrend. An intensive price breakout of some of the trend lines indicates a market breakout and a potential new opposite trend. In choppy-range behaving market and in low liquidity conditions the breakout sig
FREE
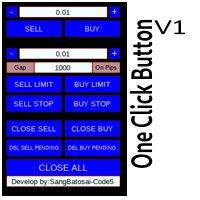
Simple button panel of trade on your chart with OneClick V1 Trial version. This trade panel will make it easier for you.
Equipped with several functions that make it very easy for you. More tools on OneClick VZ version, see here.
This version includes: Open Order Buy Open Order Sell Open Pending Order [Buy Limit - Buy Stop - Sell Limit-Sell Stop] Close ALL orders
Close Order Buy Close Order Sell Delete Pending Order [Buy Limit - Buy Stop - Sell Limit-Sell Stop] ENJOY IT!!! ONE CLICK V1 [TRIAL
FREE
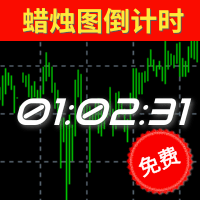
倒计时指标功能介绍 类别
解释
备注
预计结束倒计时 计算当前周期蜡烛图的结束时间(可应用于所有周期),其考虑了蜡烛图可能会因为日常休市而提前结束的情况; 如果该蜡烛图包含多个休市和开市的情况下,以最后的休市或者蜡烛图收盘时间为准。 值得特别注意的是:本指标并没有将平台额外公布的节假日休市、修改休市或者开市时间等因素纳入考虑范围,它仅仅是基于MT4所公开的交易时间做计算,无法100%确保本品种的收盘或者开盘时间无误 ,故使用者需提前明确该品种交易时间情况。
预计开盘倒计时 仅限于状态为"休市中"的提示,根据MT4上公开显示开市时间进行预估大约还有多久时间开盘; 和预计结束倒计时类似,并没有将额外公布的时间纳入考量。由于W1和MN1周期中包含多次的开盘和收盘,所以该两周期无休市提示。
【状态】 颜色 状态 备注 绿色 正常 一切正常 黄色 服务器无报价 服务器实际上传送到MT4并非是毫无中断的,可能是1分钟之内出现多次,甚至是连续较长的时间无报价,取决于您所处的网络延迟、服务器的情况等等。
本品种已有X秒无报价 MT4上并不是所有的品种的报价都是最新的,有可能某个品种长期无
FREE

Having trouble marking where the various forex sessions start and end? Or perhaps your strategy requires you trade only in a specific session, then this is for you.
The session indicator shades the session you require in a certain color so that you can identify it easily. The sessions shown include: London session, New York session, Asian Session, Asian - London overlap and London - New York Overlap.
Difference source give varying time ranges for the various session, mostly differing by not mo
FREE

NewsReleaseEA is an expert to trade about economic news uses pending orders. Expert receives data for events from ' http://forexfactory.com '." The expert can trade up 28 (31 with yuan) pairs from one chart. Expert has the option for manual strategy (user strategy) or uses one of five included strategies. Expert has analyzer for any trade to show information for any currency and any pair to help trader to make better strategy.
Include Strategies Custom_Stategy - There are too many options t
FREE

Fibonacci SR Indicator
This indicator creates support and resistance lines. This indicator is based on Fibonacci Retracement and Extension levels. It will consider many combinations of the Fibonacci levels and draw support/resistance lines based on these. This indicator uses tops and bottoms drawn by the ZigZag indicator in its calculations. The ZigZag can also be drawn on the chart, if necessary. The indicator considers many combinations of past reversal points and Fibonacci ratio levels, and w
FREE

Название стратегии: " Среднесрочный трендовый трейдинг "
Цель стратегии: Использование комбинации скользящих средних и индикатора относительной силы (RSI) для определения среднесрочных трендов и моментов входа в рынок.
Используемые индикаторы:
Скользящие средние (Moving Averages):
Длинная скользящая средняя: 50-периодная SMA (простое скользящее среднее)
Короткая скользящая средняя: 20-периодная SMA
Индикатор относительной силы (RSI):
Правила входа в позицию:
Покупка (Long Entry):
Когд
FREE

В основе индикатора TDI лежат следующие индикаторы: RSI, Moving Average, Bollinger bands, но основным из них нужно выделить RSI, весь расчет индикатора завязан от его значений.
Зеленая линия (линия RSI) – сглаженные простой (по умолчанию) скользящей средней значения индикатора RSI, период сглаживания 2.
Красная линия (сигнальная линия) – сглаженные простой (по умолчанию) скользящей средней значения индикатора RSI, период сглаживания 7.
Синие линии – индикатор Bollinger bands по умолчанию пери
FREE

The presented indicator allows you to visualize the current trend. The indicator identifies the trend using the following definition as an algorithm: A trend is a situation when each subsequent maximum price rise is higher/lower than the previous one, and similarly each subsequent maximum price fall is higher/lower than the previous one; The beginning of a new trend is considered to be when the current maximum/minimum overcomes all maximums/minimums of a specified number of previous bars. The i
FREE

Fractals ST Patterns is a modification of Bill Williams' Fractals indicator. Unlike a standard Fractals indicator, Fractals ST Patterns allows setting any number of bars to find a fractal. This simple indicator corresponds to the parameters specified in the ST Patterns Strategy ( https://stpatterns.com/ ) . Structural Target patterns are the market itself, which is consistently divided into components. For the formation of ST Patterns , no trend lines, geometric proportions of the model itself,
FREE

FOREXBOB AUTO CLOSER is a very handsome tool for manual traders who doing :- Scalping Correlation Hedging Those who use averaging methods etc. As this utility tool will help you by closing all your running trades when the universal floating P/L reaches a certain value that you will put in inputs. You may enable and disable the alert message on your mobile phone when auto closer close all the running deals on specified profit. You may add any message you want in notification. This tool consid
FREE
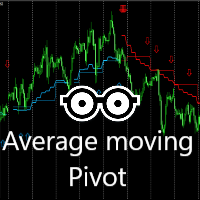
This indicator is very effective for trading everyday. A combination of moving averages and 2X Pivots calculation to produce a very convincing signal everyday. Blue colour signals a buy opportunity. Follow the arrows for possible buy points. The Blue pivots and average line, serves as possible support. Red colour signals a sell opportunity. Follow the arrows for possible sell points. The Red pivots and average line, serves as possible resistance. Best use on the 15 minutes, 30 minutes or 1 hour
FREE
This EA using linear regression strategy, EA can identify key price points—entry price, stop-loss price, and exit prices. Price and time period determine the system parameters for linear regression, making the method universally applicable. Linear regression is the analysis of two separate variables to define a single relationship and is a useful measure for technical and quantitative analysis in financial markets. Requirements and Recommendations EA specifically for the USDJPY pair on the H4
FREE

One-Click Close: Efficient Trade Management Tool Product Description One-Click Close is a powerful and user-friendly trading assistant designed to enhance your trading efficiency on the MetaTrader platform. With a simple and intuitive interface, you can quickly manage all positions and easily respond to market changes. Key Features One-Click Close Long Positions : Instantly close all long positions. One-Click Close Short Positions : Quickly close all short positions. One-Click Close All Positio
FREE

This is a multitimeframe RSI indicator defining trends, oversold/overbought zones, as well as all intersections of signal lines from different timeframes on a single chart using arrows and audio alerts. When working with standard RSI, we often need to examine data from all necessary timeframes simultaneously. RSI 7TF solves this issue. If you are only interested in audio signals when signal lines are crossed, then have a look at RSI Alerts . Attention! The indicator uses seven timeframes - M5, M
FREE

Circuit Expert Advisor. EA uses arbitrage system of entering both direction of the market. In addition EA has built in Filter Engine for triggering the trades. All trades covered by fixed Stop Loss & Take Profit. No Grid, No Martingale, Works with high spread. This EA operates only once per bar opening. Fast methods of strategy testing and optimization are valid. User can test / optimize by model: (control point) / (open prices only) developed, tested and optimized on " Vantag
FREE

Main: Not martingale, not a grid; Working on all symbols;
Signals: There is a good rational algorithm. Work of two indicators: Envelopes and Moving Average (you can set a separate Timeframe for each indicator)
Stop Loss/Take Profit: There is a good money management system (there are several type for trailing stop loss); There is virtual levels of Stop Loss / Take Profit; There is smart lot (percent by risk) or fix lot
Important: EA can work on closed candles, and on current candles; Quickly
FREE

"Raven" is an expert scalper who does not use dangerous strategies in his work. It trades at the extremes of the pullback, according to the trend. Channel scalping means confidence, reliability and minimal risks. The Expert Advisor implements all types of stops from the percentage of the balance to the signal stop, so you can always control your balance and not worry. It is recommended to use a signal stop - this will optimize losses and increase profits.
The first 10 copies are priced at $ 10
FREE

GMMAインジケーター移動平均線の束が海の波のようなところが視覚的に見やすいので使用してましたが、 MT4で12本の移動平均線描画するとちょっと邪魔だなぁと感じてました。 とりあえず4本あれば私には十分なので、一目均衡表の雲みたいに見やすくすることを目的として作成しました。 長期と短期が交わるところを色を変更したので、交差してる部分も見やすくなってると思います。
今後バージョンアップするとしたら、長期短期交差の色を設定で変更できるようにしようかな。
他の製品 https://www.mql5.com/ja/users/studiotam/seller
これ以上何も書くことないんですが、文字数制限あるんですよね。
FREE
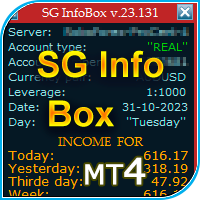
The "InfoBox" utility is designed to display the presence of open orders, the number of lots, current profit and much more in one window. The version for the MT5 platform is here .
You've probably encountered a situation where you have an advisor that works on a currency pair, but information about its operation: - orders and their number, the size of the spread for the instrument, the volume of lots on the market, drawdown and much more - are scattered in different places of the terminal and
FREE

Forex Trade Manager Grid MT4 helps you to managing orders and achieve the goal. You only need to place first order with Take Profit, run EA and set in params profit (pips) you want to get. EA will be managing your positions, as will gather appointed amount of pips. It’s a strategy for management of manual trades opened on current pair. The strategy adds positions to currently opened trades in a grid management (with chosen distance in pips between trades) - up to 15 trades (or less). First up to
FREE

Are you ready to take your trading game to new heights? Introducing Quantum Fx, the ultimate Expert Advisor designed to enhance your trading strategy and maximize your profit potential in the forex market. In this groundbreaking video, we unveil the remarkable features and benefits of Quantum Fx, empowering you to trade with confidence and precision. Whether you're a novice trader or an experienced investor, this EA is tailored to cater to your unique trading goals. Key Features of Quantum Fx: A
FREE
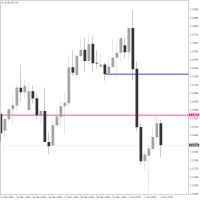
Crosshair Levels : Free version of Object Synchronizer. ** No synchronization of objects among grouped charts and no group chart features supported in this version. Are you bored to save and load template many times for the same symbol for many chart time frames? Here is the alternative. With this indicator, you enjoy creating 3 objects. All objects that you created/modified always are moved easily with clicking the object, moving cursor to the point you wanted and clicking again). Supported
FREE

This Expert Advisor is our latest trading system and it is designed to work with EURUSD and GBPUSD . This EA produces good results with medium spreads. It opens a market order following the market trend and then it opens Market Orders with different amount of lots to close all orders or single order in profit with small amounts. To close trades, it uses a cumulated closing function or a closing function for each trade opened. It works with all time frames, better with lower TF, and you can us
FREE

1.毎月、毎週、および毎日のピボットは、各期間の開始データと終了データを使用して計算されます。
2.これにより、グラフ上に簡単な線が表示され、要点がどこにあるかを識別し、計算の誤差を減らすことができます。
3.インジケータは、ピボットの計算方法がわからなくても、楽器の主なピボットをすばやく定義するのに役立ちます。
あなたはより良い価格の位置を理解することができるようにあなたはまた、毎週と毎日のピボットを比較することができます。
5この指標は、あなたがより効果的に抵抗や支持に近いところで取引するのを助けます。
1. Maitsuki, maishū, oyobi mainichi no pibotto wa, kaku kikan no kaishi dēta to shūryō dēta o shiyō shite keisan sa remasu. 2. Kore ni yori, gurafu-jō ni kantan'na-sen ga hyōji sa re, yōten ga doko ni aru ka o shikibetsu shi, keisan no go
FREE

The indicator works as an extension that recolors the candles and the background in the terminal at the click of a button (Night Theme / Day Theme). The user can also set the display of the watermark of the symbol, and specify its size. The interactive menu allows you to toggle the display of the Ask value. And switch chart scaling from adaptive to fixed with one click.
You can add your favorite color to the settings for switching.
FREE

Este indicador irá ajudá-lo a traçar as linhas do horizonte ( Marcelo Ferreira ) do Grafico semanal. Você poderá mudar trabalhar por exemplo em M5 ou M15. As linhas semanais permanecerão lá. Analisar as tendências em gráficos semanais antes de fazer uma entrada no mercado Forex é essencial para identificar a direção predominante do mercado a longo prazo. Esse tipo de análise ajuda a evitar decisões impulsivas baseadas em flutuações de curto prazo e fornece uma visão mais clara sobre o movimento
FREE

本指标是根据黄金分割理论,分别获取过去22(默认)根K线高低价,并通过黄金分割系数计算得出支撑、压力曲线。 当价格第一次向上靠近压力线,或者多次靠近压力线时,会出现向下的箭头符合,提示有压力,适宜做空sell; 当价格第一次向下靠近支撑线,或者多次靠近支撑线时,会出现向上的箭头符合,提示有支撑,适宜做多buy; 在数据窗口,会提示各条支撑、压力线的价格数值,出现的箭头符合数值为up、down。
这个指标,适合在所挂的图表里做短线,也即进场开仓后,持仓几根K线柱,然后可以平仓。做多的话,止损可以在支撑线下方,止盈在压力线附近。做空的话,止损可以在压力线上方,止盈在支撑线附近。
本指标涉及的黄金分割系数分别为0.382、0.618、1.618、2.168、4.236,计算得到对应的支撑压力线。 由于MT4的指标数量有限,本指标分成了2个EX4文件,第一个的黄金分割系数为0.382、0.618、1.618,第二个为2.168、4.236,第二个文件名为“Golden Ratio Support Pressure Indicator extend”,可免费下载和使用。
FREE
Is Zero Lag profitable? Not always, different system is for different pairs. You can play around with this indicator from Mladen, I have modified it with Bollinger Bands over T3.
You can change the period and how it calculate. MT5 version is available too.... Please leave a review , it helps us and we will share more indicators. .... Thank you and happy trading
FREE

Features: Find these engulfing patterns: Simple Engulf Stick Sandwich Engulf Three Line Strike Rising Three Morning Star Doji Scanner is useful to make your strategy better. Don't always go by Win/Loss percentage. Because this tool is not based on past results. Basic Settings: For All Patterns You can set: First:Last Candle Ratio This will make sure that the earlier opposite candle is at least this given ratio in height as compared to the engulfing candle. This is not checked for Three Line Stri
FREE
DESCRIPTION 3 Bar Break is based on one of Linda Bradford Raschke's trading methods that I have noticed is good at spotting potential future price volatility. It looks for when the previous bar's High is less than the 3rd bar's High as well as the previous bar's Low to be higher than the 3rd bar's Low. It then predicts the market might breakout to new levels within 2-3 of the next coming bars. Must also be traded during the active hours of the market you want to trade. EG EURUSD 7am - 5pm This
FREE

The " CatchTheWave EASY " adviser is a lightweight version of the adviser of the same name. This Expert Advisor uses many different strategies to determine the most accurate entry points into the market.
One of the key features of " CatchTheWave EASY " is the use of a grid when trading. This means that the Expert Advisor creates orders at various price levels, providing a potentially profitable position in any direction of the market. In addition, the Expert Advisor has the ability to effectiv
FREE
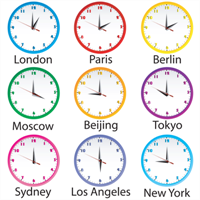
The EA is meant for opening trades at a certain time. All parameters of trades being opened are adjustable: take profit, stop loss, opening time, opening direction (may be both directions), lot of orders. The EA has 12 settings for different opening time, however the EA can also open trades at the same time if required. Just keep in mind that the EA can perform 12 various operations at different time and with different take profit, stop loss, etc.
Settings: Lot_1 = 0.1 - lot for the first setti
FREE

Defines extremes. This indicator consists of two parts. The first draws lines on the chart indicating low volatility in relative daily market activity. The second is responsible for determining the extremum and gives signals to buy or sell. This system is suitable for all instruments. It is recommended to use a timeframe from m15 to h4. Before using, you need to choose the settings for yourself. Configure lines deviation. Specify volatility coefficient. Advantages The indicator does not repaint
FREE

概要:
カラー付きパラボリックSARインジケーター は、トレンドフォローやトレードの判断を簡単にするために設計された、視覚的に強化された取引ツールです。このカスタマイズ可能なインジケーターは、MT4チャート上で強気(買い)および弱気(売り)トレンドのためのカラーコード化された明確な視覚的シグナルを提供します。 主な特徴: カラーコード化されたシグナル: 買いシグナルにはライムグリーンの「o」シンボルを表示。 売りシグナルには赤色の「o」シンボルを表示。 カスタマイズ可能な入力: パラボリックSARの計算を微調整するための、調整可能な「ステップ(Step)」と「最大値(Maximum)」パラメータ。 トレーディングスタイルやチャートの外観に合わせて線の太さや色をカスタマイズ可能。 シンプルで効果的なビジュアル: 価格ローソク足の上下に描画される明確なシンボルで、強気と弱気のトレンドを簡単に識別可能。 市場状況を瞬時に評価するのに役立ちます。 互換性: MT4がサポートするすべての銘柄とタイムフレームで動作します。 対象者: パラボリックSARをトレーディング戦略に簡単に統合したいトレー
FREE

This oscillator has become one of the main tools of most professional traders. The indicator includes a classical MACD ( Moving Average Convergence/Divergence ) line, a signal line, as well as a MACD histogram. Exponential moving averages are used in the calculation. The indicator also provides the ability to enable signals on identification of divergences between the price graph and the indicator. Divergences are identified using three patterns: classic, hidden and extended divergences.
Indica
FREE
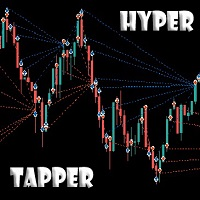
Hello everyone!
This Expert Advisor is developed based on hypertaping. Tick strategy, you won't be bored! The telegram group: https://t.me/FXAdvisorsMy Attention! Amazing results in a short trading period. Please pay attention to the increased risk, in order to trade it you need to have experience in trading with high leverage. The recommended minimum deposit is 2000 USD on a dollar account or 20 USD on a cent account. If you have any questions, do not hesitate to write to me.
FREE
Echo One:
The provided robot is a result of several Test of trading many many strategies,various indicators of forecasting,
To make the best decision for making profits in markets. By combining several strategies and algorithms in this robot, at changing each tick price, with the utmost precision and speed Real account has been opened where it will be possible to analyze the entire history, as well as constantly, in real time, monitor all current results:
https://www.mql5.com/en/signals/71523
FREE
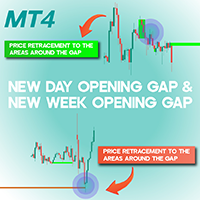
New Day Opening Gap and New Week Opening Gap NWOG NDOG MT4 The Daily and Weekly Opening Gaps (NDOG & NWOG) Indicator is designed for both novice and experienced traders on the MetaTrader 4 platform. It detects price gaps that occur at the start of a new trading day or week and visually represents them on the chart. When the market reopens after a daily or weekly close, there is often a price difference from the previous session’s closing value, leading to an opening gap. The indicator highlight
FREE

この無料ツールが気に入ったら、5 つ星の評価を残してください。 どうもありがとう :) 「リスク管理アシスタント」エキスパートアドバイザーコレクションは、さまざまな市場状況にわたるリスクを効果的に管理することで取引戦略を強化するように設計された包括的なツールスイートです。 このコレクションは、平均化、スイッチング、ヘッジのエキスパート アドバイザーという 3 つの主要なコンポーネントで構成されており、それぞれがさまざまな取引シナリオに合わせた明確な利点を提供します。
この EA は、市場の標準的なリスク管理戦略を発展させたものです。
https://www.mql5.com/ja/blogs/post/756961
1.「平均化アシスタント」EA: MT4: https://www.mql5.com/ja/market/product/115468 MT5: https://www.mql5.com/ja/market/product/115469 2.「スイッチングアシスタント」EA: MT4: https://www.mql5.com/ja/market/product/1
FREE

This Ea is for the sole purpose of protecting your account.
When the basket of operations present in the terminals reach a set profit in currency terms, the expert will close all trades.
It will replicate the same behavior if the loss limit is reached.
It is a simple but at the same time useful expert advisor for safeguarding the account and always keeping it active.
It can be placed on any time frame or graph, the important thing is that it is inserted only once.
FREE
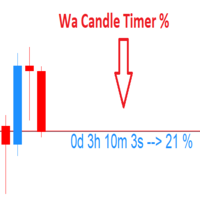
Wa Candle Timer Percentage MT4 is an indicator which shows the user how much time is remaining until the next candle will form. The percentage of the evolution of the current candle is also displayed. The user can set the percentage that the candle timer will change the color. These are the settings: 1- The percentage that the candle timer will change the color. 2- Color of Candle Timer when it's BELOW the percentage set by the user. 3- Color of Candle Timer when it's ABOVE the percentage set b
FREE

Check my p a id tools they work perfect please r ate Adjustable PIN BAR indicator is usefull tool alowing to search for pin bars you wish to find on the price chart, it has 2 parameters to filter out what type of pin bars you wish to search for: 1) MinTailProc 75% (default) which means to show pin bars that has minimum size of the Nose (Tail) as 75% of full candle size. If Upper Nose (Tail) size of the candle is minimum 75% of the candle size fully than candle is painted in RED. If Lower Nose
FREE

This indicator calculates and draws lines over the chart. There are two types of trends: Trend A: the line is drawn using local lows for uptrends and local highs for downtrends Trend B: the line is drawn using local highs for uptrends and local lows for downtrends There are a few conditions, which have to be fulfilled and can be changed by the parameters (see also picture 4): MinBarAge : the count of bars to the last base point of a line is called BarAge and has to be greater than the parameter
FREE

指標は、ロットの最大数と最小数、およびシンボルのスプレッドのサイズを示します。
この情報は、迅速かつ大規模な利益を達成するために、最大入金額に基づいて市場に参入することを迅速に決定するために必要です。利用可能な資金と1ロットを開くための資金に基づいて計算されます。
このような状況は、さまざまなForexコンテストに参加したり、最大限の手段で市場を取引したり、ボラティリティが増減した期間に迅速かつ大きな利益を達成したりする場合によく発生します。
インジケーターは、ツールウィンドウに接続すると、すぐに必要な情報が表示されます。ツールウィンドウでフォントサイズを変更したり、情報を置き換えたりする必要がある場合は、インジケーターの設定で変更できます(スクリーンショットを参照)。
Fontsize-フォントサイズ。 Xdistance-アンカー角度を基準としたピクセル単位のX座標距離。 Ydistance-アンカー角度に対するピクセル単位のY座標の距離。
著者の製品に関する追加情報......
FREE
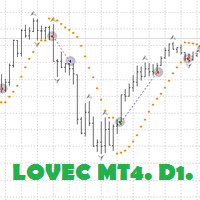
Hello! Lovec MT4 robot.
Designed exclusively for working on the trend on the weekly chart D1. I bring to your attention an Advisor of my own design. The settings are universal for all currency pairs. Most instruments are suitable, especially trending currency pairs with JPY, CHF, GBP. As well as futures and indices. The inputs are performed exclusively at the opening of the candle, which gives an ideal performance the same as in the tester and without slippage. Exit the transaction by a combin
FREE

MT4 Position manager
- Open/Sell buttons for open orders - Lot size, SL, TP for positions - "Set Breakeven" button for set SL on all opened positions - "Set TP" button for set TP on all opened positions - "Close Half lot" button for closing all open positions half lot size( opened 1.0Lot, click the button and automated close 0.5Lot) - "Positions Half Close" button for close open positions half qty. (Opened 10 position, ckick the button and automated close 5 positions) - "Close All" button for
FREE
SmartClose(Close All Orders) helps you close all your trades. You can use it on any symbol. You can also set a warm value to manage the risk. With these functions: Close Open Orders : Close all open trades in the trading account. You don't need to set a value for the "value" parameter. Close by Profit : Close trades when profit reaches a specific predefined level. You need to set a value for the "value" parameter. Close by Percentage : Close trades based on a certain percentage of the balance.
FREE

This indicator provides common shapes as drawing object options. The shapes are rotatable, resizable, draggable, and will keep their proportions (according to their handle trendline) across different chart scales. Multiple drawings are supported.
Shapes: Square Rhombus
Triangle (quadrilateral & isosceles) Circle (grid, overlapped grid, flexi grid, rotatable grid, concentric circles) Features: rays (all object edges will be rays) show/hide each individual drawing type, or all delete last drawn ob
FREE

Retracement Reversal and Support and Resistance Pro is based on a formula used by Proprietary trading firms and other big institutions on WallStreet including on my Company and used by my traders here in the capital of the world. This indicator will create Red and Green arrows on a possible mayor Retracement level, Reversal Level and future Support and Resistance levels and Yellow arrows on a possible m i nor Retracement level, Reversal Level and future Support and Resistance levels . This in
FREE
The presented product is the author's implementation of the REI (Range Expansion Index) indicator developed by Thomas DeMark. REI Oscillator AM is an indicator that measures the rate of price change and signals overbought/oversold conditions if the price shows weakness or strength. The indicator value changes within the range from -100 to +100. Thomas DeMark suggests using the default period of 8 and the following algorithm for using the indicator: When the price rises above level 60 and then fa
FREE

The indicator is designed for displaying the following price levels on the chart: Previous day's high and low. Previous week's high and low. Previous month's high and low. Each of the level types is customizable. In the indicator settings, you set line style, line color, enable or disable separate levels. The version of the exact same indicator but only with sound alerts there - Time Levels with Alerts .
Configurations ----Day------------------------------------------------- DayLevels - enable/
FREE

This versions is free because a dangerous strategy is used.
If you want to see my full and best product (not dangerous), check it out : https://www.mql5.com/en/market/product/82662
I'm sharing with you a scalping strategy who is designed especially on GBPNZD timeframe M5 . Scalping GBPNZD is a scalper who is not spread sensitive. Scalping GBPNZD 's backtest is around 70% of winrate. Scalping GBPNZD is very easy to use. Scalping GBPNZD is using a dangerous strategy. Scalping GBPNZD is a
FREE
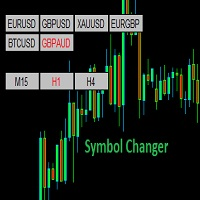
Symbol Changer (Custom) Indicator
This is a simple yet intuitive indicator. And its free.
The indicator provide easy navigation across various symbols and across different time frames all in a chart.
The buttons are displayed on the main chart.
It is flexible and easy to use with fast response speed.
FEATURES
UniqueID : This identifies the pairs for each chart
Use Custom Pairs : If set to true, load all the available symbols in the Market Watch. No means it loads the pairs selected be
FREE

InpRSIshort =13; // RSI short InpRSIPeriod =34; // RSI long PeriodRs =0; //Price 0C 4HL/2 5HLC/3 mafast =13;//mafast maslow =65;//MAslow
Double line RSI sub graph index. The parameters are adjustable. The RSI lines with two different cycles can be used to observe the trend strength effectively. Meanwhile, a short period cross long period color column image is displayed below. When the cycle (Jin Cha) is on the short cycle, the color of the column map changes from the light green to the
FREE

VANEXIO USES THE TREND WAVE INDICATOR AND IT CAN IDENTIFY THE BEGINNING AND THE END OF A NEW WAVE TREND MOVEMENT.
AS AN OSCILLATOR, THE INDICATOR IDENTIFIES THE OVERBOUGHT AND OVERSOLD ZONES.
IT WORKS GREAT TO CATCH THE SHORT TERM PRICE REVERSALS AND USES A MARTINGALE STRATEGY TO CLOSE ALL TRADES IN PROFIT.
USE DEFAULT SETTINGS ON H1 OR HIGHER TIME FRAME ON ANY PAIR FOR MORE ACCURATE TRADES
WHY THIS EA :
Smart entries calculated by 5 great strategies The EA can be run on even a $20000 acco
FREE

Uses of EA: Close orders and close charts when conditions are met. in_Test: + True: there is a command when running in Backtest mode. + False: Not entered, used for real time in_Closebyprofit: + true: use payment in USD + false: do not use closed in USD in_profit_win: stop rate (USD) in_profit_loss: stop loss (USD) in_Closebypercent: + true: use close to percent of balance + false: do not use the percent percent of balance in_profit_win: percent stop rate in_profit_loss: perce
FREE

Diversify the risk in your trading account by combining our Expert Advisors. Build your own custom trading system here: Simple Forex Trading Strategies
The expert advisor opens trades after CCI indicator exit the oversold or overbought areas. The Stop Loss, Take Profit, and Trailing Stop are calculated based on the ATR indicator. The recommended currency pair is GBPUSD and the recommended timeframe to operate and to do backtests is D1. This Expert Advisor can be profitable in any TimeFrame a
FREE
MetaTraderマーケットは、履歴データを使ったテストと最適化のための無料のデモ自動売買ロボットをダウンロードできる唯一のストアです。
アプリ概要と他のカスタマーからのレビューをご覧になり、ターミナルにダウンロードし、購入する前に自動売買ロボットをテストしてください。完全に無料でアプリをテストできるのはMetaTraderマーケットだけです。
取引の機会を逃しています。
- 無料取引アプリ
- 8千を超えるシグナルをコピー
- 金融ニュースで金融マーケットを探索
新規登録
ログイン