
インディケータエミッションの積分特性計算
はじめに
インディケータエミッションは時系列の研究において新しくひじょうに有望な方向を示してくれます。その分析はインディケータ自体ではなく、マーケット環境推測を実際に行う基となる将来または過去へのエミッションに目を向けることが特徴です。
- 将来のサポートレベルおよびレジスタンスレベル
- トレンド方向(価格動向)
- 過去に集積された動きの強さ
私は以前の記事 『 MQL5におけるインディケータ Emission の描写』でエミッション描写のアルゴリズムを取り上げ、その主要ファクターを特定しました。 思い出してください。
エミッションは対象インディケータに特有の線の交点にある一連の点です。
次にエミッションポイントには特殊な点がいくつかあります。
- 同じタイプのエミッションポイントはクラスター化する傾向にあります。
- クラスター密度の高い部分は価格を惹きつけるか、反対に反発させます。
エミッションギャラリー
 |
 |
|---|---|
 |
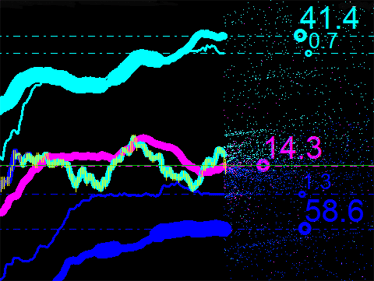 |
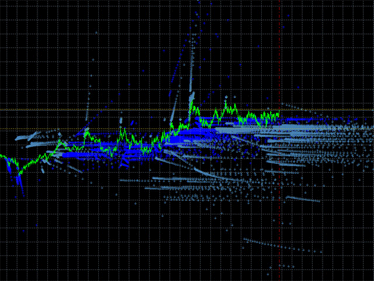
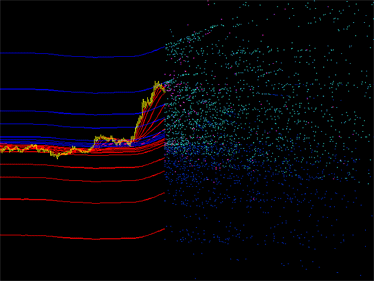
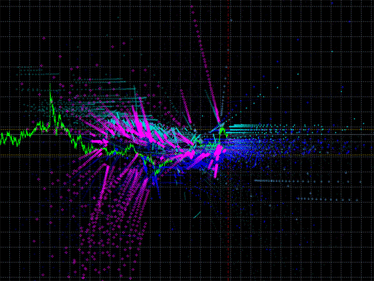
図1 インディケータエミッションのプロット例左: DCMV インディケータのエミッション右: iMA および iEnvelopesインディケータのエミッション
エミッションの積分特性の計算の説明では、以下のような入力パラメータを持つ移動平均のエンベロープ(Envelopes)および移動平均(Moving Average)そのものを取りあげます。
//--- external variable for storing averaging period of the iEnvelopes indicator
input int   ma_period=140; // averaging period of the iEnvelopes indicator
//--- array for storing deviations of the iEnvelopes indicator
double      ENV[]={0.01,0.0165,0.0273,0.0452,0.0747,01234,0.204,0.3373,0.5576,0.9217,1.5237};
//--- array for storing iMA indicator periods
int         MA[]={4,7,11,19,31,51,85};
選択したインディケータに特有の線の交点を探します。線の数およびその特性(平均期間と偏差)はランダムに選ばれます。 エミッションは実のところこれらインディケータのあらゆるパラメータセットを使用してプロットすることができます(スペースで交わる限り)。
インディケータを選んだところで、エミッション分析の基本プログラムの役割をする Expert Advisor 作成に進みます。テクニカルインディケータ iMA と iEnvelopes から計算されたデータを取得する必要があります。そこでExpert Advisors におけるテクニカルインディケータの利用ガイドに記載のある手法を利用することを提案します。
交点を見つける必要のある線をプロットするには、線それぞれに2点を設定するだけです。よって 2 本のバーについてのインディケータ値を取得するだけで十分です(たとえば、現在バーおよび前回バー)。前回バーの価格は静的です。一方現在バーの価格は動的です。そのため新しい点は新規ティックのたびに作成され続けます。以下がコードです。
//+------------------------------------------------------------------+
//|                                      emission_of_MA_envelope.mq5 |
//|                                           Copyright 2013, DC2008 |
//|                           https://www.mql5.com/ru/users/DC2008 |
//+------------------------------------------------------------------+
#property copyright "Copyright 2013, DC2008"
#property link      "https://www.mql5.com/ru/users/DC2008"
#property version   "1.00"
//---
#include <GetIndicatorBuffers.mqh>
#include <Emission.mqh>
//--- external variable for storing averaging period of the iEnvelopes indicator
input int   ma_period=140;      // averaging period of the iEnvelopes indicator
//--- array for storing deviations of the iEnvelopes indicator
double      ENV[]={0.01,0.0165,0.0273,0.0452,0.0747,01234,0.204,0.3373,0.5576,0.9217,1.5237};
//--- array for storing the iMA indicator periods
int         MA[]={4,7,11,19,31,51,85};
//--- array for storing pointers to the iMA and iEnvelopes indicators
int         handle_MA[];
int         handle_Envelopes[];
//--- market data
datetime    T[],prevTimeBar=0;
double      H[],L[];
#define     HL(a, b) (a+b)/2
//--- class instances
CEmission      EnvMa(0,300);
PointEmission  pEmission;
//--- drawing styles for points of emission
#define     COLOR_UPPER  C'51,255,255'
#define     COLOR_LOWER  C'0,51,255'
#define     COLOR_MA     C'255,51,255'
color       colorPoint[]={COLOR_UPPER,COLOR_LOWER,COLOR_MA};
CodeColor   styleUpper={158,COLOR_UPPER,SMALL};
CodeColor   styleLower={158,COLOR_LOWER,SMALL};
CodeColor   styleMA={158,COLOR_MA,SMALL};
//+------------------------------------------------------------------+
//| Expert initialization function                                   |
//+------------------------------------------------------------------+
int OnInit()
  {
   ArraySetAsSeries(T,true);
   ArraySetAsSeries(H,true);
   ArraySetAsSeries(L,true);
//---
   int size=ArraySize(MA);
   ArrayResize(handle_MA,size);
//--- create a pointer to the object - the iMA indicator
   for(int i=0; i<size; i++)
     {
      handle_MA[i]=iMA(NULL,0,MA[i],0,MODE_SMA,PRICE_MEDIAN);
      //--- if an error occurs when creating the object, print the message
      if(handle_MA[i]<0)
        {
         Print("The iMA object[",MA[i],"] has not been created: Error = ",GetLastError());
         //--- forced program termination
         return(-1);
        }
     }
//---
   size=ArraySize(ENV);
   ArrayResize(handle_Envelopes,size);
//--- create a pointer to the object - the iEnvelopes indicator
   for(int i=0; i<size; i++)
     {
      handle_Envelopes[i]=iEnvelopes(NULL,0,ma_period,0,MODE_SMA,PRICE_MEDIAN,ENV[i]);
      //--- if an error occurs when creating the object, print the message
      if(handle_Envelopes[i]<0)
        {
         Print("The iEnvelopes object[",ENV[i],"] has not been created: Error = ",GetLastError());
         //--- forced program termination
         return(-1);
        }
     }
//---
   return(0);
  }
//+------------------------------------------------------------------+
//| Expert deinitialization function                                 |
//+------------------------------------------------------------------+
void OnDeinit(const int reason)
  {
//---

  }
//+------------------------------------------------------------------+
//| Expert tick function                                             |
//+------------------------------------------------------------------+
void OnTick()
  {
//--- market data
   CopyTime(NULL,0,0,2,T);
   CopyHigh(NULL,0,0,2,H);
   CopyLow(NULL,0,0,2,L);
//--- fill the declared arrays with current values from all indicator buffers
   string name;
   uint GTC=GetTickCount();
//---- indicator buffers
   double   ibMA[],ibMA1[];      // arrays for the iMA indicator
   double   ibEnvelopesUpper[];  // array for the iEnvelopes indicator (UPPER_LINE)
   double   ibEnvelopesLower[];  // array for the iEnvelopes indicator (LOWER_LINE)
   for(int i=ArraySize(handle_MA)-1; i>=0; i--)
     {
      if(!CopyBufferAsSeries(handle_MA[i],0,0,2,true,ibMA))
         return;
      //---
      for(int j=ArraySize(handle_Envelopes)-1; j>=0; j--)
        {
         if(!GetEnvelopesBuffers(handle_Envelopes[j],0,2,ibEnvelopesUpper,ibEnvelopesLower,true))
            return;
         //--- find the intersection point of the iEnvelopes(UPPER_LINE) and iMA indicators
         pEmission=EnvMa.CalcPoint(ibEnvelopesUpper[1],ibEnvelopesUpper[0],ibMA[1],ibMA[0],T[0]);
         if(pEmission.real) // if the intersection point is found, draw it in the chart
           {
            name="iEnvelopes(UPPER_LINE)"+(string)j+"=iMA"+(string)i+(string)GTC;
            EnvMa.CreatePoint(name,pEmission,styleUpper);
           }
         //--- find the intersection point of the iEnvelopes(LOWER_LINE) and iMA indicators
         pEmission=EnvMa.CalcPoint(ibEnvelopesLower[1],ibEnvelopesLower[0],ibMA[1],ibMA[0],T[0]);
         if(pEmission.real) // if the intersection point is found, draw it in the chart
           {
            name="iEnvelopes(LOWER_LINE)"+(string)j+"=iMA"+(string)i+(string)GTC;
            EnvMa.CreatePoint(name,pEmission,styleLower);
           }
        }
      //---
      for(int j=ArraySize(handle_MA)-1; j>=0; j--)
        {
         if(i!=j)
           {
            if(!CopyBufferAsSeries(handle_MA[j],0,0,2,true,ibMA1))
               return;
            //--- find the intersection point of the iMA and iMA indicators
            pEmission=EnvMa.CalcPoint(ibMA1[1],ibMA1[0],ibMA[1],ibMA[0],T[0]);
            if(pEmission.real) // if the intersection point is found, draw it in the chart
              {
               name="iMA"+(string)j+"=iMA"+(string)i+(string)GTC;
               EnvMa.CreatePoint(name,pEmission,styleMA);
              }
           }
        }
     }
//--- deletion of the graphical objects of emission not to stuff the chart
   if(T[0]>prevTimeBar) // delete once per bar
     {
      int  total=ObjectsTotal(0,0,-1);
      prevTimeBar=T[0];
      for(int obj=total-1;obj>=0;obj--)
        {
         string obj_name=ObjectName(0,obj,0,OBJ_TEXT);
         datetime obj_time=(datetime)ObjectGetInteger(0,obj_name,OBJPROP_TIME);
         if(obj_time<T[0])
            ObjectDelete(0,obj_name);
        }
      Comment("Emission © DC2008       Objects = ",total);
     }
//---
  }
この Expert Advisor の詳細にいちいちこだわることはしません。ここで留意する主要なことがらは、エミッションをプロットするために計算をする CEmission クラスインスタンスを使用し、任意の 2 本線の交点を表示することです。
//+------------------------------------------------------------------+
//|                                                     Emission.mqh |
//|                                           Copyright 2013, DC2008 |
//|                           https://www.mql5.com/ru/users/DC2008 |
//+------------------------------------------------------------------+
#property copyright "Copyright 2013, DC2008"
#property link      "https://www.mql5.com/ru/users/DC2008"
#property version   "1.00"
#define  BIG   7    // point size
#define  SMALL 3    // point size
//+------------------------------------------------------------------+
//| pMABB structure                                                  |
//+------------------------------------------------------------------+
struct PointEmission
  {
   double            x;       // X-coordinate of the time point
   double            y;       // Y-coordinate of the price point
   datetime          t;       // t-coordinate of the point's time
   bool              real;    // whether the point exists
  };
//+------------------------------------------------------------------+
//| CodeColor structure                                              |
//+------------------------------------------------------------------+
struct CodeColor
  {
   long              Code;    // point symbol code
   color             Color;   // point color
   int               Width;   // point size
  };
//+------------------------------------------------------------------+
//| Base class for emissions                                         |
//+------------------------------------------------------------------+
class CEmission
  {
private:
   int               sec;
   int               lim_Left;   // limiting range of visibility in bars
   int               lim_Right;  // limiting range of visibility in bars

public:
   PointEmission     CalcPoint(double   y1,  // Y-coordinate of straight line 1 on bar [1]
                               double   y0,  // Y-coordinate of straight line 1 on bar [0]
                               double   yy1, // Y-coordinate of straight line 2 on bar [1]
                               double   yy0, // Y-coordinate of straight line 2 on bar [0]
                               datetime t0   // t-coordinate of the current bar Time[0]
                               );
   bool              CreatePoint(string name,            // point name
                                 PointEmission &point,   // coordinates of the point
                                 CodeColor &style);      // point drawing style
                                 CEmission(int limitLeft,int limitRight);
                    ~CEmission();
  };
//+------------------------------------------------------------------+
//|                                                                  |
//+------------------------------------------------------------------+
CEmission::CEmission(int limitLeft,int limitRight)
  {
   sec=PeriodSeconds();
   lim_Left=limitLeft;
   lim_Right=limitRight;
  }
//+------------------------------------------------------------------+
//|                                                                  |
//+------------------------------------------------------------------+
CEmission::~CEmission()
  {
  }
//+------------------------------------------------------------------+
//| The CalcPoint method of the CEmission class                      |
//+------------------------------------------------------------------+
PointEmission CEmission::CalcPoint(double   y1, // Y-coordinate of straight line 1 on bar [1]
                                   double   y0, // Y-coordinate of straight line 1 on bar [0]
                                   double   yy1,// Y-coordinate of straight line 2 on bar [1]
                                   double   yy0,// Y-coordinate of straight line 2 on bar [0]
                                   datetime t0  // t-coordinate of the current bar Time[0]
                                   )
  {
   PointEmission point={NULL,NULL,NULL,false};
   double y0y1=y0-y1;
   double y1yy1=y1-yy1;
   double yy0yy1=yy0-yy1;
   double del0=yy0yy1-y0y1;
   if(MathAbs(del0)>0)
     {
      point.x=y1yy1/del0;
      if(point.x<lim_Left || point.x>lim_Right) return(point);
      point.y=y1+y0y1*y1yy1/del0;
      if(point.y<0) return(point);
      point.t=t0+(int)(point.x*sec);
      point.real=true;
      return(point);
     }
   return(point);
  }
//+------------------------------------------------------------------+
//| The CreatePoint method of the CEmission class                    |
//+------------------------------------------------------------------+
bool CEmission::CreatePoint(string name,            // point name
                            PointEmission &point,  // coordinates of the point
                            CodeColor &style)      // point drawing style
  {
   if(ObjectCreate(0,name,OBJ_TEXT,0,0,0))
     {
      ObjectSetString(0,name,OBJPROP_FONT,"Wingdings");
      ObjectSetInteger(0,name,OBJPROP_ANCHOR,ANCHOR_CENTER);
      ObjectSetInteger(0,name,OBJPROP_FONTSIZE,style.Width);
      ObjectSetString(0,name,OBJPROP_TEXT,CharToString((uchar)style.Code));
      ObjectSetDouble(0,name,OBJPROP_PRICE,point.y);
      ObjectSetInteger(0,name,OBJPROP_TIME,point.t);
      ObjectSetInteger(0,name,OBJPROP_COLOR,style.Color);
      return(true);
     }
   return(false);
  }
エミッションポイントは Text のような グラフィカルオブジェクトを用いて描写されることに注意が必要です。 まずそれはオブジェクトアンカーをシンボルの中心にそろえる必要があるという事実に由来します。次に、広範囲でオブジェクトサイズを変更することができます。これらポイント特性は複雑なエミッションを取得する大きな可能性を提供します。

図2 iMA インディケータとiEnvelopes インディケータのオリジナルエミッション
エミッションの積分特性
提案の Expert Advisor をチャート上に配置したら、異なる色の点を数多く表示されます(図2参照)。
- 水色-iMA と iEnvelopesの 交点、UPPER_LINE バッファ
- ブルー -iMA と iEnvelopesの交点、LOWER_LINE バッファ
- 紫 -iMA と iMAの交点
この混乱は自動売買では利用できません。シグナル、レベル、その他量的マーケット特性が必要なのですが、ここでは瞑想や占いのためのビジュアルイメージが現れるだけで、数字のかけらもありません。
エミッションの積分特性はインディケータエミッションの結果として取得されるデータを一般化する役割を果たします。
積分チャネル、ライン、レベル、シグナル等新しいタイプのインディケータを用いることでマーケットリサーチにチャンスを与えるという点でエミッションの積分特性は必要です。もっとも典型的なエミッション値を決めるには、小さな値から始め、下にあるようにのちにそれによって水平線を引くために各ポイントタイプに対する平均価格を計算します。

図3 各ポイントタイプの平均価格の水平ライン
このため、既存コードに数個の追加コードブロックを書き加えます。データセクションに:
//--- arrays for calculation and display of integral characteristics of emissions
#define     NUMBER_TYPES_POINT   3
double      sum[NUMBER_TYPES_POINT],sumprev[NUMBER_TYPES_POINT];
datetime    sum_time[NUMBER_TYPES_POINT];
int         n[NUMBER_TYPES_POINT],W[NUMBER_TYPES_POINT];
color       colorLine[]={clrAqua,clrBlue,clrMagenta};
OnTick() モジュールに:
//--- calculation of integral characteristics of emissions
   ArrayInitialize(n,0);
   ArrayInitialize(sum,0.0);
   ArrayInitialize(sum_time,0.0);
   for(int obj=total-1;obj>=0;obj--)
     {
      string   obj_name=ObjectName(0,obj,0,OBJ_TEXT);
      datetime obj_time=(datetime)ObjectGetInteger(0,obj_name,OBJPROP_TIME);
      if(obj_time>T[0])
        {
         color    obj_color=(color)ObjectGetInteger(0,obj_name,OBJPROP_COLOR);
         double   obj_price=ObjectGetDouble(0,obj_name,OBJPROP_PRICE);
         for(int i=ArraySize(n)-1; i>=0; i--)
            if(obj_color==colorPoint[i])
              {
               n[i]++;
               sum[i]+=obj_price;
               sum_time[i]+=obj_time;
              }
        }
     }
//--- displaying integral characteristics of emissions
   for(int i=ArraySize(n)-1; i>=0; i--)
     {
      if(n[i]>0)
        {
         name="H.line."+(string)i;
         ObjectCreate(0,name,OBJ_HLINE,0,0,0,0);
         ObjectSetInteger(0,name,OBJPROP_COLOR,colorLine[i]);
         ObjectSetInteger(0,name,OBJPROP_STYLE,STYLE_DASHDOT);
         ObjectSetInteger(0,name,OBJPROP_WIDTH,1);
         ObjectSetDouble(0,name,OBJPROP_PRICE,sum[i]/n[i]);
        }
     }
先に進みます。各点集合についての平均時間値を計算し、平均価格の対応するライン上でマークします(図4)。これで、静的ではなく、スペース内で常に移動するエミッションの第一の定量的特性を得たことになります。
チャートは瞬間的なポジションを表示しているにすぎません。それをどうにかして履歴内に固定しておき、のちに調べられるようにします。今までのところ、これがどのように行われるかまだ明確ではないので、注意して考察する必要があります。その一方でさらなる改善をほどこし、計算に使われるポイント数をチャート上のマーカーの隣に表示します。これらはある種いっそうの分析に利用可能となる取得済み特性のウェイトでもあります。

図4 平均価格と平均時間の交点のマーカー
ただ、分析の便宜のためその百分率を使用します。主なエミッションの点はインディケータ iMA および iEnvelopes の交点の結果得られるものなので、その合計を 100%と考えます。それで取得したものを確認します。

図5 エミッションの点各タイプについての百分率
値を3個合計するとすれば、そのトータルは 100% を越えてしまいます。紫で表示されている値34.4 はある時点における iMA と iMA の交点のプロパティです。すなわち、インディケータはそれ自体が交わりますが異なるインプットデータを持つということです。この場合、これは参照値でそれをマーケット分析でどのように活用することができるかについては後に考えることになるでしょう。
ただし、ポイント数を百分率で得ることで別の問題が発生します。エミッション特性のパーセント値を履歴内でどのようにして修正することができるのでしょうか、特に値の変化につれて?
グラフ分析
エミッションの積分特性を取得しましたが、分析を行い、取得したデータを基にトレーディング戦略を作成するにはまだ長い道のりです。が、注意深い読者はすでにこの問題に対する解決法に気づいていることでしょう(図1参照)。解決法は次のようなものです。:私は、主なエミッションの点の百分率に比例する異なる密度を利用した積分曲線を描くことを提案します。
今ある曲線の一部は現在バーと前回バーの平均価格ラインに従ってプロットされるものです。がこれら座標は実際、将来から得るものであることを憶えておきます。それはある意味インディケータエミッションの積分チャネルを導いています。実にややこしいですね。。。きっとこのまま読み続けるべきかどうかお考えのことでしょう。進んでいくに従い、もっともっとおもしろくなってくることを願っています。
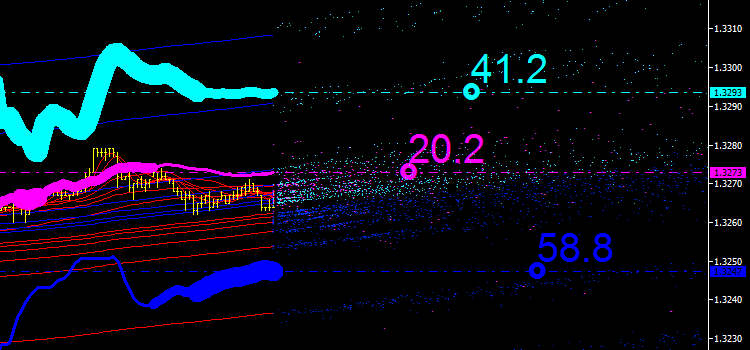
図6 インディケータエミッションの積分チャネル
われわれは "iMA & iMA" エミッションの利用法を見つけたわけです(チャート上紫の表示)。そして新しいインディケータを手に入れました。集積された移動平均です。
Expert Advisor のコードに戻り、OnTick() モジュールに生じた変化を見ます。
//--- displaying integral characteristics of emissions
   ArrayInitialize(W,10);
   W[ArrayMaximum(n)]=20;
   W[ArrayMinimum(n)]=3;
   for(int i=ArraySize(n)-1; i>=0; i--)
     {
      if(n[i]>0)
        {
         //--- horizontal lines of mean prices
         name="H.line."+(string)i;
         ObjectCreate(0,name,OBJ_HLINE,0,0,0,0);
         ObjectSetInteger(0,name,OBJPROP_COLOR,colorLine[i]);
         ObjectSetInteger(0,name,OBJPROP_STYLE,STYLE_DASHDOT);
         ObjectSetInteger(0,name,OBJPROP_WIDTH,1);
         ObjectSetDouble(0,name,OBJPROP_PRICE,sum[i]/n[i]);
         //--- markers
         name="P."+(string)i;
         ObjectCreate(0,name,OBJ_TEXT,0,0,0);
         ObjectSetString(0,name,OBJPROP_FONT,"Wingdings");
         ObjectSetInteger(0,name,OBJPROP_ANCHOR,ANCHOR_CENTER);
         ObjectSetInteger(0,name,OBJPROP_FONTSIZE,17);
         ObjectSetString(0,name,OBJPROP_TEXT,CharToString(163));
         ObjectSetInteger(0,name,OBJPROP_COLOR,colorLine[i]);
         ObjectSetDouble(0,name,OBJPROP_PRICE,sum[i]/n[i]);
         ObjectSetInteger(0,name,OBJPROP_TIME,sum_time[i]/n[i]);
         //--- integral curves
         name="T"+(string)i+".line"+(string)T[1];
         ObjectCreate(0,name,OBJ_TREND,0,0,0);
         ObjectSetInteger(0,name,OBJPROP_COLOR,colorLine[i]);
         ObjectSetInteger(0,name,OBJPROP_WIDTH,W[i]);
         if(sumprev[i]>0)
           {
            ObjectSetDouble(0,name,OBJPROP_PRICE,0,sumprev[i]);
            ObjectSetInteger(0,name,OBJPROP_TIME,0,T[1]);
            ObjectSetDouble(0,name,OBJPROP_PRICE,1,(sum[i]/n[i]));
            ObjectSetInteger(0,name,OBJPROP_TIME,1,T[0]);
           }
         //--- numerical values of integral characteristics
         name="Text"+(string)i+".control";
         ObjectCreate(0,name,OBJ_TEXT,0,0,0);
         ObjectSetInteger(0,name,OBJPROP_ANCHOR,ANCHOR_LEFT_LOWER);
         ObjectSetInteger(0,name,OBJPROP_FONTSIZE,30);
         ObjectSetInteger(0,name,OBJPROP_COLOR,colorLine[i]);
         string str=DoubleToString((double)n[i]/(double)(n[0]+n[1])*100,1);
         ObjectSetString(0,name,OBJPROP_TEXT,str);
         ObjectSetDouble(0,name,OBJPROP_PRICE,0,(sum[i]/n[i]));
         ObjectSetInteger(0,name,OBJPROP_TIME,0,sum_time[i]/n[i]);
        }
     }
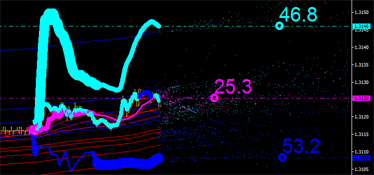
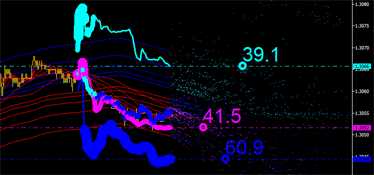
グラフィカル分析を続けます。が、何かが欠けているような。。。。もう一つ重要なエミッション特性が欠けていたようです。積分曲線は平均価格のみを基にプロットされました。平均時間座標も考慮する必要があるのです。下図を見て、チャネル限界に特に注意を向けます。
- 水色の線はチャネルの上限です。
- ブルーの線はチャネルの下限です。
時間でゼロバーにより近いマーカーを特定する必要があります。
 |
 |
|---|
図7 時間内に導く積分特性左: チャネルの上限を導く右: チャネルの下限を導く
この課題は次のように解決することができます。:価格チャートに価格ライン(PRICE_MEDIAN)を追加し、最終バーにより近いマーカーの色(水色またはブルー)によってラインに色を変えさせます(図7)。そのあと、既存のコードに以下のコードブロックを挿入します。
//---
   if(n[ArrayMinimum(n)]>0)
     {
      datetime d[2];
      for(int j=0;j<2;j++)
        {
         d[j]=sum_time[j]/n[j];
        }
      int i=ArrayMinimum(d);

      name="Price.line"+(string)T[1];
      ObjectCreate(0,name,OBJ_TREND,0,0,0);
      ObjectSetInteger(0,name,OBJPROP_WIDTH,8);
      ObjectSetDouble(0,name,OBJPROP_PRICE,0,HL(H[1],L[1]));
      ObjectSetInteger(0,name,OBJPROP_TIME,0,T[1]);
      ObjectSetDouble(0,name,OBJPROP_PRICE,1,HL(H[0],L[0]));
      ObjectSetInteger(0,name,OBJPROP_TIME,1,T[0]);
      ObjectSetInteger(0,name,OBJPROP_COLOR,colorLine1[i]);
     }
//---
これで次のステップへの準備が整いました。元のエミッションの積分特性を基に、二番手エミッションのようなエミッションをプロットすればどうなるのでしょうか?やがて、これらラインもお互いに交わり、結果、エミッションの点を取得することとなります。そこからどのような結果が生じるのか見ます。以下のコード行を追加することで前コードブロックを強化します。
      //--- emissions of integral characteristics of the original emissions
      pEmission=EnvMa.CalcPoint(sumprev[0],sum[0]/n[0],sumprev[2],sum[2]/n[2],T[0]);
      if(pEmission.real) // if the intersection point is found, draw it in the chart
        {
         name="test/up"+(string)GTC;
         EnvMa.CreatePoint(name,pEmission,styleUpper2);
        }
      pEmission=EnvMa.CalcPoint(sumprev[1],sum[1]/n[1],sumprev[2],sum[2]/n[2],T[0]);
      if(pEmission.real) // if the intersection point is found, draw it in the chart
        {
         name="test/dn"+(string)GTC;
         EnvMa.CreatePoint(name,pEmission,styleLower2);
        }
そしてデータセクションに次の行を挿入します。
#define     COLOR_2_UPPER  C'102,255,255'
#define     COLOR_2_LOWER  C'51,102,255'
CodeColor   styleUpper2={178,COLOR_2_UPPER,BIG};
CodeColor   styleLower2={178,COLOR_2_LOWER,BIG};
下の図で結果を確認することができます。今のところ何も示さない新しい点を認めることができます。
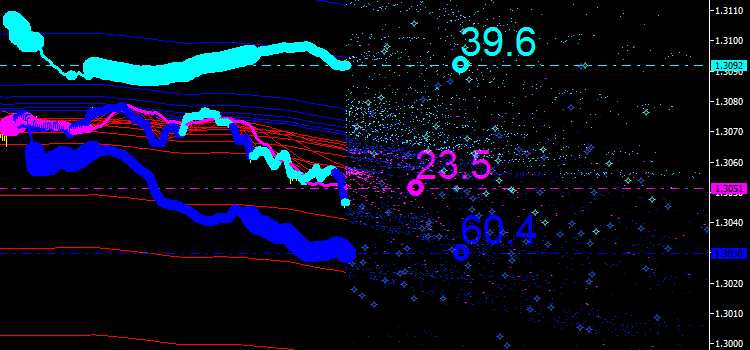
図8 積分行のエミッション
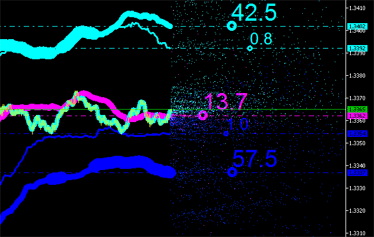
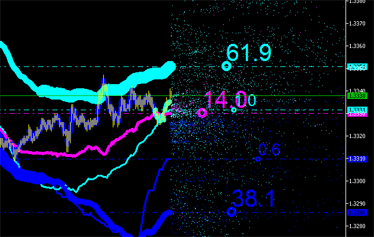
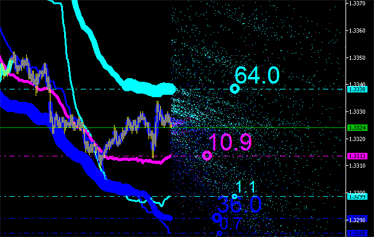
積分特性は明らかに、チャートにプロットされたエミッションを伴う新しい点(図9参照)に対して計算することができます。そして計算ができなくなるまで続けます。
 |
 |
 |
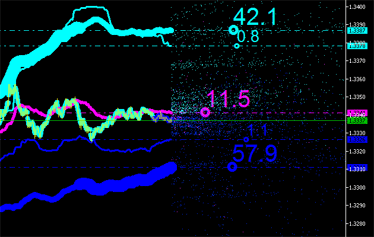 |
図9 エミッションの積分特性
必要なものはすべてプロットし、エミッションの積分特性を取得しました。 これでその分析を進め、トレーディング戦略を開発することができます。ですが、それはまだできそうにありません!ここでの障害は?
エミッションの時系列
グラフィック分析によりエミッションの積分特性を調べることができますが、それは資源集約的すぎます。ストラレジーテスタのビジュアルモードで提案のコードを実行しようとしたら、検証スピードはすぐゼロに落ちます。これはチャート内の大きなグラフィックオブジェクトのせいです。
よって当然不要な点は排除し積分曲線だけ残したいと思うでしょう。この問題を解決するには特殊な配列(バッファ)を使用します。
エミッションの時系列は特別に整列されたエミッションに関する情報が集積される配列です。
それらは時間が主要なフィールドであっても、含まれるデータが時間で連続していない標準的時系列とは異なります。

図10 エミッション特性の時系列
これら配列は新しいエレメントが空のセルや古い値が書かれたセルに格納されるという方法で整列されます。このために行うこは、CTimeEmission クラスの使用です。以下がそのクラスのコードへの実装方法です。
//+------------------------------------------------------------------+
//|                                                 TimeEmission.mqh |
//|                                           Copyright 2013, DC2008 |
//|                           https://www.mql5.com/ru/users/DC2008 |
//+------------------------------------------------------------------+
#property copyright "Copyright 2013, DC2008"
#property link      "https://www.mql5.com/ru/users/DC2008"
#property version   "1.00"
//---
#include <Emission.mqh>
#define ARRMAX       64
#define ARRDELTA     8
//+------------------------------------------------------------------+
//| pIntegral structure                                              |
//+------------------------------------------------------------------+
struct pIntegral
  {
   double            y;       // Y-coordinate of the price point (mean price of the points with the same time)
   datetime          t;       // t-coordinate of the point's time
   int               n;       // n-number of points with the same time
  };
//+------------------------------------------------------------------+
//| Base class for time series of emissions                          |
//+------------------------------------------------------------------+
class CTimeEmission
  {
private:
   pIntegral         time_series_Emission[]; // time series of emission
   int               size_ts; // number of elements in time series
   datetime           t[1];
public:
   //--- method of writing new elements to time series of emission
   void              Write(PointEmission &point);
   //--- method of reading integral characteristics of emissions
   pIntegral         Read();
                     CTimeEmission();
                    ~CTimeEmission();
  };

//+------------------------------------------------------------------+
//|                                                                  |
//+------------------------------------------------------------------+
CTimeEmission::CTimeEmission()
  {
   ArrayResize(time_series_Emission,ARRMAX,ARRMAX);
   size_ts=ArraySize(time_series_Emission);
   for(int i=size_ts-1; i>=0; i--)
      time_series_Emission[i].t=0;
  }
//+------------------------------------------------------------------+
//|                                                                  |
//+------------------------------------------------------------------+
CTimeEmission::~CTimeEmission()
  {
  }
//+------------------------------------------------------------------+
//| The Write method of the CTimeEmission class                      |
//+------------------------------------------------------------------+
void CTimeEmission::Write(PointEmission &point)
  {
   CopyTime(NULL,0,0,1,t);
   size_ts=ArraySize(time_series_Emission);
   for(int k=0;k<size_ts;k++)
     {
      if(time_series_Emission[k].t<t[0]) // find the first empty cell
        {
         if(k>size_ts-ARRDELTA)
           {   // increase the array size, if necessary
            int narr=ArrayResize(time_series_Emission,size_ts+ARRMAX,ARRMAX);
            for(int l=size_ts-1;l<narr;l++)
               time_series_Emission[l].t=0;
           }
         time_series_Emission[k].y=point.y;
         time_series_Emission[k].t=point.t;
         time_series_Emission[k].n=1;
         return;
        }
      if(time_series_Emission[k].t==point.t) // find the first similar cell
        {
         time_series_Emission[k].y=(time_series_Emission[k].y*time_series_Emission[k].n+point.y)/(time_series_Emission[k].n+1);
         time_series_Emission[k].n++;
         return;
        }
     }
  }
//+------------------------------------------------------------------+
//| The Read method of the CTimeEmission class                       |
//+------------------------------------------------------------------+
pIntegral CTimeEmission::Read()
  {
   CopyTime(NULL,0,0,1,t);
   pIntegral property_Emission={0.0,0,0};
   size_ts=ArraySize(time_series_Emission);
   for(int k=0;k<size_ts;k++)
     {
      if(time_series_Emission[k].t>=t[0])
        {
         property_Emission.y+=time_series_Emission[k].y*time_series_Emission[k].n;
         property_Emission.t+=(time_series_Emission[k].t-t[0])*time_series_Emission[k].n;
         property_Emission.n+=time_series_Emission[k].n;
        }
     }
   if(property_Emission.n>0)
     {
      property_Emission.y=property_Emission.y/property_Emission.n;
      property_Emission.t=property_Emission.t/property_Emission.n+t[0];
     }
   return(property_Emission);
  }
ここで2つのクラスメソッドの実装を確認することができます。:時系列にエミッションの点を書くものと、エミッションの積分特性値を読みだすものです。
積分特性の簡潔な計算
エミッションの時系列を取得したところで、トレーディング戦略をさらに開発するための積分特性計算のための簡潔なアルゴリズムを作成し始めることができます。元の Expert Advisorをアップデートします。
//+------------------------------------------------------------------+
//|                                   emission_of_MA_envelope_ts.mq5 |
//|                                           Copyright 2013, DC2008 |
//|                           https://www.mql5.com/ru/users/DC2008 |
//+------------------------------------------------------------------+
#property copyright "Copyright 2013, DC2008"
#property link      "https://www.mql5.com/ru/users/DC2008"
#property version   "1.00"
//---
#include <GetIndicatorBuffers.mqh>
#include <Emission.mqh>
#include <TimeEmission.mqh>
//--- number of point types
#define     NUMBER_TYPES_POINT   3
//--- array for storing the iMA indicator periods
int      MA[]={4,7,11,19,31,51,85};
//--- external variable for storing averaging period of the iEnvelopes indicator
input int ma_period=140; // averaging period of the iEnvelopes indicator
//--- array for storing deviations of the iEnvelopes indicator
double   ENV[]={0.01,0.0165,0.0273,0.0452,0.0747,01234,0.204,0.3373,0.5576,0.9217,1.5237};
//--- array for storing pointers to the iMA indicator
int      handle_MA[];
//--- array for storing pointers to the iEnvelopes indicator
int      handle_Envelopes[];
//--- market data
datetime    T[],prevTimeBar=0;
double      H[],L[];
#define     HL(a, b) (a+b)/2
//--- class instances
CEmission      EnvMa(0,200);
PointEmission  pEmission;
CTimeEmission  tsMA[NUMBER_TYPES_POINT];
pIntegral      integral[NUMBER_TYPES_POINT];
//--- drawing styles for points of emission
#define     DEL            500
//--- arrays for calculation and display of integral characteristics of emissions
double      sumprev[NUMBER_TYPES_POINT];
int         n[NUMBER_TYPES_POINT],W[NUMBER_TYPES_POINT];
color       colorLine[]={clrAqua,clrBlue,clrMagenta};
int         fontPoint[]={30,30,30};
int         fontMarker[]={16,16,16};
//+------------------------------------------------------------------+
//| Expert initialization function                                   |
//+------------------------------------------------------------------+
int OnInit()
  {
   ArraySetAsSeries(T,true);
   ArraySetAsSeries(H,true);
   ArraySetAsSeries(L,true);
   ArrayInitialize(sumprev,0.0);
//---
   int size=ArraySize(MA);
   ArrayResize(handle_MA,size);
//--- create a pointer to the object - the iMA indicator
   for(int i=0; i<size; i++)
     {
      handle_MA[i]=iMA(NULL,0,MA[i],0,MODE_SMA,PRICE_MEDIAN);
      //--- if an error occurs when creating the object, print the message
      if(handle_MA[i]<0)
        {
         Print("The iMA object[",MA[i],"] has not been created: Error = ",GetLastError());
         //--- forced program termination
         return(-1);
        }
     }
//+------------------------------------------------------------------+
   size=ArraySize(ENV);
   ArrayResize(handle_Envelopes,size);
//--- create a pointer to the object - the iEnvelopes indicator
   for(int i=0; i<size; i++)
     {
      handle_Envelopes[i]=iEnvelopes(NULL,0,ma_period,0,MODE_SMA,PRICE_MEDIAN,ENV[i]);
      //--- if an error occurs when creating the object, print the message
      if(handle_Envelopes[i]<0)
        {
         Print("The iEnvelopes object[",ENV[i],"] has not been created: Error = ",GetLastError());
         //--- forced program termination
         return(-1);
        }
     }
//---
   return(0);
  }
//+------------------------------------------------------------------+
//| Expert deinitialization function                                 |
//+------------------------------------------------------------------+
void OnDeinit(const int reason)
  {
//---

  }
//+------------------------------------------------------------------+
//| Expert tick function                                             |
//+------------------------------------------------------------------+
void OnTick()
  {
//--- market data
   CopyTime(NULL,0,0,2,T);
   CopyHigh(NULL,0,0,2,H);
   CopyLow(NULL,0,0,2,L);
//--- fill the declared arrays with current values from all indicator buffers
   string name;
   uint GTC=GetTickCount();
//---- indicator buffers
   double   ibMA[],ibMA1[];      // arrays for the iMA indicator
   double   ibEnvelopesUpper[];  // array for the iEnvelopes indicator (UPPER_LINE)
   double   ibEnvelopesLower[];  // array for the iEnvelopes indicator (LOWER_LINE)
   for(int i=ArraySize(handle_MA)-1; i>=0; i--)
     {
      if(!CopyBufferAsSeries(handle_MA[i],0,0,2,true,ibMA))
         return;
      //---
      for(int j=ArraySize(handle_Envelopes)-1; j>=0; j--)
        {
         if(!GetEnvelopesBuffers(handle_Envelopes[j],0,2,ibEnvelopesUpper,ibEnvelopesLower,true))
            return;
         //--- find the intersection point of the iEnvelopes(UPPER_LINE) and iMA indicators
         pEmission=EnvMa.CalcPoint(ibEnvelopesUpper[1],ibEnvelopesUpper[0],ibMA[1],ibMA[0],T[0]);
         if(pEmission.real) // if the intersection point is found, add it to the time series of emission
            tsMA[0].Write(pEmission);
         //--- find the intersection point of the iEnvelopes(LOWER_LINE) and iMA indicators
         pEmission=EnvMa.CalcPoint(ibEnvelopesLower[1],ibEnvelopesLower[0],ibMA[1],ibMA[0],T[0]);
         if(pEmission.real) // if the intersection point is found, add it to the time series of emission
            tsMA[1].Write(pEmission);
        }
      //---
      for(int j=ArraySize(handle_MA)-1; j>=0; j--)
        {
         if(i!=j)
           {
            if(!CopyBufferAsSeries(handle_MA[j],0,0,2,true,ibMA1))
               return;
            //--- find the intersection point of the iMA and iMA indicators
            pEmission=EnvMa.CalcPoint(ibMA1[1],ibMA1[0],ibMA[1],ibMA[0],T[0]);
            if(pEmission.real) // if the intersection point is found, add it to the time series of emission
               tsMA[2].Write(pEmission);
           }
        }
     }
//--- deletion of the graphical objects of emission not to stuff the chart
   if(T[0]>prevTimeBar)
     {
      prevTimeBar=T[0];
      //---
      for(int i=ArraySize(n)-1; i>=0; i--)
         sumprev[i]=integral[i].y;
      //---
      for(int obj=ObjectsTotal(0,0,-1)-1;obj>=0;obj--)
        {
         string obj_name=ObjectName(0,obj,0,OBJ_TREND);
         datetime obj_time=(datetime)ObjectGetInteger(0,obj_name,OBJPROP_TIME);
         if(obj_time<T[0]-DEL*PeriodSeconds())
            ObjectDelete(0,obj_name);
        }
      Comment("Emission © DC2008   Graphical objects = ",ObjectsTotal(0,0,-1));
     }
//--- calculation of integral characteristics of emission
   for(int i=ArraySize(n)-1; i>=0; i--)
      integral[i]=tsMA[i].Read();
//--- displaying integral characteristics of emission
   ArrayInitialize(W,5);
   if(integral[0].n>integral[1].n)
     {
      W[0]=20;
      W[1]=10;
     }
   else
     {
      W[0]=10;
      W[1]=20;
     }
   for(int i=ArraySize(n)-1; i>=0; i--)
     {
      //--- horizontal lines of mean prices
      name="H.line."+(string)i;
      ObjectCreate(0,name,OBJ_HLINE,0,0,0,0);
      ObjectSetInteger(0,name,OBJPROP_COLOR,colorLine[i]);
      ObjectSetInteger(0,name,OBJPROP_STYLE,STYLE_DASHDOT);
      ObjectSetInteger(0,name,OBJPROP_WIDTH,1);
      ObjectSetDouble(0,name,OBJPROP_PRICE,integral[i].y);
      //--- markers
      name="P."+(string)i;
      ObjectCreate(0,name,OBJ_TEXT,0,0,0);
      ObjectSetString(0,name,OBJPROP_FONT,"Wingdings");
      ObjectSetInteger(0,name,OBJPROP_ANCHOR,ANCHOR_CENTER);
      ObjectSetInteger(0,name,OBJPROP_FONTSIZE,fontMarker[i]);
      ObjectSetString(0,name,OBJPROP_TEXT,CharToString(163));
      ObjectSetInteger(0,name,OBJPROP_COLOR,colorLine[i]);
      ObjectSetDouble(0,name,OBJPROP_PRICE,integral[i].y);
      ObjectSetInteger(0,name,OBJPROP_TIME,integral[i].t);
      //--- integral curves
      name="T"+(string)i+".line"+(string)T[1];
      ObjectCreate(0,name,OBJ_TREND,0,0,0);
      ObjectSetInteger(0,name,OBJPROP_COLOR,colorLine[i]);
      ObjectSetInteger(0,name,OBJPROP_WIDTH,W[i]);
      if(sumprev[i]>0)
        {
         ObjectSetDouble(0,name,OBJPROP_PRICE,0,sumprev[i]);
         ObjectSetInteger(0,name,OBJPROP_TIME,0,T[1]);
         ObjectSetDouble(0,name,OBJPROP_PRICE,1,integral[i].y);
         ObjectSetInteger(0,name,OBJPROP_TIME,1,T[0]);
        }
      //--- numerical values of integral characteristics
      if(integral[0].n+integral[1].n>0)
        {
         name="Text"+(string)i+".control";
         ObjectCreate(0,name,OBJ_TEXT,0,0,0);
         ObjectSetInteger(0,name,OBJPROP_ANCHOR,ANCHOR_LEFT_LOWER);
         ObjectSetInteger(0,name,OBJPROP_FONTSIZE,fontPoint[i]);
         ObjectSetInteger(0,name,OBJPROP_COLOR,colorLine[i]);
         string str=DoubleToString((double)integral[i].n/(double)(integral[0].n+integral[1].n)*100,1);
         ObjectSetString(0,name,OBJPROP_TEXT,str);
         ObjectSetDouble(0,name,OBJPROP_PRICE,0,integral[i].y);
         ObjectSetInteger(0,name,OBJPROP_TIME,0,integral[i].t);
        }
     }
  }
計算速度が上がった一方でコードは短くなりました。 これで可視化せずに売買ロボットの検証と最適化が可能です!
トレー二ングでの積分特性利用
積分特性は以下のためのシグナルジェネレータとして利用可能です。
- チャネルブレークスルー
- お互い、または価格との交点
- 方向変更
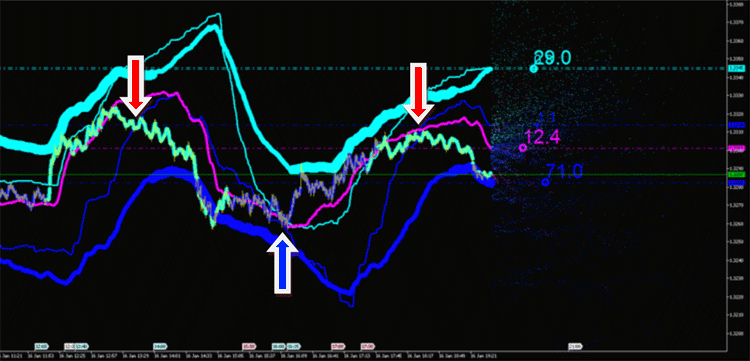
Fig. 11. エミッションの積分特性の交点におけるトレードシグナル
おわりに
- インディケータエミッションの積分特性の計算はマーケット分析(時系列)の新しいツールと手法をもたらしてくれます。
- 時系列を利用して、積分特性の計算スピードをなんとか上げることができました。
- そしてそれはエミッションを利用した自動売買戦略の開発への可能性の扉を開いてくれたのです。
MetaQuotes Ltdによってロシア語から翻訳されました。
元の記事: https://www.mql5.com/ru/articles/610
 MetaTrader 4 および MetaTrader 5 用トレードシグナルについての一般情報
- 無料取引アプリ
- 8千を超えるシグナルをコピー
- 金融ニュースで金融マーケットを探索