
ディープラーニングを用いたCNA(因果ネットワーク分析)、SMOC(確率モデル最適制御)、ナッシュゲーム理論の例
はじめに
3つの高度な取引エキスパートアドバイザー(EA)にディープラーニングを追加するプロセスについて説明します。この3つのEAは、記事として公開されている高度なEAです。
以下の3稿はwww.mql5.comに掲載されています。
記事をまだお読みでない方のために簡単に内容を説明しますが、ぜひ読んでみることをお勧めします。
ナッシュゲーム理論
ナッシュ均衡は、ゲーム理論における基本的な概念の1つです。
ナッシュ均衡とは、ゲーム理論における概念で、各プレーヤーが他のプレーヤーの均衡戦略を知っていると仮定される状況です。このとき、どのプレーヤーも自分の戦略のみを変更しても利益を得ることはできません。
ナッシュ均衡では、各プレーヤーの戦略が、他のすべてのプレーヤーの戦略が与えられたときに最適となります。ゲームにおいて複数のナッシュ均衡が存在することもあれば、全く存在しない場合もあります。
因果関係ネットワーク分析
因果ネットワーク分析(CNA)は、システム内の変数間の複雑な因果関係を理解し、モデル化するために用いられる手法です。金融市場に適用すれば、さまざまな市場イベントや要因が互いにどのように影響し合っているかを特定するのに役立ち、より正確な予測につながる可能性があります。
ボットはFast Causal Inferenceを使用します。
Fast Causal Inferenceは、統計的推論と因果分析を迅速に行うアプローチです。スピードと因果関係の理解を両立させ、データから素早く因果関係を導き出します。この方法は、迅速なデータ駆動型の意思決定が求められるシナリオにおいて有効です。たとえば、リアルタイムの市場分析や迅速なビジネス意思決定、緊急の疫学調査などに適しています。この手法は、スピードを重視しつつ因果関係の理解が重要な時間に敏感な環境で活躍します。
確率的最適化
確率モデリングと制御最適化は、不確実性を伴う状況で問題解決を支援する数学的手法です。これらは、金融、エンジニアリング、人工知能などのさまざまな分野で応用されています。
確率モデリングは、株式市場の価格変動やレストランの行列など、ランダム性を含むシステムを説明するために使用されます。ランダム変数、確率分布、および確率過程に基づき、モンテカルロ法やマルコフ連鎖を使って、こうしたプロセスをモデル化し、その動作を予測できます。
また、管理最適化は、システム管理における最適な解決策を導き出すのに役立ちます。自動車運転や化学プラントの運営など、さまざまなプロセスを自動化し改善するために使用されます。基本的な手法には、線形二次コントローラ、モデル予測制御、および強化学習などがあります。
深層学習
取引におけるディープラーニングは、人工ニューラルネットワークを活用して金融市場の動向を分析し、予測します。以下はその概要です。
- データ分析:ディープラーニングモデルは、価格履歴や取引量、経済指標、さらにはニュースの感情など、膨大な量の金融データを処理します。
- パターン認識:これらのモデルは、人間のトレーダーや従来の分析方法では見落とされがちな市場データ内の複雑なパターンや関係を識別できます。
- 予想:特定されたパターンに基づき、ディープラーニングモデルは将来の市場動向や価格の傾向、または最適な取引戦略を予測します。
- 自動取引:一部のシステムでは、ディープラーニングを使用して自律的に取引決定を行い、予測に基づいて取引を実行します。
- リスクマネジメント:ディープラーニングを活用することで、複数のリスク要因を同時に分析し、取引リスクをより効果的に評価・管理できます。
- 適応性:これらのモデルは、継続的に学習し、変化する市場状況に適応できるため、時間とともにパフォーマンスが向上する可能性があります。
- 高頻度取引:ディープラーニングは、瞬時の意思決定が求められる高頻度取引のシナリオで特に効果を発揮します。
取引におけるディープラーニングは非常に強力な機能を提供しますが、市場は依然として複雑で予測不可能であるため、モデルの結果が必ずしも正確であるとは限りません。したがって、慎重な監視とリスク管理が引き続き重要です。
ディープラーニングを使ったEAが必要な理由
このプロジェクトでは、Pythonを使用してディープラーニングモデルを作成し、ONNXモデルとしてエクスポートします。次に、そのモデルを各EAに統合し、ディープラーニングを使用した場合と使用しない場合のパフォーマンスを比較することを目的としています。
ONNXモデルは、Pythonで簡単に作成でき、さまざまなプラットフォームやエコシステム間での互換性を確保できるため、モデル開発とデプロイメントの柔軟性と効率性を提供します。Pythonは、ONNXモデルの迅速な作成やバックテストの実行に非常に適しており、ここではPython 3.11.9を使用します。
以前の記事の結果には改善の余地があり、このEAではディープラーニングを活用しています。ディープラーニングモデルを使用する際には、EAに取引を実行するかどうかを判断するための条件が追加されます。
Pythonスクリプト
以下の.pyスクリプトを使用します。このスクリプトは、ONNXでディープラーニングモデルを作成し、モデルが正しく作成されているかどうかを確認するためのメトリクスも持っています。
#python 3.11.9, tensorflow==2.12.0, keras==2.12.0,  tf2onnx==1.16.0
# python libraries
import MetaTrader5 as mt5
import tensorflow as tf
import numpy as np
import pandas as pd
import tf2onnx
#import tensorflow as tf
#import tf2onnx
import keras

print(f"TensorFlow version: {tf.__version__}")
print(f"Keras version: {keras.__version__}")
print(f"tf2onnx version: {tf2onnx.__version__}")


# input parameters

inp_history_size = 120

sample_size = inp_history_size*3*20
symbol = "EURUSD"
optional = "D1_2024"
inp_model_name = str(symbol)+"_"+str(optional)+".onnx"

if not mt5.initialize():
    print("initialize() failed, error code =",mt5.last_error())
    quit()

# we will save generated onnx-file near the our script to use as resource
from sys import argv
data_path=argv[0]
last_index=data_path.rfind("\\")+1
data_path=data_path[0:last_index]
print("data path to save onnx model",data_path)

# and save to MQL5\Files folder to use as file
terminal_info=mt5.terminal_info()
file_path=terminal_info.data_path+"\\MQL5\\Files\\"
print("file path to save onnx model",file_path)

# set start and end dates for history data
from datetime import timedelta, datetime
#end_date = datetime.now()
end_date = datetime(2024, 1, 1, 0)
start_date = end_date - timedelta(days=inp_history_size*20)

# print start and end dates
print("data start date =",start_date)
print("data end date =",end_date)

# get rates
eurusd_rates = mt5.copy_rates_from(symbol, mt5.TIMEFRAME_D1, end_date, sample_size)

# create dataframe
df = pd.DataFrame(eurusd_rates)

# get close prices only
data = df.filter(['close']).values

# scale data
from sklearn.preprocessing import MinMaxScaler
scaler=MinMaxScaler(feature_range=(0,1))
scaled_data = scaler.fit_transform(data)

# training size is 80% of the data
training_size = int(len(scaled_data)*0.80)
print("Training_size:",training_size)
train_data_initial = scaled_data[0:training_size,:]
test_data_initial = scaled_data[training_size:,:1]

# split a univariate sequence into samples
def split_sequence(sequence, n_steps):
    X, y = list(), list()
    for i in range(len(sequence)):
       # find the end of this pattern
       end_ix = i + n_steps
       # check if we are beyond the sequence
       if end_ix > len(sequence)-1:
          break
       # gather input and output parts of the pattern
       seq_x, seq_y = sequence[i:end_ix], sequence[end_ix]
       X.append(seq_x)
       y.append(seq_y)
    return np.array(X), np.array(y)

# split into samples
time_step = inp_history_size
x_train, y_train = split_sequence(train_data_initial, time_step)
x_test, y_test = split_sequence(test_data_initial, time_step)

# reshape input to be [samples, time steps, features] which is required for LSTM
x_train =x_train.reshape(x_train.shape[0],x_train.shape[1],1)
x_test = x_test.reshape(x_test.shape[0],x_test.shape[1],1)


# define model
from keras.models import Sequential
from keras.layers import Dense, Activation, Conv1D, MaxPooling1D, Dropout, Flatten, LSTM
from keras.metrics import RootMeanSquaredError as rmse
from tensorflow.keras import callbacks
model = Sequential()
model.add(Conv1D(filters=256, kernel_size=2, strides=1, padding='same', activation='relu', input_shape=(inp_history_size,1)))
model.add(MaxPooling1D(pool_size=2))
model.add(LSTM(100, return_sequences = True))
model.add(Dropout(0.3))
model.add(LSTM(100, return_sequences = False))
model.add(Dropout(0.3))
model.add(Dense(units=1, activation = 'sigmoid'))
model.compile(optimizer='adam', loss= 'mse' , metrics = [rmse()])

# Set up early stopping
early_stopping = callbacks.EarlyStopping(
    monitor='val_loss',
    patience=20,
    restore_best_weights=True,
)

# model training for 300 epochs
history = model.fit(x_train, y_train, epochs = 300 , validation_data = (x_test,y_test), batch_size=32, callbacks=[early_stopping], verbose=2)

# evaluate training data
train_loss, train_rmse = model.evaluate(x_train,y_train, batch_size = 32)
print(f"train_loss={train_loss:.3f}")
print(f"train_rmse={train_rmse:.3f}")

# evaluate testing data
test_loss, test_rmse = model.evaluate(x_test,y_test, batch_size = 32)
print(f"test_loss={test_loss:.3f}")
print(f"test_rmse={test_rmse:.3f}")

# Define a function that represents your model
@tf.function(input_signature=[tf.TensorSpec([None, inp_history_size, 1], tf.float32)])
def model_function(x):
    return model(x)

output_path = data_path+inp_model_name
# Convert the model to ONNX
onnx_model, _ = tf2onnx.convert.from_function(
    model_function,
    input_signature=[tf.TensorSpec([None, inp_history_size, 1], tf.float32)],
    opset=13,
    output_path=output_path
)

print(f"Saved ONNX model to {output_path}")


# save model to ONNX
output_path = data_path+inp_model_name
onnx_model = tf2onnx.convert.from_keras(model, output_path=output_path)
print(f"saved model to {output_path}")

output_path = file_path+inp_model_name
onnx_model = tf2onnx.convert.from_keras(model, output_path=output_path)
print(f"saved model to {output_path}")

#prediction using testing data
test_predict = model.predict(x_test)
print(test_predict)
print("longitud total de la prediccion: ", len(test_predict))
print("longitud total del sample: ", sample_size)

plot_y_test = np.array(y_test).reshape(-1, 1)  # Selecciona solo el último elemento de cada muestra de prueba
plot_y_train = y_train.reshape(-1,1)
train_predict = model.predict(x_train)
#print(plot_y_test)

#calculate metrics
from sklearn import metrics
from sklearn.metrics import r2_score
#transform data to real values
value1=scaler.inverse_transform(plot_y_test)
#print(value1)
# Escala las predicciones inversas al transformarlas a la escala original
value2 = scaler.inverse_transform(test_predict.reshape(-1, 1))
#print(value2)
#calc score
score = np.sqrt(metrics.mean_squared_error(value1,value2))

print("RMSE         : {}".format(score))
print("MSE          :", metrics.mean_squared_error(value1,value2))
print("R2 score     :",metrics.r2_score(value1,value2))


#sumarize model
model.summary()

#Print error
value11=pd.DataFrame(value1)
value22=pd.DataFrame(value2)
#print(value11)
#print(value22)


value111=value11.iloc[:,:]
value222=value22.iloc[:,:]

print("longitud salida (tandas de 1 hora): ",len(value111) )
print("en horas son " + str((len(value111))*60*24)+ " minutos")
print("en horas son " + str(((len(value111)))*60*24/60)+ " horas")
print("en horas son " + str(((len(value111)))*60*24/60/24)+ " dias")


# Calculate error
error = value111 - value222

import matplotlib.pyplot as plt
# Plot error
plt.figure(figsize=(7, 6))
plt.scatter(range(len(error)), error, color='blue', label='Error')
plt.axhline(y=0, color='red', linestyle='--', linewidth=1)  # Línea horizontal en y=0
plt.title('Error de Predicción ' + str(symbol))
plt.xlabel('Índice de la muestra')
plt.ylabel('Error')
plt.legend()
plt.grid(True)
plt.savefig(str(symbol)+str(optional)+'.png')

rmse_ = format(score)
mse_ = metrics.mean_squared_error(value1,value2)
r2_ = metrics.r2_score(value1,value2)

resultados= [rmse_,mse_,r2_]

# Abre un archivo en modo escritura
with open(str(symbol)+str(optional)+"results.txt", "w") as archivo:
    # Escribe cada resultado en una línea separada
    for resultado in resultados:
        archivo.write(str(resultado) + "\n")

# finish
mt5.shutdown()

#show iteration-rmse graph for training and validation
plt.figure(figsize = (7,10))
plt.plot(history.history['root_mean_squared_error'],label='Training RMSE',color='b')
plt.plot(history.history['val_root_mean_squared_error'],label='Validation-RMSE',color='g')
plt.xlabel("Iteration")
plt.ylabel("RMSE")
plt.title("RMSE" + str(symbol))
plt.legend()
plt.savefig(str(symbol)+str(optional)+'1.png')

#show iteration-loss graph for training and validation
plt.figure(figsize = (7,10))
plt.plot(history.history['loss'],label='Training Loss',color='b')
plt.plot(history.history['val_loss'],label='Validation-loss',color='g')
plt.xlabel("Iteration")
plt.ylabel("Loss")
plt.title("LOSS" + str(symbol))
plt.legend()
plt.savefig(str(symbol)+str(optional)+'2.png')

#show actual vs predicted (training) graph
plt.figure(figsize=(7,10))
plt.plot(scaler.inverse_transform(plot_y_train),color = 'b', label = 'Original')
plt.plot(scaler.inverse_transform(train_predict),color='red', label = 'Predicted')
plt.title("Prediction Graph Using Training Data" + str(symbol))
plt.xlabel("Hours")
plt.ylabel("Price")
plt.legend()
plt.savefig(str(symbol)+str(optional)+'3.png')

#show actual vs predicted (testing) graph
plt.figure(figsize=(7,10))
plt.plot(scaler.inverse_transform(plot_y_test),color = 'b',  label = 'Original')
plt.plot(scaler.inverse_transform(test_predict),color='g', label = 'Predicted')
plt.title("Prediction Graph Using Testing Data" + str(symbol))
plt.xlabel("Hours")
plt.ylabel("Price")
plt.legend()
plt.savefig(str(symbol)+str(optional)+'4.png')
.pyスクリプトの出力は以下のようになります:
177/177 - 51s - loss: 2.4565e-04 - root_mean_squared_error: 0.0157 - val_loss: 4.8860e-05 - val_root_mean_squared_error: 0.0070 - 51s/epoch - 291ms/step
177/177 [==============================] - 15s 82ms/step - loss: 1.0720e-04 - root_mean_squared_error: 0.0104
train_loss=0.000
train_rmse=0.010
42/42 [==============================] - 3s 74ms/step - loss: 4.4485e-05 - root_mean_squared_error: 0.0067
test_loss=0.000
test_rmse=0.007
Saved ONNX model to c:\XXXXXXXXXXXXXXX\EURUSD_D1_2024.onnx
saved model to c:\XXXXXXXXXXXXXXXX\EURUSD_D1_2024.onnx
saved model to C:\XXXXXXXXXX\MQL5\Files\EURUSD_D1_2024.onnx
42/42 [==============================] - 5s 80ms/step
[[0.40353602]
 [0.39568084]
 [0.39963558]
 ...
 [0.35914657]
 [0.3671721 ]
 [0.3618655 ]]
longitud total de la prediccion:  1320
longitud total del sample:  7200
177/177 [==============================] - 13s 72ms/step
RMSE         : 0.005155711558172936
MSE          : 2.6581361671078003e-05
R2 score     : 0.9915315181564703
Model: "sequential"
_________________________________________________________________
 Layer (type)                Output Shape              Param #
=================================================================
 conv1d (Conv1D)             (None, 120, 256)          768

 max_pooling1d (MaxPooling1D  (None, 60, 256)          0
 )

 lstm (LSTM)                 (None, 60, 100)           142800

 dropout (Dropout)           (None, 60, 100)           0

 lstm_1 (LSTM)               (None, 100)               80400

 dropout_1 (Dropout)         (None, 100)               0

 dense (Dense)               (None, 1)                 101

=================================================================
Total params: 224,069
Trainable params: 224,069
Non-trainable params: 0
________________________________________________________________
このモデルは過剰適合されている可能性があります。この結果から、これは適切な予測の限界であり、過剰適合である可能性があります。
RMSE         : 0.005155711558172936
MSE          : 2.6581361671078003e-05
R2 score     : 0.9915315181564703
主な指標は、R2、RMSE、MSEの3つです。R2は、テストされた結果のうち予測が良好であった割合を示します。RMSEとMSEは誤差を示します。詳しく知りたい場合は、Googleで検索してください。
同じ銘柄(EURUSD)に対してこの作業をおこなうため、ディープラーニングモデルを1つだけ作成し、2024年にテストをおこないます。
コンピューターリソースの消費を抑えるため、テスト期間は1日に設定しました。
また、Pythonスクリプトでは保存されたグラフも表示されます。これにより、モデルが過剰適合や不足適合していないかを確認するための別の手段を提供します。
グラフは次のようになります。
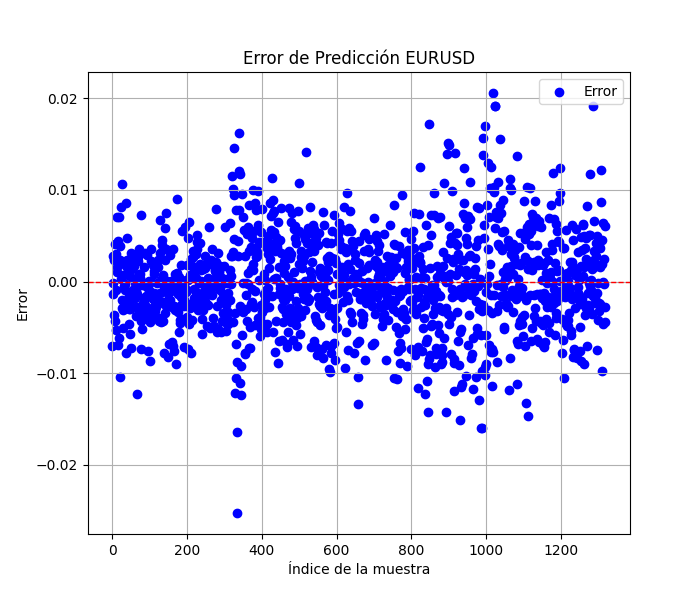
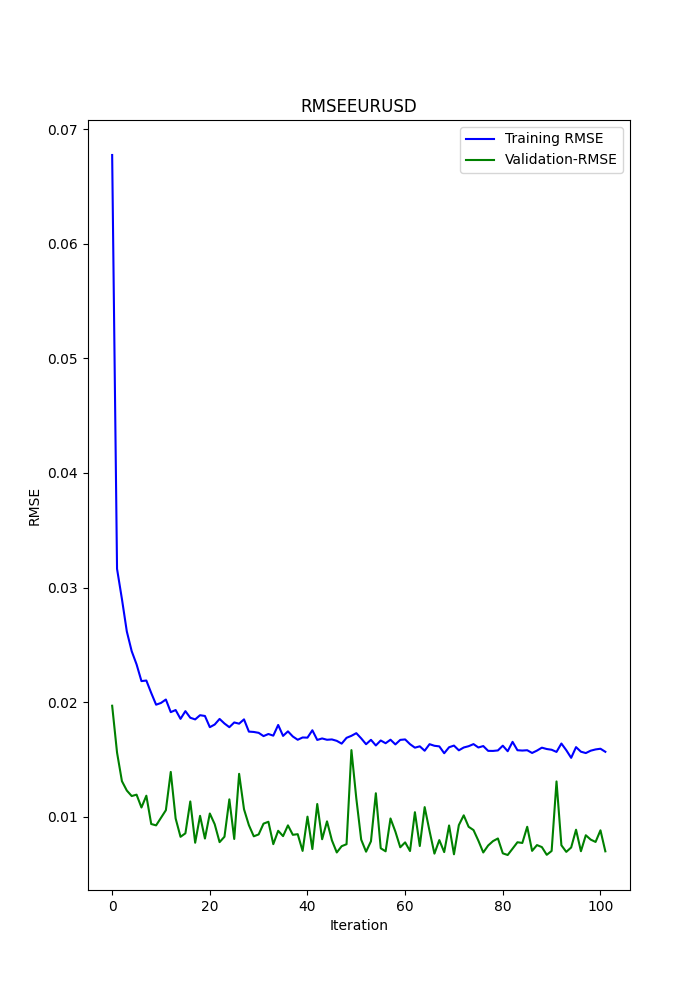
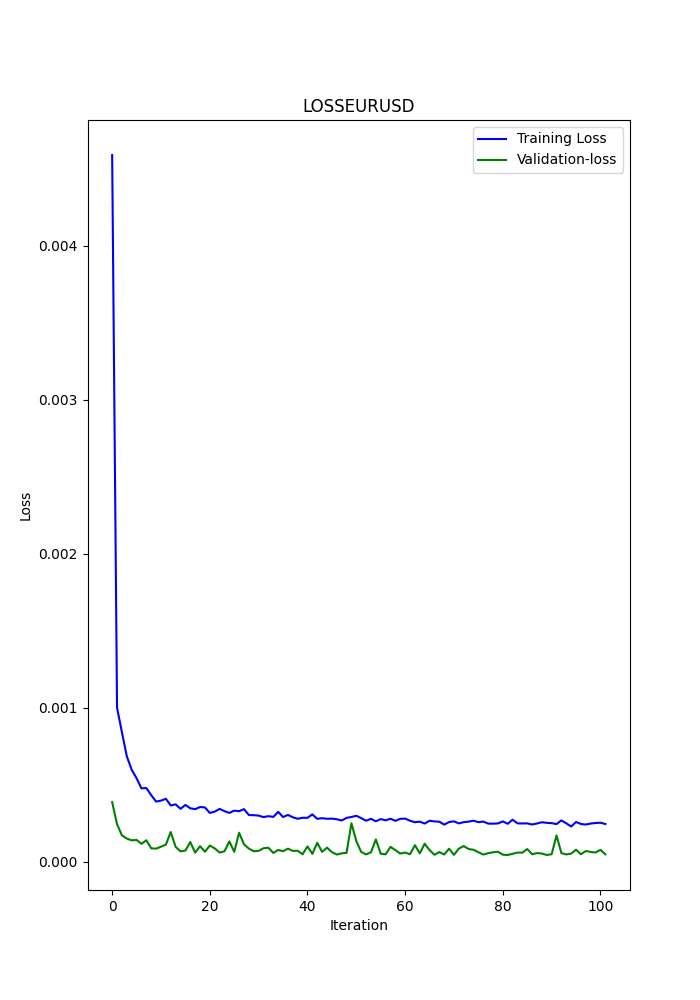
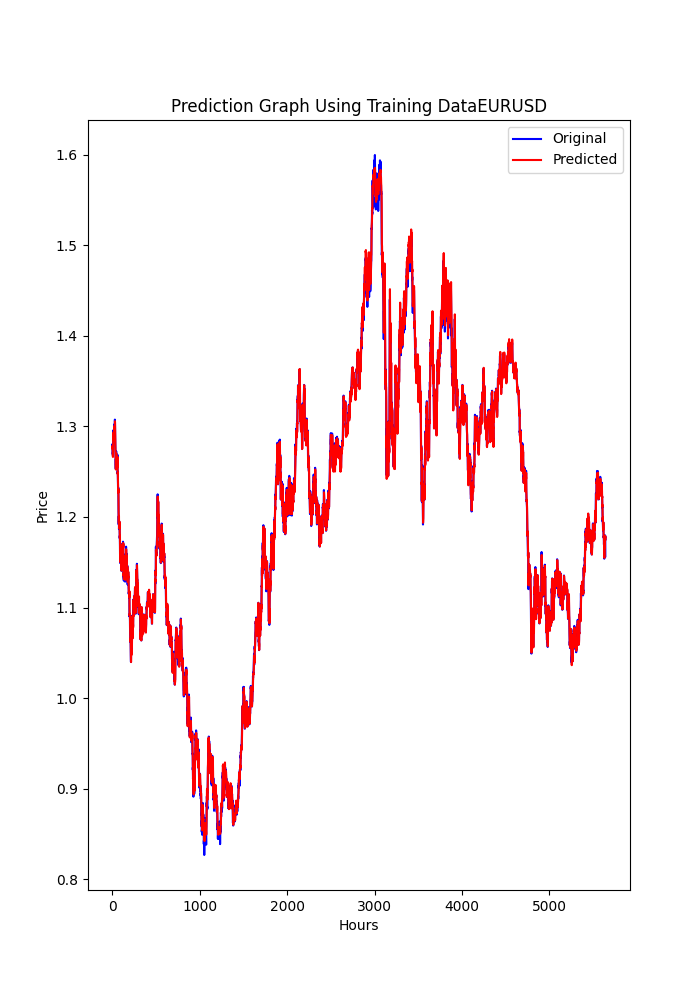
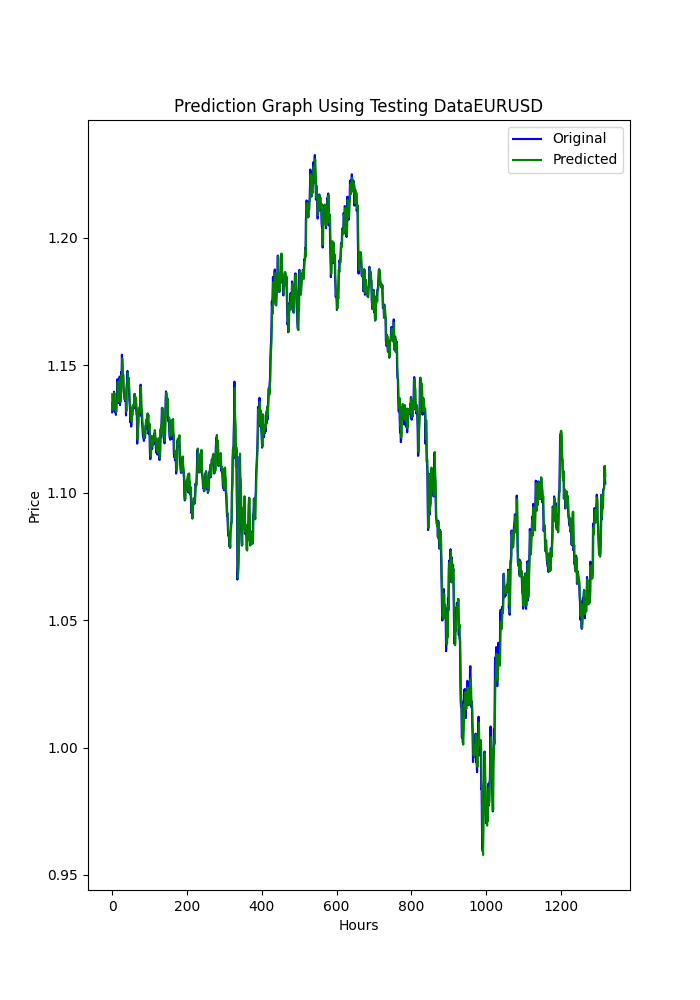
スクリプトは、端末に表示されるのと同じ順序で、以前のメトリックが保存された.txtファイルも保存します。
このスクリプトを使用するには、まずPython 3.11.9をインストールし、次にpip installを使用して必要なライブラリをインストールする必要があります。
tensorflow==2.12.0, keras==2.12.0, tf2onnx==1.16.0, MetaTrader5, pandas, numpy, scikit-learn, tf2onnx, keras
MicrosoftのストアからダウンロードできるVisual Studio Codeを使うことを強くお勧めします。
次をインストールするよう求められるかもしれません。
Microsoft Visual C++ 2015 - 2022 Redistributable
.pyスクリプトを添付しますので、VSCで開いて実行してください。
何か(銘柄、データの取得元、期間)を変更したい場合は、以下の行だけを変更します。
symbol = "EURUSD"
optional = "D1_2024"
銘柄は明白ですが、オプションで使用期間とデータの最終日に変更することをお勧めします。
eurusd_rates = mt5.copy_rates_from(symbol, mt5.TIMEFRAME_D1, end_date, sample_size)
この行で時間枠を変更します。例えばH1(1時間枠)です。
これでディープラーニングONNXモデルができたので、他の記事ですでに持っているEAに追加することができます。
ONNXのディープラーニングモデル(2024年)を添付します。
EAへの追加
CNAの修正
これは基本です。
まず、入力パラメータの最初に、次の行を追加します。
#include <Trade\Trade.mqh>

#resource "/Files/EURUSD_D1.onnx" as uchar ExtModel[]

#define SAMPLE_SIZE 120

long     ExtHandle=INVALID_HANDLE;
int      ExtPredictedClass=-1;
datetime ExtNextBar=0;
datetime ExtNextDay=0;
float    ExtMin=0.0;
float    ExtMax=0.0;
CTrade   ExtTrade;
int dlsignal=-1;

//--- price movement prediction
#define PRICE_UP   0
#define PRICE_SAME 1
#define PRICE_DOWN 2
作成したONNXモデルを使用してこの行を変更することを忘れないでください(pyスクリプトはMQL5/Files/... モデルに保存されます)。
#resource "/Files/EURUSD_D1_2024.onnx" as uchar ExtModel[]
OnInit()に次を追加します。
//--- create a model from static buffer
   ExtHandle=OnnxCreateFromBuffer(ExtModel,ONNX_DEFAULT);
   if(ExtHandle==INVALID_HANDLE)
     {
      Print("OnnxCreateFromBuffer error ",GetLastError());
      return(INIT_FAILED);
     }

//--- since not all sizes defined in the input tensor we must set them explicitly
//--- first index - batch size, second index - series size, third index - number of series (only Close)
   const long input_shape[] = {1,SAMPLE_SIZE,1};
   if(!OnnxSetInputShape(ExtHandle,ONNX_DEFAULT,input_shape))
     {
      Print("OnnxSetInputShape error ",GetLastError());
      return(INIT_FAILED);
     }

//--- since not all sizes defined in the output tensor we must set them explicitly
//--- first index - batch size, must match the batch size of the input tensor
//--- second index - number of predicted prices (we only predict Close)
   const long output_shape[] = {1,1};
   if(!OnnxSetOutputShape(ExtHandle,0,output_shape))
     {
      Print("OnnxSetOutputShape error ",GetLastError());
      return(INIT_FAILED);
     }
場所についてはどこでも問題ありません(関数のreturn直前)。
OnDeinit関数には次を追加します。
if(ExtHandle!=INVALID_HANDLE)
     {
      OnnxRelease(ExtHandle);
      ExtHandle=INVALID_HANDLE;
     }
場所についてはどこでも大丈夫です。これでONNXモデルをリリースします。
OnTick関数に次のように追加します。
void OnTick()
  {
  //--- check new day
   if(TimeCurrent()>=ExtNextDay)
     {
      GetMinMax();
      //--- set next day time
      ExtNextDay=TimeCurrent();
      ExtNextDay-=ExtNextDay%PeriodSeconds(PERIOD_D1);
      ExtNextDay+=PeriodSeconds(PERIOD_D1);
     }

//--- check new bar
   if(TimeCurrent()<ExtNextBar)
      return;
//--- set next bar time
   ExtNextBar=TimeCurrent();
   ExtNextBar-=ExtNextBar%PeriodSeconds();
   ExtNextBar+=PeriodSeconds();
//--- check min and max
   float close=(float)iClose(_Symbol,_Period,0);
   if(ExtMin>close)
      ExtMin=close;
   if(ExtMax<close)
      ExtMax=close;

   PredictPrice();
場所については、初めにすることが重要です。なぜなら、PredictPrice()関数の結果を注文ロジックに追加しなければならないからです。
OnTick()関数の中で、注文を出す関数も変更する必要があり、この場合は(CNA_DL)、元の行を変更します。
int signal = GenerateSignal(symbol, prediction); を次の行に追加します。
int signal = GenerateSignal(symbol, prediction, ExtPredictedClass); ExtPredictedClassは、前に追加したPredictedPrice()関数の結果です。
ここで、GenerateSignal()のロジックも修正し、ExtPredictedClassを使用するようにします。
その関数のヘッダーを変更します。
int GenerateSignal(string symbol, double prediction, int dlsgnl)
そして、新しい変数を注文を出すロジックに追加します。
以下をbool buy_condition = prediction > 0.00001 && rsi < 30 && trend_strong && volatility_ok && fastMA > slowMA; bool sell_condition = prediction < -0.00001 && rsi > 70 && trend_strong && volatility_ok && fastMA < slowMA;以下に置き換えます。
   bool buy_condition =  prediction >  0.00001 && rsi < 30 && trend_strong  && volatility_ok && fastMA > slowMA && dlsgnl==PRICE_UP;
   bool sell_condition = prediction < -0.00001 && rsi > 70 && trend_strong && volatility_ok && fastMA < slowMA && dlsgnl==PRICE_DOWN;
最後に修正しなければならないのは、この部分です。
この関数をスクリプトに追加しなければなりません。どこでもいいです。例えば最後でもいいです。
//+------------------------------------------------------------------+
void PredictPrice(void)
  {
   static vectorf output_data(1);            // vector to get result
   static vectorf x_norm(SAMPLE_SIZE);       // vector for prices normalize

//--- check for normalization possibility
   if(ExtMin>=ExtMax)
     {
      Print("ExtMin>=ExtMax");
      ExtPredictedClass=-1;
      return;
     }
//--- request last bars
   if(!x_norm.CopyRates(_Symbol,_Period,COPY_RATES_CLOSE,1,SAMPLE_SIZE))
     {
      Print("CopyRates ",x_norm.Size());
      ExtPredictedClass=-1;
      return;
     }
   float last_close=x_norm[SAMPLE_SIZE-1];
//--- normalize prices
   x_norm-=ExtMin;
   x_norm/=(ExtMax-ExtMin);
//--- run the inference
   if(!OnnxRun(ExtHandle,ONNX_NO_CONVERSION,x_norm,output_data))
     {
      Print("OnnxRun");
      ExtPredictedClass=-1;
      return;
     }
//--- denormalize the price from the output value
   float predicted=output_data[0]*(ExtMax-ExtMin)+ExtMin;
//--- classify predicted price movement
   float delta=last_close-predicted;
   if(fabs(delta)<=0.00001)
      ExtPredictedClass=PRICE_SAME;
   else
     {
      if(delta<0)
         ExtPredictedClass=PRICE_UP;
      else
         ExtPredictedClass=PRICE_DOWN;
     }
  }


  void GetMinMax(void)
  {
   vectorf close;
   close.CopyRates(_Symbol,PERIOD_D1,COPY_RATES_CLOSE,0,SAMPLE_SIZE);
   ExtMin=close.Min();
   ExtMax=close.Max();
  }
この2つの関数は予測の鍵となるもので、1つは予測をおこない、もう1つは終了の最小値と最大値を取得します。
SMOCの修正
すべては同じままで、変更点はこれを除いて以前のものと同じです。
入力パラメータでは、dlsignalを初期化したり、CTradeを追加したりしません。
#resource "/Files/EURUSD_D1.onnx" as uchar ExtModel[]

#define SAMPLE_SIZE 120

long     ExtHandle=INVALID_HANDLE;
int      ExtPredictedClass=-1;
datetime ExtNextBar=0;
datetime ExtNextDay=0;
float    ExtMin=0.0;
float    ExtMax=0.0;

//--- price movement prediction
#define PRICE_UP   0
#define PRICE_SAME 1
#define PRICE_DOWN 2
OnTick()では次のようになります。
void OnTick()
  {
//--- check new day
   if(TimeCurrent()>=ExtNextDay)
     {
      GetMinMax();
      //--- set next day time
      ExtNextDay=TimeCurrent();
      ExtNextDay-=ExtNextDay%PeriodSeconds(PERIOD_D1);
      ExtNextDay+=PeriodSeconds(PERIOD_D1);
     }

//--- check new bar
   if(TimeCurrent()<ExtNextBar)
      return;
//--- set next bar time
   ExtNextBar=TimeCurrent();
   ExtNextBar-=ExtNextBar%PeriodSeconds();
   ExtNextBar+=PeriodSeconds();
//--- check min and max
   float close=(float)iClose(_Symbol,_Period,0);
   if(ExtMin>close)
      ExtMin=close;
   if(ExtMax<close)
      ExtMax=close;

   PredictPrice();

   static datetime lastBarTime = 0;
   datetime currentBarTime = iTime(Symbol(), PERIOD_CURRENT, 0);

// Only process on new bar
   if(currentBarTime == lastBarTime)
      return;

   lastBarTime = currentBarTime;

   double currentPrice = SymbolInfoDouble(Symbol(), SYMBOL_LAST);
   int decision = OptimalControl(currentPrice);

   string logMessage = StringFormat("New bar: Time=%s, Price=%f, Decision=%d",
                                    TimeToString(currentBarTime), currentPrice, decision);
   LogMessage(logMessage);

// Manage open order if exists
   if(orderTicket != 0)
     {
      ManageOpenOrder(decision, ExtPredictedClass);
     }

   if(orderTicket == 0 && decision != 0 && IsTrendFavorable(decision) && IsLongTermTrendFavorable(decision) && (ExtPredictedClass==PRICE_DOWN || ExtPredictedClass==PRICE_UP))
     {
      ExecuteTrade(decision, ExtPredictedClass);
     }
  }
ManageOpenOrder()でこの変更をおこないます。
void ManageOpenOrder(int decision, int dlsignal)
  {
   int barsOpen = iBars(Symbol(), PERIOD_CURRENT) - iBarShift(Symbol(), PERIOD_CURRENT, orderOpenTime);
   LogMessage(StringFormat("Bars open: %d for order ticket: %d", barsOpen, orderTicket));

   if(barsOpen >= maxBarsOpen ||
      (PositionGetInteger(POSITION_TYPE) == POSITION_TYPE_BUY && decision == -1 && dlsignal == PRICE_DOWN) ||
      (PositionGetInteger(POSITION_TYPE) == POSITION_TYPE_SELL && decision == 1 && dlsignal == PRICE_UP))
     {
      CloseOrder(orderTicket);
      orderTicket = 0;
      orderOpenTime = 0;
     }
   else
     {
      UpdateSLTP(orderTicket, decision);
     }
  }
ExecuteTrade()では次のようになります。
void ExecuteTrade(int decision, int dlsignal)
  {
   MqlTradeRequest request = {};
   MqlTradeResult result = {};
   double price;
   int decision1;


   if(decision == 1 && dlsignal == PRICE_UP)
     {
      price = SymbolInfoDouble(Symbol(), SYMBOL_ASK);
      request.type = ORDER_TYPE_BUY;
      decision1 = 1;
     }
   else
      if(decision == -1 && dlsignal == PRICE_DOWN)
        {
         price = SymbolInfoDouble(Symbol(), SYMBOL_BID);
         request.type = ORDER_TYPE_SELL;
        decision1 = -1;
        }
   double sl = CalculateDynamicSL(price, decision1);
   double tp = CalculateDynamicTP(price, decision1);


   double adjustedLotSize = AdjustLotSizeForDrawdown();
   request.volume = adjustedLotSize;

   request.action = TRADE_ACTION_DEAL;
   request.symbol = Symbol();
//request.volume = lotSize;
//request.type = (decision == 1 && dlsignal == PRICE_UP) ? ORDER_TYPE_BUY : ORDER_TYPE_SELL;
   request.price = price;
   request.sl = sl;
   request.tp = tp;
   request.deviation = 10;
   request.magic = 123456; // Magic number to identify orders from this EA
   request.comment = (decision == 1) ? "Buy Order" : "Sell Order";

   if(OrderSend(request, result))
     {
      Print((decision1 == 1 ? "Buy" : "Sell"), " Order Executed Successfully. Ticket: ", result.order);
      orderOpenTime = iTime(Symbol(), PERIOD_CURRENT, 0);
      orderTicket = result.order;
     }
   else
     {
      Print("Error executing Order: ", GetLastError());
     }
  }
次に、ナッシュエクイティスクリプトを修正します。
ナッシュエクイティの修正
OnTick()関数を除き、すべての変更は同じです。
void OnTick()
  {
//--- check new day
   if(TimeCurrent()>=ExtNextDay)
     {
      GetMinMax();
      //--- set next day time
      ExtNextDay=TimeCurrent();
      ExtNextDay-=ExtNextDay%PeriodSeconds(PERIOD_D1);
      ExtNextDay+=PeriodSeconds(PERIOD_D1);
     }

//--- check new bar
   if(TimeCurrent()<ExtNextBar)
      return;
//--- set next bar time
   ExtNextBar=TimeCurrent();
   ExtNextBar-=ExtNextBar%PeriodSeconds();
   ExtNextBar+=PeriodSeconds();
//--- check min and max
   float close=(float)iClose(_Symbol,_Period,0);
   if(ExtMin>close)
      ExtMin=close;
   if(ExtMax<close)
      ExtMax=close;

   PredictPrice();

   if(!IsNewBar())
      return; // Solo procesar en nueva barra

   MarketRegime hmmRegime = NOT_PRESENT;
   MarketRegime logLikelihoodRegime = NOT_PRESENT;
   DetectMarketRegime(hmmRegime, logLikelihoodRegime);

// Calcular señales para cada estrategia
   CalculateStrategySignals(_Symbol, TimeCurrent(), hmmRegime, logLikelihoodRegime);

// Verificar si la estrategia de Nash Equilibrium ha generado una señal
   if(strategies[3].enabled && strategies[3].signal != 0)
     {
      if(strategies[3].signal > 0 && ExtPredictedClass==PRICE_UP)
        {
         OpenBuyOrder(strategies[3].name);
        }
      else
         if(strategies[3].signal < 0 && ExtPredictedClass==PRICE_DOWN)
           {
            OpenSellOrder(strategies[3].name);
           }
     }

// Actualizar stops de seguimiento si es necesario
   if(UseTrailingStop)
     {
      UpdateTrailingStops();
     }
  }
結果
CNA_DL
設定

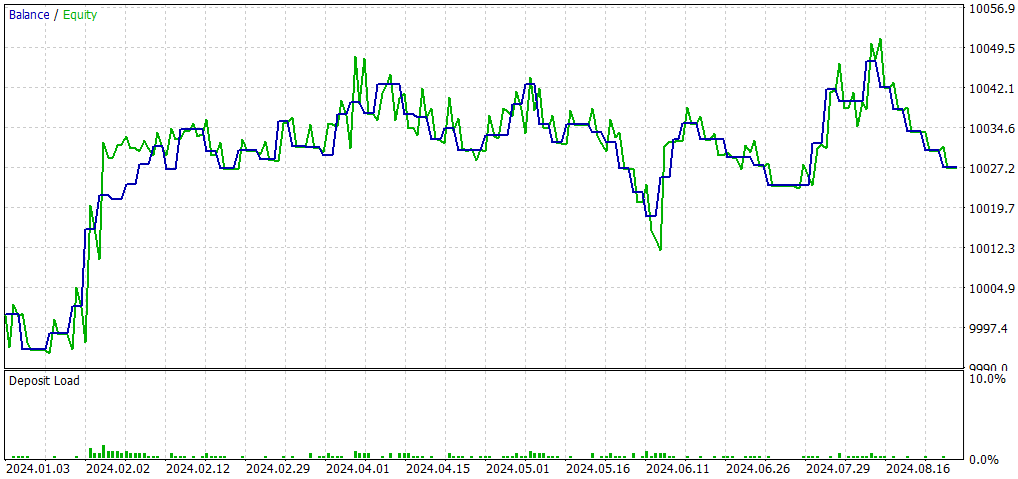
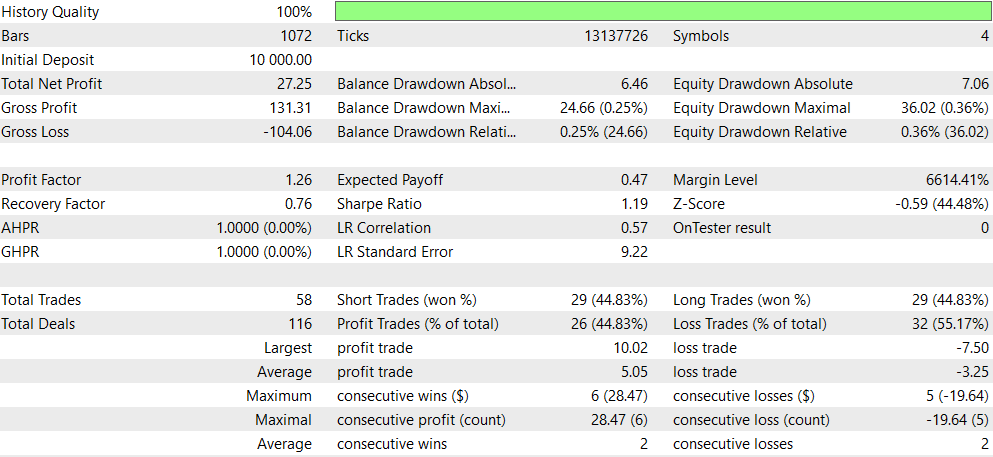
以下は、元のEA(CNA_Final_v4)との比較です。
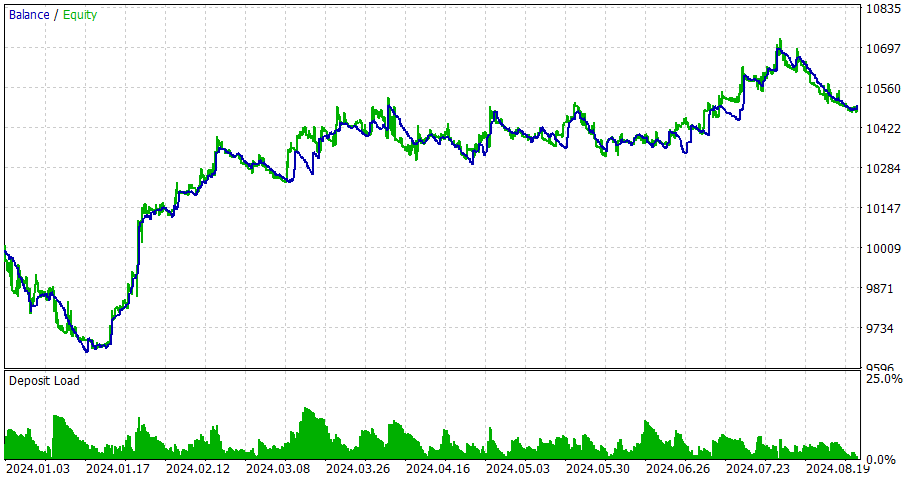
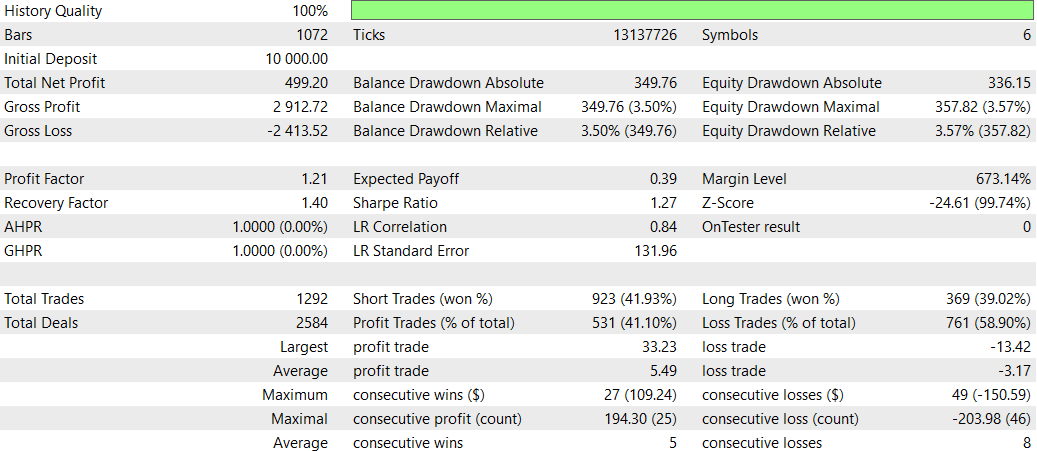
ディープラーニングの有無によるCNAの比較
- 収益性:非ディープラーニングEAは収益性が大幅に高いものの、ドローダウンも大きいため、リスクが高くなります。
- リスク:ディープラーニングEAはドローダウンが低く、より保守的なアプローチを取る傾向があります。
- 取引頻度:非ディープラーニングEAは、ディープラーニングEAよりもはるかに頻繁に取引を行います(1292回対58回)。
- 勝率:ディープラーニングEAの勝率はわずかに優れていますが、どちらも50%未満です。
- 戦略の偏り:非ディープラーニングEAはショートトレードに強い偏りを見せる一方、ディープラーニングEAはバランスの取れた戦略を採用しています。
- 一貫性:ディープラーニングEAは、連続した勝ち負けのサイクルが短いため、一貫性が高いと見なされます。
結論として、非ディープラーニングEAは高い収益性を誇りますが、リスクも高くなります。一方で、ディープラーニングEAはリスクが低く、より保守的なアプローチを取るものの、リターンは比較的低いです。どちらを選択するかは、トレーダーのリスク許容度と投資目標によります。安定した取引を重視するならディープラーニングEAが好まれ、より高いリターンを目指しリスクを取る場合は、非ディープラーニングEAが選ばれるかもしれません。
SMOC_DL

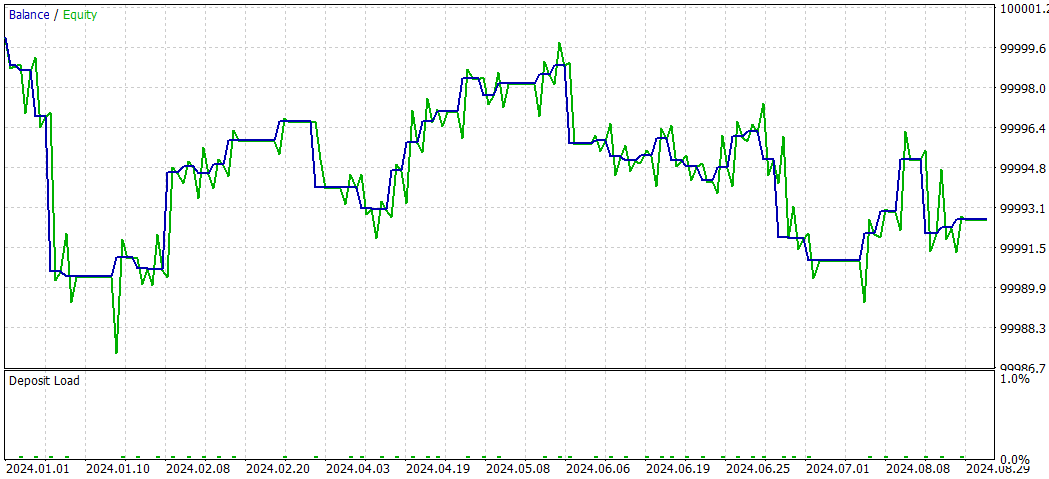
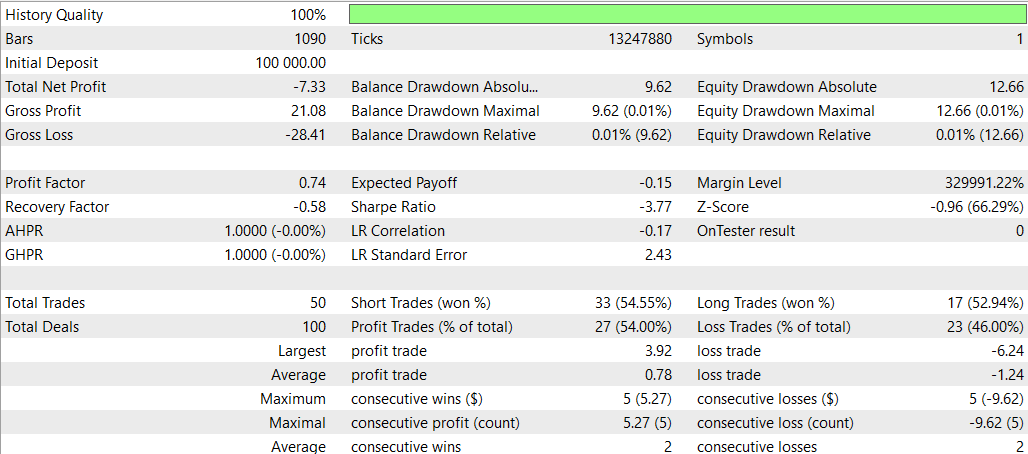
ディープラーニングを使わないSMOC
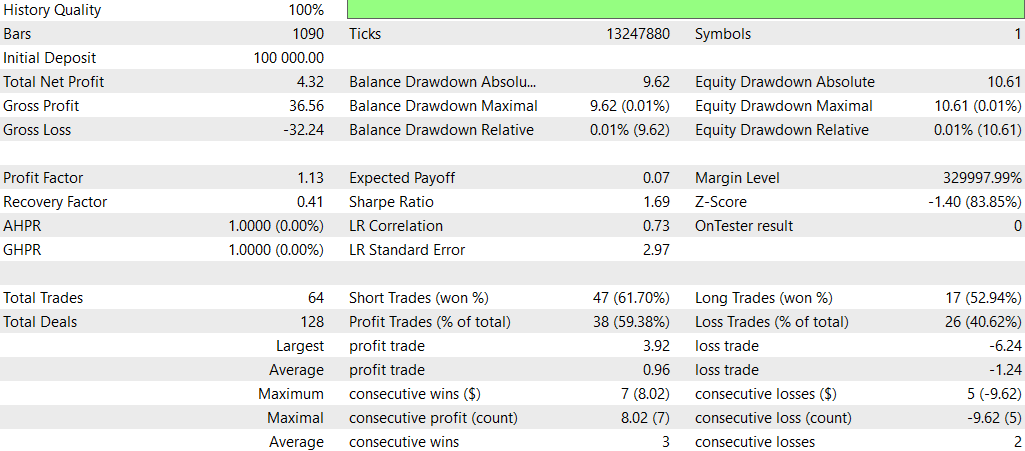
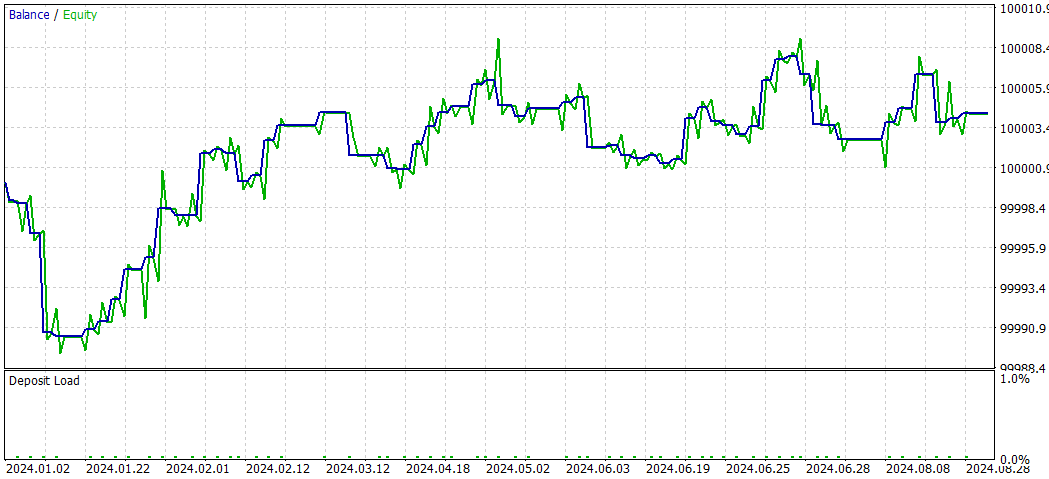
SMOC_DLとSMOCの比較
- 収益性:戦略2は収益性が高く(4.32)、戦略1は収益性が低い(-7.33)です。
- リスク調整後リターン:戦略2のシャープレシオはプラス(1.69)で、戦略1のシャープレシオはマイナス(-3.77)です。これにより、戦略2のリスク調整後リターンが優れていることが示されています。
- 勝率:戦略2の勝率は59.38%で、戦略1(54%)を上回っています。
- 取引数:戦略2は戦略1(50回)の取引数に対して、64回と多くの取引を実行しており、より多くの機会を特定できている可能性があります。
- プロフィットファクター:戦略2のプロフィットファクターは1.13で、戦略1の0.74を上回っています。これは、戦略2が損失を上回る利益を生み出すのに効果的であることを示しています。
- ドローダウン:両方の戦略ともドローダウンは非常に低く(口座の0.01%)、リスク管理が良好であることが分かります。
- 取引の配分:どちらの戦略もショート取引を優先していますが、戦略2ではショート取引とロング取引の配分がよりバランスよく取られています。
戦略2は、収益性、リスク調整後リターン、勝率、利益率などほとんどの面で優れており、より多くの取引機会を特定しています。どちらの戦略も低ドローダウンを維持しており、リスク管理がしっかりとされています。このデータに基づくと、戦略2が優先されるべきです。ままた、ディープラーニングを使用する適切な方法としては、他の時間枠を試すことが推奨されます。
NASH_DL

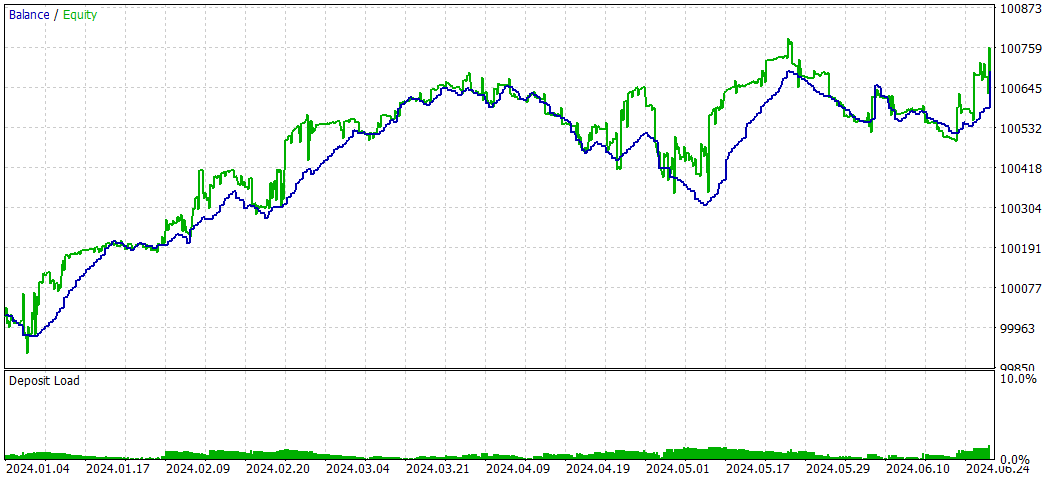
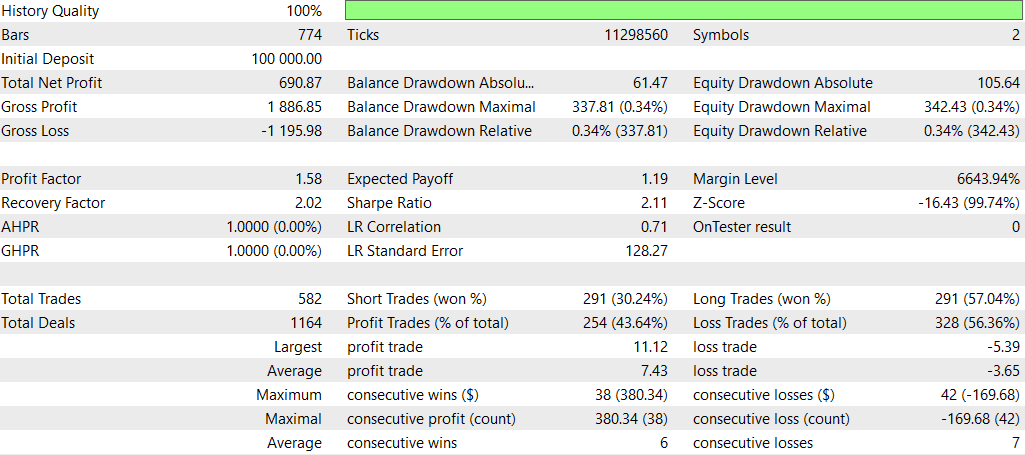
以下は、ディープラーニングなしの結果です。
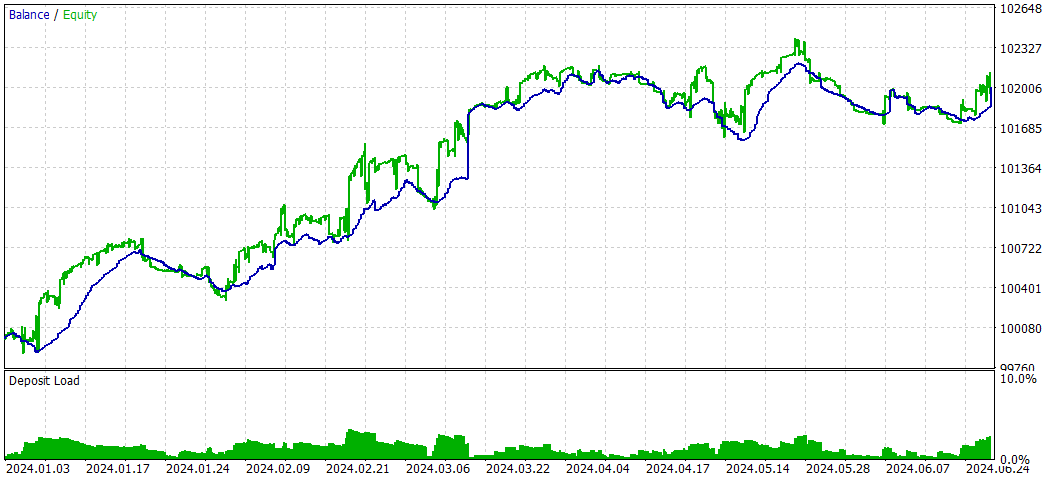
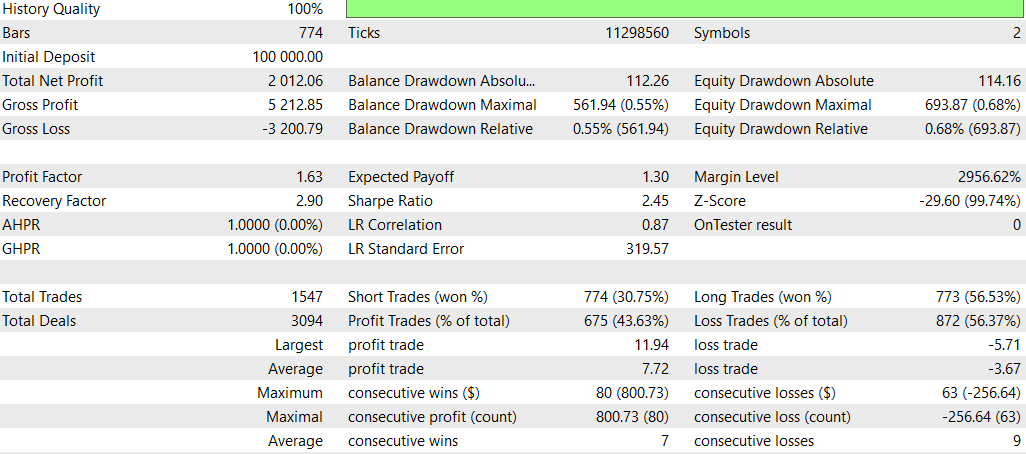
全体的に、最大ドローダウンが高かったにもかかわらず、非ディープラーニング戦略は総収益性とリスク調整後リターンの点で優れたパフォーマンスを示しました。この戦略はより積極的に取引を行い、ロングポジションでより効果的であるようです。一方、ディープラーニング戦略はより保守的で、ドローダウンが低かったものの、全体的なリターンは低くなりました。
ただし、この比較は単一のバックテスト期間に基づいている点に注意する必要があります。より確実な結論を導き出すためには、複数の期間や異なる市場状況においてこれらの戦略をテストすることが重要です。
結論
本研究では、因果ネットワーク分析(CNA)、確率的最適化および最適制御(SMOC)、ナッシュゲーム理論の3つの高度な取引EAに対するディープラーニングモデルの統合について調査しました。このプロセスでは、Pythonを使用してONNXモデルを作成し、それを既存のMQL5スクリプトに組み込みました。
統合の結果は戦略によって異なりました。
- CNA戦略では、ディープラーニングバージョンは非ディープラーニングバージョンと比較して、より保守的な取引を示しました。収益性は低かったものの、リスクも抑えられ、取引の一貫性とバランスの取れたアプローチが評価されました。
- SMOC戦略では、ディープラーニングバージョンが非ディープラーニングバージョンを大幅に上回りました。収益性、勝率、リスク調整後のリターンが向上し、ディープラーニングモデルが戦略の意思決定プロセスを効果的に強化したことが示されました。
- ナッシュゲーム理論アプローチでは、最大ドローダウンが高かったにもかかわらず、非ディープラーニングバージョンの方が全体的なパフォーマンスが優れており、総収益性とリスク調整後リターンが高くなりました。ディープラーニングバージョンはより保守的に取引されましたが、全体的なリターンは低くなりました。
これらの結果は、ディープラーニングを取引戦略に統合する可能性を示唆していますが、その実装とテストには慎重なアプローチが必要です。ディープラーニングの効果は基盤となる戦略と市場状況に大きく依存することが分かりました。
なお、この調査結果は特定のバックテスト期間および市場状況に基づいています。より確実な結論を導くためには、さまざまな時間枠や市場シナリオでの追加テストが必要です。
結論として、ディープラーニングは取引戦略を強化する可能性がありますが、その統合には慎重な実装と徹底的なテストが求められます。結果が戦略や市場によって異なることから、ディープラーニングの有効性は普遍的ではなく、特定の戦略と市場状況に依存することが示唆されています。今後の研究では、異なる時間枠や市場条件に合わせたディープラーニングモデルの最適化を進め、さまざまな取引シナリオでのパフォーマンス向上の可能性を探ることができます。
MetaQuotes Ltdにより英語から翻訳されました。
元の記事: https://www.mql5.com/en/articles/15819
 MQL5エキスパートアドバイザーに自動最適化を実装する方法
 MQL5-Telegram統合エキスパートアドバイザーの作成(第6回):レスポンシブなインラインボタンの追加
 MQL5で取引管理者パネルを作成する(第3回):ビジュアルスタイリングによるGUIの強化(I)
 知っておくべきMQL5ウィザードのテクニック(第38回):ボリンジャーバンド
- 無料取引アプリ
- 8千を超えるシグナルをコピー
- 金融ニュースで金融マーケットを探索