Regardez les tutoriels vidéo de Market sur YouTube
Comment acheter un robot de trading ou un indicateur
Exécutez votre EA sur
hébergement virtuel
hébergement virtuel
Test un indicateur/robot de trading avant d'acheter
Vous voulez gagner de l'argent sur Market ?
Comment présenter un produit pour qu'il se vende bien
Indicateurs techniques pour MetaTrader 5 - 60

Highs, Lows and Bos Indicator for MT5; The indicator works on any type of market and on all TimeFrames. It also works on the MetaTrader5 Tester. the main function of the indicator is to identify the highs and lows by marking them with a point above/below the candle, then with a horizontal line it marks the Bos. It is very simple and intuitive, there are only 2 inputs: -the color of the maximums -the color of the minima
For any other information do not hesitate to contact me.
The Reversal Candlestick Structure indicator detects multiple candlestick patterns occurring when trends are most likely to experience a reversal in real-time. The reversal detection method includes various settings allowing users to adjust the reversal detection algorithm more precisely.
A dashboard showing the percentage of patterns detected as reversals is also included. USAGE Figure 1 Candlestick patterns are ubiquitous to technical analysts, allowing them to detect trend continuati
The DYJ SignalSource WPRBashboard signal source is based on the WPR indicator information dashboard It can be used for any currency pair and time frame.
WPR suggests that a metric value between 80% and 100% indicates oversold in the market The indicator value between 0 and 20% indicates that the market is overbought.
The entry signal of this indicator is a turning point in the trend.
It provides reverse trend selection direction.
This indicator uses simulated trading techniques.
It pr

Cet assistant de nouvelles est conçu pour obtenir les événements économiques dont les traders ont besoin à partir des principales sources de publication, qui publient des nouvelles en temps réel sur la base du Market Watch du terminal avec des filtres variés et simples.
Les traders du Forex utilisent des indicateurs macroéconomiques pour prendre des décisions éclairées concernant l’achat et la vente de devises. Par exemple, si un trader estime que l’économie américaine va croître plus rapidem

Ce produit est conçu pour afficher les sessions de trading de 15 pays en fonction du fuseau horaire de votre serveur de courtier et de divers modes d'affichage en fonction des paramètres souhaités pour éviter la congestion des graphiques et la possibilité de définir une session avec l'heure souhaitée par l'utilisateur.
Le soleil ne se couche jamais sur le marché des changes, mais son rythme danse au rythme de séances de trading distinctes. Comprendre ces sessions, leurs chevauchements et leur
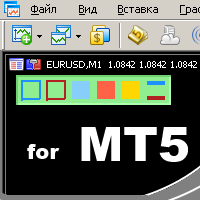
удобный инструмент для тех, кто использует технический анализ с использованием таких инструментов, как Трендовая линия и Прямоугольник. Имеется возможность настройки двух пустых прямоугольников, трех закрашенных и двух трендовых линий. Настройки индикатора крайне просты и делятся на пронумерованные блоки: С цифрами 1 и 2 вначале - настройки пустых прямоугольников (рамок); С цифрами 3, 4 и 5 - настройки закрашенных прямоугольников; С цифрами 6 и 7 - настройки трендовых линий. Объекты создаются оч

To get access to MT4 version please click here . This is the exact conversion from TradingView: " WaveTrend" by LazyBear.
This is a light-load processing and non-repaint indicator. All input options are available. Buffers are available for processing in EAs. You can message in private chat for further changes you need. The filling area option is omitted to fit into MT5 graphics.

L'indicateur du tableau de bord des bandes de Bollinger offre un moyen pratique et informatif de suivre les signaux de l'indicateur des bandes de Bollinger sur différentes périodes à l'aide d'un seul panneau (tableau de bord). Cet outil permet aux traders d'obtenir rapidement et facilement les informations dont ils ont besoin, permettant ainsi une prise de décision efficace sur le marché.
Caractéristiques principales:
1. **Panneau de signaux** : le tableau de bord affiche les signaux des ba
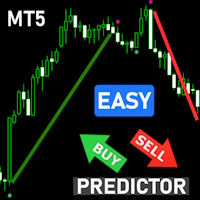
Overview: Elevate your trading strategy with the Advanced SuperTrend Buy Sell Signals Indicator! Designed for both novice and professional traders, this indicator provides clear and accurate buy/sell signals based on the popular SuperTrend algorithm, enhanced with customizable parameters and visual alerts. Features: Clear Trend Visualization: Identifies UpTrends (green line) and DownTrends (red line) with precision. Customizable Parameters: Adjust ATR period and multiplier to fit your trading s

Key Features: Pattern Recognition : Identifies Fair Value Gaps (FVGs) Spots Break of Structure (BOS) points Detects Change of Character (CHoCH) patterns Versatile Application : Optimized for candlestick charts Compatible with any chart type and financial instrument Real-Time and Historical Analysis : Works seamlessly with both real-time and historical data Allows for backtesting strategies and live market analysis Visual Representation : Draws rectangles to highlight significant areas on the cha
FREE

SMT (Smart Money Technique) Divergence refers to the price divergence between correlated assets or their relationship to inversely correlated assets. By analyzing SMT Divergence, traders can gain insights into the market's institutional structure and identify whether smart money is accumulating or distributing assets. Every price fluctuation should be confirmed by market symmetry, and any price asymmetry indicates an SMT Divergence, suggesting a potential trend reversal. MT4 Version - https:/

the Spike detector show multiple indication for entries, for max profits enter on each indication given u can also add on lots size as entries go to secure max profits before spike occure, the more entries you enter along the way ,the more profits u have after the initial spike, after spike hold 3-5 candles before close for max profits . good on al timeframes max stop loss is 22candles.

RSI Divergence Signal
The RSI Divergence Signal is a technical analysis tool used in financial markets to identify potential trend reversals. It compares the Relative Strength Index (RSI) with price action to detect divergences. When the RSI moves in the opposite direction of the price, it signals a potential change in momentum, suggesting that the current trend may be weakening. This divergence can indicate a buying opportunity in a downtrend or a selling opportunity in an uptrend. Traders

The indicator is based on the relationship between two sets of Stochastic lines. The first set consists of 6 Stochastic with periods: 5, 8, 10, 12, 14, 16. The second set consists of 6 Stochastic with periods: 34, 39, 44, 50, 55, 60. These periods are customizable. Input parameters Stochastic MA Method Method of calculation ===== Short-term ===== Stochastic #1 %K Period Stochastic #2 %K Period Stochastic #3 %K Period Stochastic #4 %K Period Stochastic #5 %K Period Stochastic #6 %K Period Short

Magnified Price Experience trading like never before with our Magnified Price indicator by BokaroTraderFx, designed exclusively for MetaTrader 5. This revolutionary tool provides traders with instant insights into price movements, offering a clear advantage in today's fast-paced markets.
Key Features: 1. Real-time Precision: Instantly magnify price action to uncover hidden trends and patterns. 2. Enhanced Visibility: Clear visualization of price movements with adjustable zoom levels. 3. Us
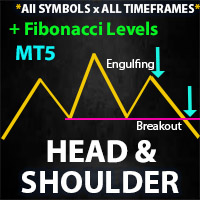
** All Symbols x All Timeframes scan just by pressing scanner button ** *** Contact me after the purchase to send you instructions and add you in "Head & Shoulders Scanner group" for sharing or seeing experiences with other users. Introduction: Head and Shoulders Pattern is a very repetitive common type of price reversal patterns. The pattern appears on all time frames and can be used by all types of traders and investors. The Head and Shoulders Scanner indicator Scans All char

** All Symbols x All Time frames scan just by pressing scanner button ** *** Contact me after the purchase to send you instructions and add you in "Order Block group" for sharing or seeing experiences with other users. Introduction: The central banks and financial institutions mainly drive the market, Order block is considered a market behavior that indicates accumulation of orders from banks and institutions, then the market tends to make a sharp move(Imbalance) on either side once

Market Heartbeat is in your hand! Introduction The Market Heartbeat indicator with a special enhanced algorithm (volume, money flow, cycle of market and a secret value) is a very repetitive trend finder with a high success rate . Interestingly, this Winner indicator indicates that the trend has changed its direction or the end of a trend retracement or even appears at the range market. The Market Heartbeat can use in scalping trading or trend trading. It finds immediately with alarm, n
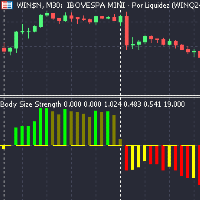
Indicateur de Force de Taille de Corps Vue d'ensemble L' Indicateur de Force de Taille de Corps fournit une suite complète de calculs qui analysent les mouvements de prix quotidiens, offrant des informations exploitables qui peuvent améliorer considérablement vos stratégies de trading. Caractéristiques Clés 5 Buffers Extensifs : Inclut les buffers BodySize, BodySizeROC, Sum_POS_BodySize, Sum_NEG_BodySize et Diff_SUM_POS_NEG_BodySize, fournissant une vue détaillée et nuancée de la dynamique du ma
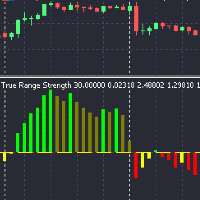
Indicateur de Force du True Range avec Options de Déclenchement Avancées Cet indicateur calcule et affiche diverses métriques liées aux variations de prix quotidiennes : Métriques True Range (TR) : Le maximum de (Haut - Bas, |Haut - Clôture Précédente|, |Bas - Clôture Précédente|) Taux de Variation du TR (TR_ROC) : Variation en pourcentage du TR par rapport au prix de référence quotidien Somme Quotidienne des TR ROC Positifs : Accumulation des valeurs positives du TR ROC au cours d'une journée S
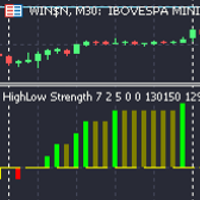
Indicateur de Force des Sommets et Creux Aperçu L' Indicateur de Force des Sommets et Creux est un outil puissant conçu pour surveiller et montrer à quelle fréquence de nouveaux sommets et creux quotidiens se produisent dans la journée, également appelés pics et creux, ou pour suivre la fréquence des sommets et creux. Cet indicateur met en évidence les tendances du marché et les retournements potentiels, ce qui le rend essentiel pour les investisseurs, les traders intraday et les traders quantit
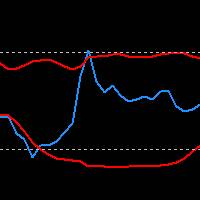
Indicatore RSI con bande di Bollinger: massimizza il win rate con precisione e strategie avanzate di trading. Personalizza il periodo dell'RSI, la media delle bande e la deviazione per adattare l'indicatore alle tue strategie uniche. Su richiesta, offriamo anche la possibilità di personalizzare o creare indicatori customizzati per soddisfare al meglio le tue esigenze di trading.
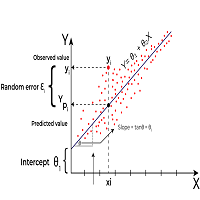
Linear Regression is a statistical method used to model the relationship between two or more variables. The primary goal of Linear Regression is to predict the value of one variable (called the dependent variable or outcome variable) based on the value of one or more other variables (called independent variables or explanatory variables) Linear Regression can be applied to technical analysis, and it is indeed one of the tools used by traders and analysts to make predictions and identify trends i
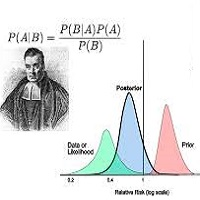
Bayesian methods can be effectively applied to predict price trends in financial markets, including Forex, stocks, and commodities. Here’s how Bayesian techniques can be used for trend prediction: 1. Bayesian Linear Regression Bayesian linear regression can be used to model the relationship between time and price. This method allows for the incorporation of prior beliefs about the trend and updates the trend as new data comes in. Example: Suppose you want to predict the price trend of a currency

Dominant Candle Finder is a significant candlestick on a price chart that stands out due to its size, volume, or price movement compared to surrounding candles. It often indicates strong buying or selling pressure and can be used to identify potential reversal points, breakouts, or continuations in the market. Dominant candles can serve as key indicators for traders to make informed decisions, providing insights into market sentiment and potential future price movements. MT4 Version - https://w
This indicator will draw lines for previous day Highs and Lows, current day open price and current day price plus and minus ATR. This will provide an overview of the support and resistance for the price movement of the current trading day. The ATR is fixed to the 1 day period, so this indicator is suitable for the time frames lower than 1 day, i.e. 4HRTF, 1HRTF or 15MTF.
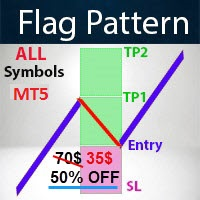
Contact me for instruction, any questions! Introduction A flag can be used as an entry pattern for the continuation of an established trend. The formation usually occurs after a strong trending move. The pattern usually forms at the midpoint of a full swing and shows the start of moving. Bullish flags can form after an uptrend, bearish flags can form after a downtrend.
Flag Pattern Scanner Indicator It is usually difficult for a trader to recognize classic patterns on a chart, as well as sear
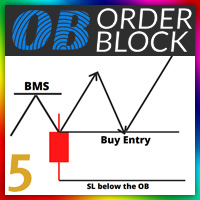
Orde Block Detector: The order block detector can automatically identify the breakthrough of the market structure. After the trend framework breaks through, the order block area can be drawn automatically. In order to draw the OB area more accurately, we also automatically find the candle on the left and right sides of the original candle according to its trading principle, and draw a more accurate ob area through more subtle quantitative rule judgment. Futures : 1. Customize the BMS color, a
MetaTrader Market - les robots de trading et les indicateurs techniques pour les traders sont disponibles directement dans votre terminal de trading.
Le système de paiement MQL5.community est disponible pour tous les utilisateurs enregistrés du site MQL5.com pour les transactions sur les Services MetaTrader. Vous pouvez déposer et retirer de l'argent en utilisant WebMoney, PayPal ou une carte bancaire.
Vous manquez des opportunités de trading :
- Applications de trading gratuites
- Plus de 8 000 signaux à copier
- Actualités économiques pour explorer les marchés financiers
Inscription
Se connecter
Si vous n'avez pas de compte, veuillez vous inscrire
Autorisez l'utilisation de cookies pour vous connecter au site Web MQL5.com.
Veuillez activer les paramètres nécessaires dans votre navigateur, sinon vous ne pourrez pas vous connecter.