YouTube'dan Mağaza ile ilgili eğitici videoları izleyin
Bir alım-satım robotu veya gösterge nasıl satın alınır?
Uzman Danışmanınızı
sanal sunucuda çalıştırın
sanal sunucuda çalıştırın
Satın almadan önce göstergeyi/alım-satım robotunu test edin
Mağazada kazanç sağlamak ister misiniz?
Satış için bir ürün nasıl sunulur?
MetaTrader 5 için teknik göstergeler - 60
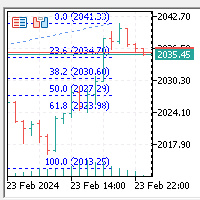
This indicator automatically generates Fibonacci regression lines in the K-line window: 0.0%, 23.6%, 38.2%, 50.0%, 61.8%, and 100.0%, following the displayed price. Zoom In, Zoom Out, Time Frame (M1, M5, M15, M30, H1, H4, D1, W1, MN) can automatically update and generate when the cycle changes, with the highest price worn up and the lowest level broken down. Both upward and downward trends can automatically adjust the direction of the Fibonacci regression line.

Kritik Bölgeler özellikle daha doğru piyasa girişleri arayan manuel yatırımcılar için oluşturulmuştur. Bu gösterge, grafikteki en ilgili destek ve direncin yanı sıra bunların kırılma ve yeniden testlerini hesaplayarak ilgi alanlarını tespit etmek için gelişmiş algoritmalar kullanır. Bu gösterge, potansiyel olarak kazançlı alım / satım fırsatları tespit edildiğinde uyarılar ve bildirimler gönderecek şekilde yapılandırılabilir ve yatırımcıların ekranlarının / MT4 sürümlerinin önünde olmadık

Candlesize Histogram is an indicator for monitoring candlestick sizes. This indicator is based on the high and low of a candle, also adopting the use of a histogram to easily determine the length of each candlestick bar. We can determine if the market is gaining momentum using this indicator. The histogram is calculated based on the size of the bars.
Key benefits
- Easily get the length of every candlestick
- Determine market condition if trending or not trending using the Candl
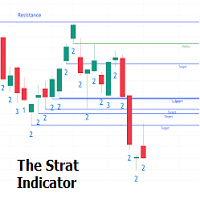
The Strat indicator is a full toolkit regarding most of the concepts within "The Strat" methodology with features such as candle numbering, pivot machine gun (PMG) highlighting, custom combo highlighting, and various statistics included.
Alerts are also included for the detection of specific candle numbers, custom combos, and PMGs.
SETTINGS
Show Numbers on Chart: Shows candle numbering on the chart.
Style Candles: Style candles based on the detected number. Only effective on no

Gösterge "Destek" ve "Direnç" çizgilerini gösterir (bu çizgiler DRAW_LINE çizim stili kullanılarak çizilmiştir - yani bunlar grafik nesneleri değildir). "Sinyal çubuğunun" solunda ve sağında yeni minimum ve maksimumlar için bir arama gerçekleştirilir - "sinyal çubuğu" her yeni yapının geleneksel ortasıdır. Göstergenin adında neden Esnek kelimesi geçiyor? Çünkü "sinyal çubuğunun" solunda ('Sol Çubuklar') ve sağında ('Sağ Çubuklar') farklı sayıda çubuk belirtme olanağımız var. Gösterge çizgi

Gerçek Zamanlı Çok Para Birimli Volatilite Tarayıcı Merhaba, traderlar. Sizlere eşsiz bir çözüm sunuyorum: Gerçek Zamanlı Çok Para Birimli Volatilite Tarayıcısı. Bu gösterge, birçok yıl boyunca kişisel piyasa gözlemlerimin bir sonucudur. Traderların karşılaştığı çeşitli temel sorunları ele alır: Gerçek Zamanlı Volatilite Takibi: Anlamlı hareketlerin nerede gerçekleştiğini görmek için sürekli olarak güncelleme yapma veya grafikleri değiştirme ihtiyacını ortadan kaldırır. Uluslararası Korelasyo

To get access to MT4 version please click here . This is the exact conversion from TradingView: "Schaff Trend Cycle" by "everget". This is a light-load processing indicator. This is a non-repaint indicator. Buffers are available for processing in EAs. All input fields are available except fillings(due to graphical aesthetics). You can message in private chat for further changes you need. Thanks for downloading

Gösterge yükseliş ve düşüş eğilimi gösteriyor. Göstergenin kendisi (normal stokastik gibi) bir alt pencerede görüntülenir. Grafik arayüzü : Ana pencerede, "Düşük" fiyattan "Düşük" fiyata (yükseliş farklılığı için) ve "Yüksek" fiyattan "Yüksek" fiyata (düşüş eğilimi sapması için) kadar üretilen "trend çizgisi" grafik nesneleri oluşturulur. ). Gösterge, penceresinde yalnızca grafik tamponlarını kullanarak çizer: “Ana”, “Sinyal”, “Nokta”, “Al” ve “Satış”. "Al" ve "Satış" tamponları farklılık gös

Pips Hunter PRO birkaç yıl içinde geliştirilmiştir ve selefinin geliştirilmiş bir versiyonudur. Bu güçlü gösterge, alım ve satım girişleri oluşturmak için piyasa ve fiyat geçmişini analiz eder. Bu girişlerin hesaplanması için, birlikte çalışan farklı göstergelerin yanı sıra daha az uygun girişleri filtreleyen ve bunları ortadan kaldıran karmaşık bir istatistiksel logaritma kullanır / MT4 sürümü . Stratejinin yüksek düzeyde verimliliğini sürdürmek için sürekli arama nedeniyle fiyat, 1000$ 'a
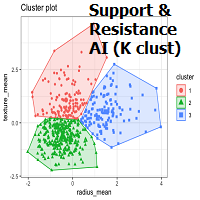
OVERVIEW
K-means is a clustering algorithm commonly used in machine learning to group data points into distinct clusters based on their similarities. While K-means is not typically used directly for identifying support and resistance levels in financial markets, it can serve as a tool in a broader analysis approach.
Support and resistance levels are price levels in financial markets where the price tends to react or reverse. Support is a level where the price tends to stop falling
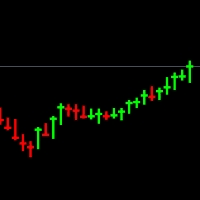
Not - mevcut grafik türünüzü gizlemeniz gerekir, bunu grafiğin renklerini değiştirerek yapabilirsiniz, nasıl yapılacağını bilmiyorsanız bu videoya göz atın - https://youtu.be/-4H6Z5Z4fKo veya priceaction9@outlook.com adresinden benimle iletişime geçin.
Bu, grafiğinizin yerine gösterilecek bir grafik türüdür ve yalnızca Yüksek, düşük ve yakını gösterir ve kalın fitillere sahiptir. Her bir mumdaki açık fiyatların yarattığı gürültüyü azaltarak her bir mumu daha iyi anlamanıza yardımcı olur.
Ö

This indicator, named Edyx_Candle_Size, is designed to be used with the MetaTrader 5 trading platform. It displays the size of the candlestick body for the current timeframe as a histogram. The indicator does not provide any specific trading signals or recommendations
Measures the size of of the candlestick. That is the difference between the open and close as the case may be for either a bullish or a bearish candle. This can be use to filter out entry position as to maximise profit and minimi

Order Blocks are supply or demand zones in which big traders can find the comfort of placing large buy and sell orders and completing a big, very big transaction. Order blocks are a unique trading strategy that helps traders find a direction in the market. Usually, it allows traders to find out what financial institutions are planning to do in a particular market and better indicate the next price movement.

Ticaretinizi bir sonraki seviyeye taşımaya hazır mısınız? WH Divergence Pro MT5 ile tanışın ,
çeşitli popüler teknik göstergeler arasından seçim yapmanızı sağlayan gelişmiş bir sapma göstergesi.
Artık sapma sinyallerinizi benzersiz ticaret stratejinize uyacak şekilde uyarlayabilirsiniz. Süreçler boyunca size rehberlik etmek için satın aldıktan sonra benimle iletişime geçin Ana Özellikler :
Gösterge Seçimi : Aşağıdaki seçenekler arasından tercih ettiğiniz göstergeyi seçin: RSI (G

Combination of Ichimoku and Super Trend indicators, with Signals and live notifications on Mobile App and Meta Trader Terminal. Features: Display five reliable signals of ARC Ichimoku Filter signals by their strength level (strong, neutral, weak) Send live notifications on Mobile App and Meta Trader terminal S ignals remain consistent without repainting Applicable across all time-frames Suitable for all markets Notifications format: "ARC Ichimoku | XAUUSD | BUY at 1849.79 | Tenken-Kijun cross |
Limited time offer, 30 usd only!!!
Discover the unparalleled capabilities of MentFX's structural rules , now optimized for MT5 ! Our state-of-the-art algorithm is engineered to commence calculations from a robust dataset spanning 1500 bars from the current position . This meticulous approach ensures unparalleled accuracy and dependability in your trading endeavors. Experience the seamless integration of MentFX with MT5 , empowering you to analyze markets with precision and confidence. With Me

Kontrol paneli iki göstergenin okumalarını tarar: 'MACD' ve 'Stokastik'. Sinyalleri üç sütunda görüntüler: MACD için, Stokastik için ve sonuç sütunu (sinyal her iki gösterge için de aynıysa). Tarama bir veya daha fazla zaman diliminde seçilebilir. Tüm zaman aralıklarını devre dışı bırakırsanız kontrol paneli yine de yüklenir, ancak bu tür durumlara özel ayarlar bulunur. Sinyaller her zaman göstergenin sıfır çubuğu (sıfır çubuğu grafikte en sağdaki çubuktur) açısından kontrol edilir. Parametreler

The well-known ZigZag indicator that draws rays based on the "significant movement" specified by the pips parameter. If a ray appears, it will not disappear (the indicator is not redrawn), only its extremum will be updated until the opposite ray appears. You also can display text labels on each rays describing the width of the ray in bars and the length of the ray in points.
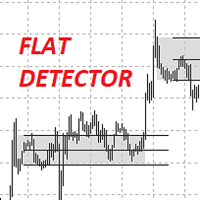
I present to you the IndFlatDetector indicator.
It belongs to the level indicators and shows the Trading Levels. This indicator combines the simplicity of intuitive settings and the accuracy of drawing levels.
Up count - the number of candlesticks up to determine the upper range
Down count - the number of candlesticks down to determine the lower range
Borders on the body or shadow - calculate the range by shadows or by body
Change the borders or not - change the boundaries of the orig

The ZigZag Wave Entry Alert** indicator, created by Azad Gorgis in 2024, is designed for MetaTrader 5 and aims to provide traders with entry signals based on ZigZag patterns. Here's a brief overview of its functionality and key features:
Functionality:
- Detection of ZigZag Patterns: The indicator identifies significant price movements and outlines potential ZigZag patterns on the chart. It detects new highs and lows based on user-defined parameters such as Depth, Deviation, and Backstep. -
The " Session Control " indicator is designed to display trading sessions on a price chart. This allows the trader to see at what points of activity the most important trading sessions occur: Pacific, European, American and Asian. Each of these sessions is characterized by a certain volatility and activity in the market, which is important for making trading decisions.
Peculiarities: Displaying sessions : The indicator shows time periods on the price chart corresponding to different trading s
Bu gösterge sabitlenmiş yarı logaritmik ölçekli bir osilatördür. Logaritmik ölçek, profesyonel veri bilimcileri tarafından, MT5'in fiyat verilerini haritalandırdığı gibi, bir zaman dilimi boyunca toplanan bilgileri daha doğru bir şekilde haritalandırmak için yaygın olarak kullanılır. Aslında bu göstergenin altında yatan mantık yurtdışındaki bir biyoteknoloji bilim adamından serbestçe elde edildi.
Bir log-log grafiği, hem x (yatay) hem de y (dikey) eksenlerinde logaritmik değerleri görüntüler;

Brief Description: A tool to display historical Open, High, Low, and Close (OHLC) price points for various time periods. Gain insights into market behavior with data from yesterday, the day before, the previous week, and the previous month. Recognize liquidity zones effectively. Features: 1. Comprehensive Timeframe Insights: Visualize crucial OHLC points for different timeframes. Historical data for yesterday, day before yesterday, previous week, and previous month. 2. Built on ICT's Teachings:

This indicator informs the user when the ATR is above a certain value defined by the user, as well as when the ATR prints a percentage increase or percentage decrease in its value, in order to offer the user information about the occurrence of spikes or drops in volatility which can be widely used within volatility-based trading systems or, especially, in Recovery Zone or Grid Hedge systems. Furthermore, as the volatility aspect is extremely determining for the success rate of any system based o

Introducing the Consecutive Green/Red Candle Alert Indicator for MT5 - Your Trend Spotting Companion!
Are you ready to take your trading to the next level? We present the Consecutive Green/Red Candle Alert Indicator, a powerful tool designed to help you spot trends and potential reversals with ease. Whether you're a new trader looking for clarity in the market or an experienced pro seeking additional confirmation, this indicator is your trusted companion.
Key Features of the Consecutive Gre

Buy CTS scalping indicator, provide buying and selling signals, automatic channeling and sending signals to mobile phones
Using technical analysis and price action methods and modern methods, CTS indicator can draw price channels and recognize price trends with high accuracy and issue entry and exit signals according to them. Traders can easily fluctuate using this indicator in different time frames and in different markets. With the CTS indicator, you can signal in different ways. This indicat
Buy DEMA 3 Scalp Indicator, Signaling and Trend Finder for Forex DEMA 3 indicator is a professional indicator for finding trends as well as finding entry and exit points for a symbol. This indicator is designed based on the DEMA indicator, which can tell you the signals accurately and quickly. The DEMA 3 indicator can give you accurate and early entry points for swings. Features of the DEMA indicator 3
Receive signals as notifications on the Metatrader mobile application. Receive signals by em
Linear regression AI powered Indicator: Linear regression is a simple yet effective AI technique that is the foundation of complex neural networks, This indicator is built based on linear regression analysis and tries to make predictions on the upcoming event in the market Inputs : train_bars: This controls the number of bars that the price information will be collected and used to train the AI inside it, The greater this value the better also the slower the indicator becomes during initializati

Ünlü Süper Trend göstergesinin tanıtım gerektirmeyen en kaliteli uygulaması. Orijinal algoritmaya tamamen sadıktır ve CCI indikatörü ile güçlendirilmiştir.
- Ticareti kolay - Her türlü uyarıyı uygular. - Çok zaman dilimli bir kontrol paneli uygular. - Yeniden boyanmaz ve arkadan boyanmaz.
Giriş parametreleri - ATR Dönemi - Bu ortalama gerçek aralık dönemidir. - ATR Çarpanı - Trendi tanımlayan ATR çarpanı. - CCI - Trend takibini güçlü kılar. - Maksimum Geçmiş Çubukları - Gösterge grafiğe yükl
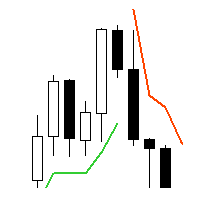
Supertrend - невероятно мощный и универсальный индикатор, предназначенный для помощи трейдерам в определении текущего тренда на конкретном торговом инструменте. С помощью двух встроенных индикаторов, Average True Range и Standard Deviation, трейдеры могут выбрать наиболее подходящий индикатор для своей стратегии торговли. Пользователи также могут настроить период этих индикаторов и выбрать цену (Close, High, Low, Open, Weighted), к которой он должен быть применен, с Typical price в качестве опци

Heikin Ashi Heikin Ashi, gelecekteki fiyat hareketlerini tahmin etmek için kullanılabilecek bir grafik tekniğidir. Geleneksel mum grafiklerine benzer. Bununla birlikte, normal bir mum grafiği aksine, Heikin Ashi grafiği, piyasadaki trend hareketlerini daha iyi tanımlamak için güçlü fiyat dalgalanmalarını yumuşatarak piyasa gürültüsünün bir kısmını filtrelemeye çalışır. Heiken Ashi'yi oluşturmak için, fiyat verilerinin girildiği bir formül kullanılırken, sıradan mumlar herhangi bir hesaplama kull

Çalışma prensiplerinizi alt üst edecek bir buluş.
Özellikle yatay ve durgun piyasalarda can sıkıcı kayıplar yaşanabiliyor.
Ayrıca trend çizgilerini, destek ve dirençleri takip etmek yorucu olabilir.
Tüm bunlara son vermek için profesyonel bir "hareketli ortalama" göstergesi oluşturmaya karar verdim.
Tek yapmanız gereken renkleri takip etmek.
Ek desteğe ihtiyacınız varsa profilimdeki "Heiken-Ashi" mum göstergesini öneririm.
bol kazançlar dilerim..

Description: Dimatis Watchtower is a powerful backtesting tool designed for traders seeking for an efficient way to test and optimize their trading strategies on the MetaTrader 5 platform. With a minimalist interface and advanced features, this tool provides an outstanding solution for evaluating the performance of your strategies in various market conditions. Key Features: Backtesting: Perform precise and reliable backtests of your strategies using historical data from your broker directly on M

Supertrend, Ortalama Gerçek Aralık 'a (ATR) dayanan trendi takip eden bir göstergedir. Tek çizgisinin hesaplanması, eğilim algılama ve volatiliteyi birleştirir. Trend yönündeki değişiklikleri tespit etmek ve durakları konumlandırmak için kullanılabilir.
Temel bilgiler Supertrend trendi takip eden bir göstergedir. Ana grafikte yer kaplar ve çizimleri mevcut eğilimi gösterir. Bir Supertrend, değişen sürelerde (günlük, haftalık, gün içi vb.) ve değişen araçlarda (hisse senetleri, vadeli işlemle

Certainly! Let’s discuss the RSI Rush , an aggressive momentum indicator that combines weighted moving averages (WMAs) at lows, mid-price, and tight highs. Here are the key components: Weighted Moving Averages (WMAs) : The RSI Rush employs three WMAs: WMA at Lows : Calculated based on the lowest prices during a specific period. WMA at Mid-Price : Considers the average price (midway between highs and lows) during the same period. WMA at Tight Highs : Based on the highest prices during the speci
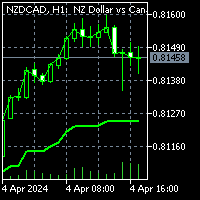
To get access to MT4 version please click here . This is the exact conversion from TradingView: "G-Channel Trend Detection" by "jaggedsoft". This is a light-load processing and non-repaint indicator. You can message in private chat for further changes you need. All input options are available. Buffers are available for processing within EAs. Highlight option is omitted as does not show good in Metatrader.

Breakouts with strong momentum are challenging to catch. The purpose of the Super Breakouts Monitor is to identify such market conditions. This indicator is inspired by a concept from renowned Technical Analyst Tushar Chande, who combines two highly adaptive indicators, VIDYA and the Dynamic Momentum Index (both his creations), to capture the early stages of a successful breakout. At Minions Labs, we've added our unique enhancements to adapt these great ideas for modern markets like stocks, cryp

Moving Average Scanner, grafiği değiştirmeden, birkaç zaman dilimindeki trendi bir bakışta görmek için mükemmel, çok zaman dilimli bir tarayıcıdır.
9 zaman birimi üzerinden seçtiğiniz 4'e kadar hareketli ortalamayı kullanabilir. Tamamen yapılandırılabilir ve basitçe "sürükle ve bırak" yöntemiyle grafik üzerinde herhangi bir yere taşınabilir.
Hareketli ortalamalar 4 farklı hesaplama yöntemiyle yapılandırılabilir. Ayrıca hareketli ortalamaların sayısına ve dönem sayısına göre uyarılar da aya
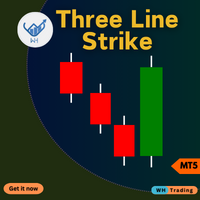
MetaTrader 5 (MT5) için ThreeLine Strike Göstergesi . Bu gelişmiş araç, piyasadaki potansiyel dönüşleri hassas ve kolay bir şekilde belirlemenize yardımcı olmak için tasarlanmıştır.
İster yeni başlayan ister deneyimli bir yatırımcı olun, bu gösterge alım satım kararlarınızı geliştirebilir ve karınızı en üst düzeye çıkarabilir. Contact me after purchase for guidance Ana Özellikler: Doğru Ters Dönüş Sinyalleri : Teknik analizde kanıtlanmış bir mum çubuğu oluşumu olan üç hatlı vuruş modelin

I'm excited to introduce you to the fifth bar on Martin Armstrong's Forecast Array - The Trading Cycle .
This innovative tool represents a transverse form of cyclical frequency analysis, offering a unique perspective on market trends.
The model employs a color-coded system for easy interpretation. In this model, green signals the ideal timing for highs, red indicates ideal lows, and yellow signifies a convergence of highs and lows occurring simultaneously. This intuitive approach allows

Subscribe to the MA7 Trading channel to receive notifications about new programs, updates and other information. Ask questions in the profile on the MQL5 .
Description of work The MA7 Clover indicator is based on candle shapes. Shows the "Pin Bar" candle pattern. Detailed information about the MA7 Clover indicator.
Indicator settings General settings: Min body size ; Max body size ; Min nose size ; Max nose size ; Minimum pattern size ; Maximum pattern size ; Analysis of the candle directio
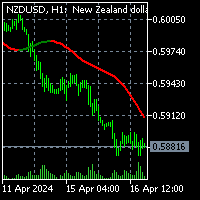
To download MT4 version please click here. - This is the exact conversion from TradingView: "Sentiment Range Ma" By "ChartPrime". - This is a non-repaint and light processing load indicator - You can message in private chat for further changes you need. - All input options are available. - Buffers are available for processing within EAs. - Highlight option is omitted as does not show good in Metatrader.

To download MT4 version please click here .
- This is the exact conversion from TradingView: " PA-Adaptive Hull Parabolic " By "Loxx".
- This is a non-repaint and light processing load indicator
- You can message in private chat for further changes you need.
- All input options are available.
- Buffers are available for processing within EAs.
- Highlight option is omitted as does not show good in Metatrader.

This DYJ PowerSignalSource is a complete trading system based on ATR technical indicators. This indicator will analyze and record the trend intensity of each cycle and current currency pair from M1-MN
DYJ PowerSignalSource creates a trend intensity and entry point signal list display by evaluating this data. When the trend percentage reaches 75% or greater, we consider it a strong currency. If the trend intensity percentage reaches 100%, we consider it the strongest, and a warning will pop up
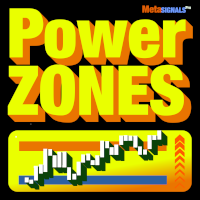
Fiyatı mıknatıslayacak 3,4 veya 5 kez dokunulan stratejik Bölgeyi anında alın | PowerZONES'a göre TP1/TP2/TP3'ü otomatik olarak puan veya değer olarak alın | Risk/Ödül oranınızın güvenliğini görsel olarak kontrol edin Sınırlı süreli teklif - sonra 99$ | Satın aldıktan sonra, kişiselleştirilmiş ayarlar için bu kanaldan benimle iletişime geçin . MT5 - MT4 sürümü | Kârınızı en üst düzeye çıkarmak için 3 adımlı MetaMethod 'umuzu kontrol edin: 1. TrendDECODER 2. PowerZONES 3. Blad
MA Öldürücü Göstergesi, hareketli ortalamaları kullanan yatırımcılar için nihai silahtır. Doğrudan bir yönetim paneli tarafından erişilebilen çeşitli araçları kullanan eksiksiz bir sistemdir. Araçları sayesinde piyasa hakkında genel bir bakışa sahip olursunuz ve bir pozisyona giriş için karar vermede değerli yardıma sahip olursunuz.
Şunlardan oluşur:
- Bir renk kodu kullanarak trendi doğrudan grafik üzerinde görüntüleyen Trend grafiği Ana göstergesi. Bu eğilim, iki hareketli ortalama ve bi
RSI Pro Analyser Göstergesi, aynı anda birden fazla zaman diliminde bilinçli kararlar vermek isteyen yatırımcılar için tasarlanmış güçlü bir araçtır. Bu gösterge aşırı alım, aşırı satış ve trend sinyalleri sağlamak için RSI'yı kullanarak piyasaya giriş fırsatlarını tanımlamayı kolaylaştırır . Farklı piyasa koşullarını gösteren açık ve belirgin renk kodları sayesinde okuma kolaylığı sağlaması en büyük avantajıdır.
Gösterge, RSI değerlerini ve ilgili sinyalleri beş farklı zaman diliminde (D,H4,
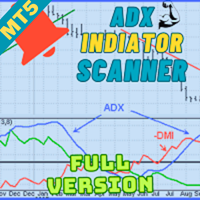
Welcome to advanced trading with the ADX Multicurrency Scanner for MT5! Elevate your trading experience with our powerful MT5 indicator, meticulously designed to offer seamless currency scanning and real-time insights. Key Features: Effortless Multicurrency Scanning: Unlock the full potential of the ADX Multicurrency Scanner for MT5 by effortlessly scanning multiple currencies. Receive instant alerts when specific conditions are met, ensuring you stay ahead of the market and capitalize on every
The DYJ StochasticSignalSource is displayed as two lines. The main line is called %K. The second line, called %D, is a Moving Average of %K. The %K line is usually displayed as a solid line and the %D line is usually displayed as a dotted line. There are several ways to interpret a Stochastic Oscillator. four popular methods include: Buy when the Oscillator (either %K or %D) falls below a specific level (for example, 20) . Sell when the Oscillator rises above a specific level (for example, 80)
Welcome to the world of advanced trading with the MACD Multicurrency Scanner for MT5! Elevate your trading experience with our powerful MT5 indicator meticulously designed for seamless analysis and real-time insights. Key Features: Effortless MACD Scanning: Unlock the full potential of the MACD Multicurrency Scanner for MT5 by effortlessly scanning multiple currency pairs. Receive instant alerts when specific Moving Average Convergence Divergence (MACD) conditions are met, ensuring you stay ahea

This indicator obeys the popular maxim that: "THE TREND IS YOUR FRIEND" It paints a Blue line for BUY and also paints a RED line for SELL. (you can change the colors). It gives alarms and alerts of all kinds. IT DOES NOT REPAINT COLOR and can be used for all currency pairs and timeframes. Yes, as easy and simple as that. Even a newbie can use it to make great and reliable trades. https://www.mql5.com/en/market/product/115553

Welcome to the future of trading! Are you ready to elevate your trading game to new heights? Introducing a groundbreaking trading indicator that is set to redefine the way you approach the markets. With its unparalleled features and cutting-edge technology, this indicator is not just another tool in your arsenal – it's your secret weapon for success. Imagine having access to real-time alerts that keep you ahead of the curve, ensuring you never miss a lucrative opportunity. Picture a tool that

QuantAlgo Signal is one of our best Premium Indicators.
It was designed with an intention of giving traders clear and precise entry signals.
It's main strength is in the possibility of simulating the trades and giving you realistic results.
With this features it is incredibly simple to find the settings you like the best!
QuantAlgo Signal is very simple to use, therefore it is suitable for both beginning and experienced traders.
Features: Precise Entries Backtesting simulation

buy sell stars is a no repaint ,all pairs and all time frames indicator. first set control periot 500 to see signals. it need minimum 500 bars on charts. concept of indicator is wery easy. if white point on the red histogram that means sell . if white point on blue histogram that means buy.. indicator is no repaints.but some times makes drawdown. so case it need to look one upper time frame. indicator is not guarantie the win..

MOST is applied on this RSI moving average with an extra default option added VAR/VIDYA (Variable Index Dynamic Moving Average)
MOST added on RSI has a Moving Average of RSI and a trailing percent stop level of the Moving Average that can be adjusted by changing the length of the MA and %percent of the stop level.
BUY SIGNAL when the Moving Average Line crosses above the MOST Line
LONG CONDITION when the Moving Average is above the MOST
SELL SIGNAL when Moving Average Line crosses belo

Trend based on Extremum Levels and Volatility göstergesi, yatırımcıların trend kırılma noktalarını ve farklı zaman dilimlerinde potansiyel kar alma seviyelerini belirlemelerine yardımcı olmak için tasarlanmış kullanışlı bir araçtır.
Gösterge forex, vadeli işlemler, hisse senetleri, endeksler, emtialar ve kripto para piyasalarında kullanılabilir.
Bu evrensel gösterge yerel ekstrema, volatilite ve ortalama fiyat sapmasına dayalı trendler oluşturarak hem küçük hem de büyük zaman dilimlerinde k

ATR Bantları Uyarısı, kanal genişliğinin sabit bir çarpan ("Çarpan") ve "Ortalama Gerçek Aralık" göstergesinin değeri olarak hesaplandığı bir kanal göstergesidir. Bollinger Bantlarından farklı olarak bant genişliği çok sık değişmez; ATR Bant Uyarısı göstergesinde bantlar genellikle uzun düz çizgilere sahiptir.
ATR Bantları Uyarısının yorumlanması, fiyatın çoğu zaman bantların içinde olduğu gerçeğine dayanmaktadır ve fiyatın sınırlardan birine ulaşması bir trend değişikliğine işaret edebilir.
DYJ SignalSourceOfRSI is a momentum oscillator which shows price strength by comparing upward movements of Close prices to their downward movements over a selected number of periods. There are two kinds of signals provided by RSI: RSI reaching of either overbought or oversold level and then making a bit of reversal: Signals to buy are generated falling of RSI below level(30) and Signals to sell are generated rising of RSI above level(70) Falling of RSI below level(30) and then rising above level

Do you want to know how an economic event will impact price? What will happen to price after the news? How has an economic news affected price in the past? This indicator can help you with that.
Do you like technical analysis? Do you enjoy studying the tick history to predict the future? But what do you think could be more important than technical analysis, what could improve technical analysis? Of course, it's fundamental analysis! After all, economic events directly impact the market, and t
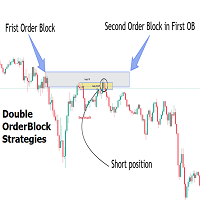
Introduction
The Price Action, styled as the "Smart Money Concept" or "SMC," was introduced by Mr. David J. Crouch in 2000 and is one of the most modern technical styles in the financial world. In financial markets, Smart Money refers to capital controlled by major market players (central banks, funds, etc.), and these traders can accurately predict market trends and achieve the highest profits.
In the "Smart Money" style, various types of "order blocks" can be traded. This indicator
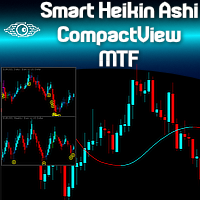
Are you already a fan of the Minions Labs Smart Heikin Ashi chart analysis tool? Or perhaps you're looking for a versatile Heikin Ashi chart capable of operating across multiple timeframes? Want to see the bigger picture before diving into the details, to make smarter ENTRY decisions? Do you want to build your own Dashboard of Symbols in just one chart, without dealing with messy multi-window MT5 stuff? Welcome to the Minions Labs Smart Heikin Ashi CompactView MTF indicator! Please see the power

Introduction
"Smart money" is money invested by knowledgeable individuals at the right time, and this investment can yield the highest returns.
The concept we focus on in this indicator is whether the market is in an uptrend or downtrend. The market briefly takes a weak and reversal trend with "Minor BoS" without being able to break the major pivot.
In the next step, it returns to its main trend with a strong bullish move and continues its trend with a "Major BoS". The "order bloc

Introduction
The "Smart Money Concept" transcends mere technical trading strategies; it embodies a comprehensive philosophy elucidating market dynamics. Central to this concept is the acknowledgment that influential market participants manipulate price actions, presenting challenges for retail traders.
As a "retail trader", aligning your strategy with the behavior of "Smart Money," primarily market makers, is paramount. Understanding their trading patterns, which revolve around supply
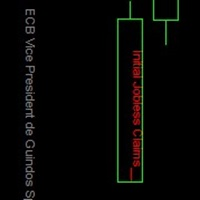
This is one of the most powerful indicators I've ever made.
I was tired of looking at other windows/websites for economical news, and regularly something would happen without me realising.
So I made this indicator which displays all news at the exact time of arrival, directly on the charts!
Now you too can just focus on the charts and know that you won't miss any news events.
There are options:
1. You can choose to display on the price line, or at the bottom of the chart. 2. You can
This is one of my most important indicators. Did you ever miss the session open/close? I did, which is why I made this indicator. It took a long time to get this right, since depending on your platform and timezone, it can be incorrect. It should be accurate for everyone now. It takes into account Daylight savings for NY and EU timezones, and should just work like magic on your charts.
The Boom300 Spike Indicator is a powerful tool designed to identify significant price spikes in the market.
Key Features: Real-time Spike Detection: The indicator continuously scans the market for sudden spikes in price action, providing timely alerts when significant spikes occur. And recommend to use the 1Min chart Customizable Alerts: Traders can customize alerts to suit their preferences, including audible alerts, email notifications, and push notifications to mobile devices. User-Friend

Description: The Spike Sniper Crash Market Indicator is a sophisticated tool designed to identify and navigate volatile market conditions, often associated with sudden price spikes and market crashes. Leveraging advanced algorithms and technical analysis, this indicator serves as a vigilant guardian, alerting traders to potential market disruptions and providing actionable insights to mitigate risks and capitalize on opportunities. Key Features: Precision Spike Detection: The indicator employs c

The indicator determines the ATR value (points) in a classic way (taking into calculation paranormal bars/candles) and more correctly - ignoring paranormal movements of the Instrument. Correctly it is excluding paranormal bars from the calculation, extremely small bars (less than 5%( customizable ) of the standard ATR) and extremely large bars (more than 150% ( customizable ) of the standard ATR) are ignored. This is a Extended version - allows you to set calculation parameters a
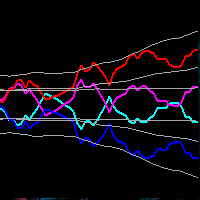
This indicator obeys the popular maxim that: "THE TREND IS YOUR FRIEND" Channel indicators incorporate volatility to capture price action. The Bollinger Bands is widely used, however, there are other options to capture swing action opportunities. Each study you will find here is unique, and reveals different types of price action.
https://www.mql5.com/en/market/product/116256
https://www.mql5.com/en/market/product/115553

This is the MT5 version of Ku-Chart.
This is an indicator devised by Ku-chan, a famous Japanese trader, based on the dealings of Lehman Brothers' discretionary traders. Unify the measuring stick of currencies to display the true value of currencies.
Although it is an indicator, it does not use a buffer and is displayed using objects such as trend lines. Also, instead of drawing on the subchart, it is drawn in an area far above the current price of the main chart, so you can switch from the
MetaTrader mağazası, geliştiricilerin alım-satım uygulamalarını satabilecekleri basit ve kullanışlı bir sitedir.
Ürününüzü yayınlamanıza yardımcı olacağız ve size Mağaza için ürününüzün açıklamasını nasıl hazırlayacağınızı anlatacağız. Mağazadaki tüm uygulamalar şifreleme korumalıdır ve yalnızca alıcının bilgisayarında çalıştırılabilir. İllegal kopyalama yapılamaz.
Alım-satım fırsatlarını kaçırıyorsunuz:
- Ücretsiz alım-satım uygulamaları
- İşlem kopyalama için 8.000'den fazla sinyal
- Finansal piyasaları keşfetmek için ekonomik haberler
Kayıt
Giriş yap
Gizlilik ve Veri Koruma Politikasını ve MQL5.com Kullanım Şartlarını kabul edersiniz
Hesabınız yoksa, lütfen kaydolun
MQL5.com web sitesine giriş yapmak için çerezlerin kullanımına izin vermelisiniz.
Lütfen tarayıcınızda gerekli ayarı etkinleştirin, aksi takdirde giriş yapamazsınız.