YouTubeにあるマーケットチュートリアルビデオをご覧ください
ロボットや指標を購入する
仮想ホスティングで
EAを実行
EAを実行
ロボットや指標を購入前にテストする
マーケットで収入を得る
販売のためにプロダクトをプレゼンテーションする方法
MetaTrader 5のためのテクニカル指標 - 60
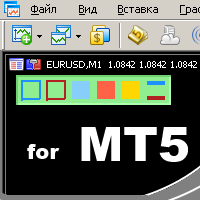
удобный инструмент для тех, кто использует технический анализ с использованием таких инструментов, как Трендовая линия и Прямоугольник. Имеется возможность настройки двух пустых прямоугольников, трех закрашенных и двух трендовых линий. Настройки индикатора крайне просты и делятся на пронумерованные блоки: С цифрами 1 и 2 вначале - настройки пустых прямоугольников (рамок); С цифрами 3, 4 и 5 - настройки закрашенных прямоугольников; С цифрами 6 и 7 - настройки трендовых линий. Объекты создаются оч

To get access to MT4 version please click here . This is the exact conversion from TradingView: " WaveTrend" by LazyBear.
This is a light-load processing and non-repaint indicator. All input options are available. Buffers are available for processing in EAs. You can message in private chat for further changes you need. The filling area option is omitted to fit into MT5 graphics.

ボリンジャー バンド ダッシュボード インジケーターは、1 つのパネル (ダッシュボード) を使用して、さまざまな時間枠でボリンジャー バンド インジケーター シグナルを追跡する便利で有益な方法を提供します。このツールを使用すると、トレーダーは必要な情報を迅速かつ簡単に入手でき、市場での効率的な意思決定が可能になります。
主な特徴:
1. **シグナルパネル**: ダッシュボードには、選択した時間枠のボリンジャーバンドシグナルが表示され、明確で構造化された情報がユーザーに提供されます。 2. **時間枠設定の柔軟性**: ユーザーのニーズに応じて、任意の時間枠を有効または無効にする機能。これにより、特定の取引戦略の最も重要な時間間隔に集中することができます。すべてのタイム フレームがオフになっている場合、インジケーターには 3 つのハードコーディングされたタイム フレームが表示されます。これは、継続的な信号送信を保証するために行われます。 3. **カラー設定**: このツールは、さまざまなパネル要素に対して高度なカラー設定を提供します。 - ダッシュボードの背景 - テーブ
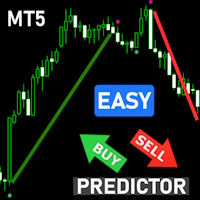
Overview: Elevate your trading strategy with the Advanced SuperTrend Buy Sell Signals Indicator! Designed for both novice and professional traders, this indicator provides clear and accurate buy/sell signals based on the popular SuperTrend algorithm, enhanced with customizable parameters and visual alerts. Features: Clear Trend Visualization: Identifies UpTrends (green line) and DownTrends (red line) with precision. Customizable Parameters: Adjust ATR period and multiplier to fit your trading s

Key Features: Pattern Recognition : Identifies Fair Value Gaps (FVGs) Spots Break of Structure (BOS) points Detects Change of Character (CHoCH) patterns Versatile Application : Optimized for candlestick charts Compatible with any chart type and financial instrument Real-Time and Historical Analysis : Works seamlessly with both real-time and historical data Allows for backtesting strategies and live market analysis Visual Representation : Draws rectangles to highlight significant areas on the cha

Blue and red support and resistance levels displayed directly on the chart. Alerts for close above resistance and close below support. Defaults:
EnableNativeAlerts = false; EnableEmailAlerts = false; EnablePushAlerts = false;
Really easy to trade with. There's no place like SR trading!
Disclaimer:
Support occurs where a downtrend is expected to pause due to a concentration of demand. Resistance occurs where an uptrend is expected to pause temporarily, due to a concentration of supply

Trend change > Arrows (' Up ' and ' Down ') When the icon appears in the indicator buffer ('Up' or 'Down'), Alerts are triggered. You can use 200 EMA to reduce false signals.
Enter trade when the arrow appears but wait until the candle closes Close trade when the line's color changes or use your own closing strategy. Works on all timeframes Works on all currencies Note
works better with other indicators or an existing strategy

SMT (Smart Money Technique) Divergence refers to the price divergence between correlated assets or their relationship to inversely correlated assets. By analyzing SMT Divergence, traders can gain insights into the market's institutional structure and identify whether smart money is accumulating or distributing assets. Every price fluctuation should be confirmed by market symmetry, and any price asymmetry indicates an SMT Divergence, suggesting a potential trend reversal. MT4 Version - https:/
the Spike detector show multiple indication for entries, for max profits enter on each indication given u can also add on lots size as entries go to secure max profits before spike occure, the more entries you enter along the way ,the more profits u have after the initial spike, after spike hold 3-5 candles before close for max profits . good on al timeframes max stop loss is 22candles.

ObieTrader is a short term signals indicator. It is used for intraday trading. ObieTrader identifies the short term trend using Williams percent R indicator and average true range. When a short term trend is confirmed by the indicator, it plots semaphores on the bar to show the trend. Bars with red dots indicate downtrend and bars with blue dots indicate uptrend.
When a trend is identified, open positions in the direction of the trend. When red circles appear open short position. When blue c

RSI Divergence Signal
The RSI Divergence Signal is a technical analysis tool used in financial markets to identify potential trend reversals. It compares the Relative Strength Index (RSI) with price action to detect divergences. When the RSI moves in the opposite direction of the price, it signals a potential change in momentum, suggesting that the current trend may be weakening. This divergence can indicate a buying opportunity in a downtrend or a selling opportunity in an uptrend. Traders

The indicator is based on the relationship between two sets of Stochastic lines. The first set consists of 6 Stochastic with periods: 5, 8, 10, 12, 14, 16. The second set consists of 6 Stochastic with periods: 34, 39, 44, 50, 55, 60. These periods are customizable. Input parameters Stochastic MA Method Method of calculation ===== Short-term ===== Stochastic #1 %K Period Stochastic #2 %K Period Stochastic #3 %K Period Stochastic #4 %K Period Stochastic #5 %K Period Stochastic #6 %K Period Short

Magnified Price Experience trading like never before with our Magnified Price indicator by BokaroTraderFx, designed exclusively for MetaTrader 5. This revolutionary tool provides traders with instant insights into price movements, offering a clear advantage in today's fast-paced markets.
Key Features: 1. Real-time Precision: Instantly magnify price action to uncover hidden trends and patterns. 2. Enhanced Visibility: Clear visualization of price movements with adjustable zoom levels. 3. Us
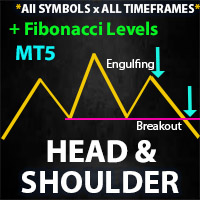
** All Symbols x All Timeframes scan just by pressing scanner button ** *** Contact me after the purchase to send you instructions and add you in "Head & Shoulders Scanner group" for sharing or seeing experiences with other users. Introduction: Head and Shoulders Pattern is a very repetitive common type of price reversal patterns. The pattern appears on all time frames and can be used by all types of traders and investors. The Head and Shoulders Scanner indicator Scans All char

** All Symbols x All Time frames scan just by pressing scanner button ** *** Contact me after the purchase to send you instructions and add you in "Order Block group" for sharing or seeing experiences with other users. Introduction: The central banks and financial institutions mainly drive the market, Order block is considered a market behavior that indicates accumulation of orders from banks and institutions, then the market tends to make a sharp move(Imbalance) on either side once

Market Heartbeat is in your hand! Introduction The Market Heartbeat indicator with a special enhanced algorithm (volume, money flow, cycle of market and a secret value) is a very repetitive trend finder with a high success rate . Interestingly, this Winner indicator indicates that the trend has changed its direction or the end of a trend retracement or even appears at the range market. The Market Heartbeat can use in scalping trading or trend trading. It finds immediately with alarm, n
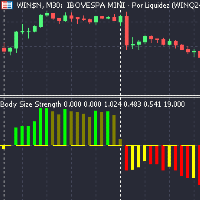
Body Size Strength Indicator Overview The Candle Body Size Strength Indicator provides a comprehensive suite of calculations that analyze daily price movements, delivering actionable insights that can significantly enhance your trading strategies.
Why Choose the Body Size Strength Indicator? Quantitative traders will appreciate the extensive calculations and buffers that this indicator offers. It is designed to integrate seamlessly with algorithmic trading systems, enhancing the precision and
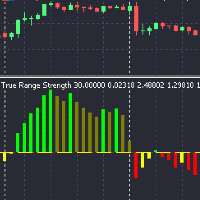
高度なトリガーオプションを備えたトゥルーレンジ強度インジケーター このインジケーターは、日々の価格変動に関連するさまざまな指標を計算および表示します: 指標 トゥルーレンジ (TR): (高値 - 安値, |高値 - 前日終値|, |安値 - 前日終値|) の最大値 TR 変動率 (TR_ROC): 日々の参考価格に対する TR の変動率 ポジティブ TR ROC の日計合計: 1日のポジティブ TR ROC 値の累積 ネガティブ TR ROC の日計合計: 1日のネガティブ TR ROC 値の累積 ポジティブおよびネガティブ TR ROC の日計合計の差: TR ROC の純累積 使用法 インジケーターを別のチャートウィンドウに追加します 入力から希望するプロットタイプ、値タイプ、およびトリガータイプを選択します インジケーターを使用して日々のボラティリティと価格変動の傾向を評価します カラーヒストグラムは純累積トレンドの迅速な視覚的リファレンスを提供します 注: このインジケーターは毎取引日の始めに計算をリセットします
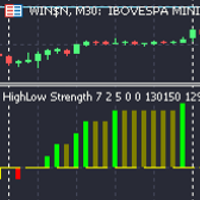
高低強度インジケーター 概要 高低強度インジケーター は、日中の新しい高値と安値がどのくらい頻繁に発生するかを 監視および表示するために設計された強力なツールであり、ピークとトラフとしても知られています。 または、高値と安値の頻度を追跡します。このインジケーターは、市場のトレンドや潜在的な反転を強調し、 市場分析や取引戦略を強化したいと考える投資家、日中のトレーダー、クオンツトレーダーにとって不可欠なツールです。
主な機能 このインジケーターは、「Count New Daily Highs and Lows」と「Count Highs and Lows」の2つの異なる方法で動作します。 「Count New Daily Highs and Lows」モードでは、日中の新しい高値と安値を追跡し、毎日の市場のピークとトラフに関する洞察を提供します。 「Count Highs and Lows」モードでは、現在の期間内の高値と安値をカウントして、即時の価格アクション分析を行います。各モードは、Cumulative Highs、 Cumulative Lows、および High Low
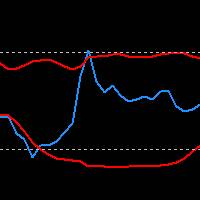
RSI Indicator with Bollinger Bands: Maximize Your Win Rate with Precision and Advanced Trading Strategies Take your trading to the next level with the RSI Indicator combined with Bollinger Bands. Customize the RSI period, band moving average, and deviation to tailor the indicator to your unique strategies. Upon request, we also offer the possibility to customize or create bespoke indicators to best meet your trading needs.
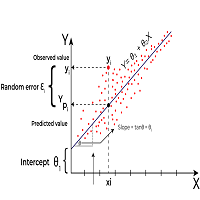
Linear Regression is a statistical method used to model the relationship between two or more variables. The primary goal of Linear Regression is to predict the value of one variable (called the dependent variable or outcome variable) based on the value of one or more other variables (called independent variables or explanatory variables) Linear Regression can be applied to technical analysis, and it is indeed one of the tools used by traders and analysts to make predictions and identify trends i
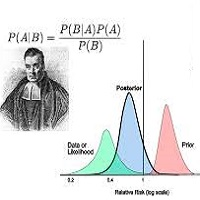
Bayesian methods can be effectively applied to predict price trends in financial markets, including Forex, stocks, and commodities. Here’s how Bayesian techniques can be used for trend prediction: 1. Bayesian Linear Regression Bayesian linear regression can be used to model the relationship between time and price. This method allows for the incorporation of prior beliefs about the trend and updates the trend as new data comes in. Example: Suppose you want to predict the price trend of a currency
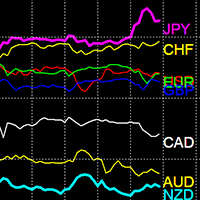
通貨強度インジケーター
通貨強度インジケーターは、トレンドを識別するための強力なツールです。さまざまな通貨の強さと弱さを比較し、トレンドの通貨ペアを簡単に見つけることができます。
セール価格: 49 ドル
機能
強い通貨と弱い通貨を効果的に区別します トレンドの通貨を自動的に識別します マルチタイムフレーム 28 通貨ペアをロードします パフォーマンスが最適化されています
インジケーターの使用法 強い通貨: 80 を超える通貨は強いと見なされます。 弱い通貨: 20 未満の通貨は弱いと見なされます。
例
EUR が 80 を超えて上昇傾向にあり、USD が 20 未満で下降傾向にある場合、EURUSD は上昇傾向にあります。
JPY が 80 を超えて上昇傾向にあり、GBP が 20 未満で下降傾向にある場合、GBPJPY は下降傾向にあります。
インジケーターで通貨が高いほど、強いことを意味します。インジケーター上で通貨が低いほど、その通貨は弱いです。
インジケーターの反対側にある通貨で構成される通貨ペアは、通常、強いトレンドで、しばらく続き

Dominant Candle Finder is a significant candlestick on a price chart that stands out due to its size, volume, or price movement compared to surrounding candles. It often indicates strong buying or selling pressure and can be used to identify potential reversal points, breakouts, or continuations in the market. Dominant candles can serve as key indicators for traders to make informed decisions, providing insights into market sentiment and potential future price movements. MT4 Version - https://w
This indicator will draw lines for previous day Highs and Lows, current day open price and current day price plus and minus ATR. This will provide an overview of the support and resistance for the price movement of the current trading day. The ATR is fixed to the 1 day period, so this indicator is suitable for the time frames lower than 1 day, i.e. 4HRTF, 1HRTF or 15MTF.
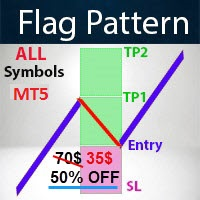
- Real price is 70$ - 50% Discount ( It is 35$ now )
Contact me for instruction, any questions! Introduction A flag can be used as an entry pattern for the continuation of an established trend. The formation usually occurs after a strong trending move. The pattern usually forms at the midpoint of a full swing and shows the start of moving. Bullish flags can form after an uptrend, bearish flags can form after a downtrend.
Flag Pattern Scanner Indicator It is usually difficult for a trade
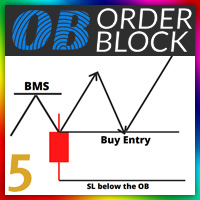
Orde Block Detector: The order block detector can automatically identify the breakthrough of the market structure. After the trend framework breaks through, the order block area can be drawn automatically. In order to draw the OB area more accurately, we also automatically find the candle on the left and right sides of the original candle according to its trading principle, and draw a more accurate ob area through more subtle quantitative rule judgment. Futures : 1. Customize the BMS color, a

RTS5Pattern AVG RTS5Pattern AVG is a revolutionary statistical indicator designed for the MetaTrader 5 platform, bringing an innovative approach to technical analysis and market movement prediction. This indicator combines advanced mathematical methods, including normalization and historical data analysis, with a user-friendly interface and precise trading capabilities. RTS5Pattern AVG is an ideal tool for traders looking to improve their trading strategies and achieve better results. Key Featur

The ICT Propulsion Block indicator is meant to detect and highlight propulsion blocks, which are specific price structures introduced by the Inner Circle Trader (ICT).
Propulsion Blocks are essentially blocks located where prices interact with preceding order blocks. Traders often utilize them when analyzing price movements to identify potential turning points and market behavior or areas of interest in the market.
USAGE (fingure 1) An order block is a significant area on a pric

Here is a version for MetaTrader 5 of the famous Wave Trend indicator. Introducing the Wave Trend Oscillator Indicator for MT5 We are excited to present our Wave Trend Oscillator Indicator, exclusively designed for MetaTrader 5. This advanced tool is a must-have for traders who seek precision and efficiency in their trading journey. Our oscillator is built on the principles of wave trend analysis, capturing the ebb and flow of market trends with unparalleled accuracy. It helps traders identify p
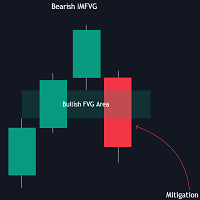
The FVG Instantaneous Mitigation Signals indicator detects and highlights "instantaneously" mitigated fair value gaps (FVG), that is FVGs that get mitigated one bar after their creation, returning signals upon mitigation.
Take profit/stop loss areas, as well as a trailing stop loss are also included to complement the signals.
USAGE Figure 1 Instantaneous Fair Value Gap mitigation is a new concept introduced in this script and refers to the event of price mitigating a fair value gap

Easy Fibonacciは、MT5用のインジケーターで、フィボナッチリトレースメントを簡単にプロットできます。 特徴 インジケーターの設定から最大10個のフィボナッチレベルを設定できます。 各レベルには、異なる線スタイル、線色、線幅、およびその他の設定をカスタマイズできます。 追加ボタン付きのマウスを使用して、VキーとBキーをマッピングし、フィボナッチを便利にプロットできます。 ボタンの操作: BとV:チャートの表示領域にトップ/ボトムのフィボナッチをプロット NとM:次と前のローソク足のスイングエクステンション R:リセット
Easy Fibonacciは、MT5用のインジケーターで、フィボナッチリトレースメントを簡単にプロットできます。 特徴 インジケーターの設定から最大10個のフィボナッチレベルを設定できます。 各レベルには、異なる線スタイル、線色、線幅、およびその他の設定をカスタマイズできます。 追加ボタン付きのマウスを使用して、VキーとBキーをマッピングし、フィボナッチを便利にプロットできます。 ボタンの操作: BとV:チャートの表示領域にトップ/ボトムのフィボナッチ

金融指標 SolarTrade Suite: Earth Market Indicator - 金融市場の世界で信頼できるガイドです!
これは、標準の灰色の日本のローソク足の代わりとなるもので、特別な革新的で高度なアルゴリズムを使用してその価値を計算し、見た目にも美しいデザインになっています。
この指標の読み方を理解するのは非常に簡単です。青色 - 買い、赤色 - 売り。
色が明るいほど、シグナルが強くなります。
説明の下部にある他の SolarTrade Suite 製品をご覧ください。
投資と金融市場の世界を自信を持ってナビゲートしたいですか? SolarTrade Suite 金融指標: Earth Market Indicator は、情報に基づいた投資決定を行い、利益を増やすのに役立つように設計された革新的なソフトウェアです。
SolarTrade Suite: Earth Market Indicator の利点:
- 正確な予測: 当社の指標は、高度なアルゴリズムと分析方法を使用して、市場の動きを正確に予測します。
資産の売買に最適なタイ
MetaTraderマーケットが取引戦略とテクニカル指標を販売するための最適な場所である理由をご存じですか?宣伝もソフトウェア保護も必要なく、支払いのトラブルもないことです。これらはすべて、MetaTraderマーケットで提供されます。
取引の機会を逃しています。
- 無料取引アプリ
- 8千を超えるシグナルをコピー
- 金融ニュースで金融マーケットを探索
新規登録
ログイン