Conheça o Mercado MQL5 no YouTube, assista aos vídeos tutoriais
Como comprar um robô de negociação ou indicador?
Execute seu EA na
hospedagem virtual
hospedagem virtual
Teste indicadores/robôs de negociação antes de comprá-los
Quer ganhar dinheiro no Mercado?
Como apresentar um produto para o consumidor final?
Indicadores Técnicos para MetaTrader 5 - 60
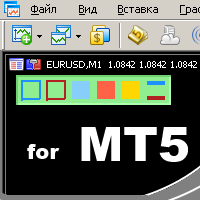
удобный инструмент для тех, кто использует технический анализ с использованием таких инструментов, как Трендовая линия и Прямоугольник. Имеется возможность настройки двух пустых прямоугольников, трех закрашенных и двух трендовых линий. Настройки индикатора крайне просты и делятся на пронумерованные блоки: С цифрами 1 и 2 вначале - настройки пустых прямоугольников (рамок); С цифрами 3, 4 и 5 - настройки закрашенных прямоугольников; С цифрами 6 и 7 - настройки трендовых линий. Объекты создаются оч

To get access to MT4 version please click here . This is the exact conversion from TradingView: " WaveTrend" by LazyBear.
This is a light-load processing and non-repaint indicator. All input options are available. Buffers are available for processing in EAs. You can message in private chat for further changes you need. The filling area option is omitted to fit into MT5 graphics.

O indicador Bollinger Bands Dashboard oferece uma maneira conveniente e informativa de rastrear os sinais do indicador Bollinger Bands em diferentes intervalos de tempo usando um painel (Dashboard). Esta ferramenta permite aos traders obter de forma rápida e fácil as informações de que necessitam, possibilitando uma tomada de decisão eficiente no mercado.
Características principais:
1. **Painel de Sinais**: O Painel exibe sinais das Bandas de Bollinger para intervalos de tempo selecionados,
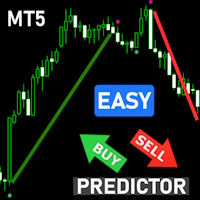
Overview: Elevate your trading strategy with the Advanced SuperTrend Buy Sell Signals Indicator! Designed for both novice and professional traders, this indicator provides clear and accurate buy/sell signals based on the popular SuperTrend algorithm, enhanced with customizable parameters and visual alerts. Features: Clear Trend Visualization: Identifies UpTrends (green line) and DownTrends (red line) with precision. Customizable Parameters: Adjust ATR period and multiplier to fit your trading s

Key Features: Pattern Recognition : Identifies Fair Value Gaps (FVGs) Spots Break of Structure (BOS) points Detects Change of Character (CHoCH) patterns Versatile Application : Optimized for candlestick charts Compatible with any chart type and financial instrument Real-Time and Historical Analysis : Works seamlessly with both real-time and historical data Allows for backtesting strategies and live market analysis Visual Representation : Draws rectangles to highlight significant areas on the cha

Níveis de suporte e resistência azuis e vermelhos exibidos diretamente no gráfico.
Alertas para fechamento acima da resistência e fechamento abaixo do suporte.
Padrões: EnableNativeAlerts = falso;
EnableEmailAlerts = falso;
EnablePushAlerts = falso;
Muito fácil de negociar. Não há lugar como a negociação SR! Isenção de responsabilidade: O suporte ocorre onde se espera que uma tendência de baixa pare devido a uma concentração de demanda. A resistência ocorre onde se espera que uma

Mudança de tendência > Setas ('Para cima' e 'Para baixo')
Quando o ícone aparece no buffer do indicador ('Up' ou 'Down'), os alertas são acionados.
Você pode usar 200 EMA para reduzir sinais falsos.
Entre na negociação quando a seta aparecer, mas espere até a vela fechar
Feche a negociação quando a cor da linha mudar ou use sua própria estratégia de fechamento.
Funciona em todos os prazos
Funciona em todas as moedas
Observação funciona melhor com outros indicadores ou com uma es

SMT (Smart Money Technique) Divergence refers to the price divergence between correlated assets or their relationship to inversely correlated assets. By analyzing SMT Divergence, traders can gain insights into the market's institutional structure and identify whether smart money is accumulating or distributing assets. Every price fluctuation should be confirmed by market symmetry, and any price asymmetry indicates an SMT Divergence, suggesting a potential trend reversal. MT4 Version - https:/
the Spike detector show multiple indication for entries, for max profits enter on each indication given u can also add on lots size as entries go to secure max profits before spike occure, the more entries you enter along the way ,the more profits u have after the initial spike, after spike hold 3-5 candles before close for max profits . good on al timeframes max stop loss is 22candles.

ObieTrader é um indicador de sinais de curto prazo. É usado para negociação intradiária. ObieTrader identifica a tendência de curto prazo usando o indicador percentual R de Williams e a faixa média verdadeira. Quando uma tendência de curto prazo é confirmada pelo indicador, ele traça semáforos na barra para mostrar a tendência. Barras com pontos vermelhos indicam tendência de baixa e barras com pontos azuis indicam tendência de alta.
Quando uma tendência é identificada, abra posições na direç

RSI Divergence Signal
The RSI Divergence Signal is a technical analysis tool used in financial markets to identify potential trend reversals. It compares the Relative Strength Index (RSI) with price action to detect divergences. When the RSI moves in the opposite direction of the price, it signals a potential change in momentum, suggesting that the current trend may be weakening. This divergence can indicate a buying opportunity in a downtrend or a selling opportunity in an uptrend. Traders

The indicator is based on the relationship between two sets of Stochastic lines. The first set consists of 6 Stochastic with periods: 5, 8, 10, 12, 14, 16. The second set consists of 6 Stochastic with periods: 34, 39, 44, 50, 55, 60. These periods are customizable. Input parameters Stochastic MA Method Method of calculation ===== Short-term ===== Stochastic #1 %K Period Stochastic #2 %K Period Stochastic #3 %K Period Stochastic #4 %K Period Stochastic #5 %K Period Stochastic #6 %K Period Short

Magnified Price Experience trading like never before with our Magnified Price indicator by BokaroTraderFx, designed exclusively for MetaTrader 5. This revolutionary tool provides traders with instant insights into price movements, offering a clear advantage in today's fast-paced markets.
Key Features: 1. Real-time Precision: Instantly magnify price action to uncover hidden trends and patterns. 2. Enhanced Visibility: Clear visualization of price movements with adjustable zoom levels. 3. Us
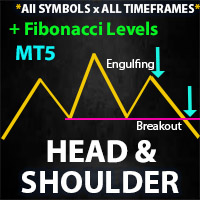
** All Symbols x All Timeframes scan just by pressing scanner button ** *** Contact me after the purchase to send you instructions and add you in "Head & Shoulders Scanner group" for sharing or seeing experiences with other users. Introduction: Head and Shoulders Pattern is a very repetitive common type of price reversal patterns. The pattern appears on all time frames and can be used by all types of traders and investors. The Head and Shoulders Scanner indicator Scans All char

** All Symbols x All Time frames scan just by pressing scanner button ** *** Contact me after the purchase to send you instructions and add you in "Order Block group" for sharing or seeing experiences with other users. Introduction: The central banks and financial institutions mainly drive the market, Order block is considered a market behavior that indicates accumulation of orders from banks and institutions, then the market tends to make a sharp move(Imbalance) on either side once

Market Heartbeat is in your hand! Introduction The Market Heartbeat indicator with a special enhanced algorithm (volume, money flow, cycle of market and a secret value) is a very repetitive trend finder with a high success rate . Interestingly, this Winner indicator indicates that the trend has changed its direction or the end of a trend retracement or even appears at the range market. The Market Heartbeat can use in scalping trading or trend trading. It finds immediately with alarm, n
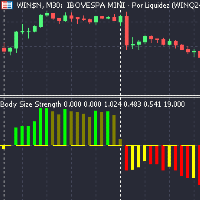
Body Size Strength Indicator Overview The Candle Body Size Strength Indicator provides a comprehensive suite of calculations that analyze daily price movements, delivering actionable insights that can significantly enhance your trading strategies.
Why Choose the Body Size Strength Indicator? Quantitative traders will appreciate the extensive calculations and buffers that this indicator offers. It is designed to integrate seamlessly with algorithmic trading systems, enhancing the precision and
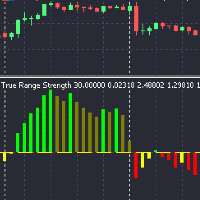
Indicador de Força do True Range com Opções Avançadas de Gatilho Este indicador calcula e exibe várias métricas relacionadas às mudanças diárias de preços: Métricas True Range (TR): O máximo de (Alta - Baixa, |Alta - Fechamento Anterior|, |Baixa - Fechamento Anterior|) Taxa de Mudança do TR (TR_ROC): Mudança percentual do TR em relação ao preço de referência diário Soma Diária de TR ROC Positivo: Acumulação de valores positivos de TR ROC dentro de um dia Soma Diária de TR ROC Negativo: Acumulaçã
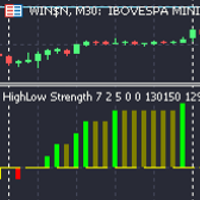
Indicador de Força Máximas e Mínimas Visão Geral O Indicador de Força Máximas e Mínimas é uma ferramenta poderosa projetada para monitorar e mostrar com que frequência novas máximas e mínimas diárias ocorrem durante o dia, também conhecidas como picos e vales, ou para rastrear a frequência de máximas e mínimas. Este indicador destaca as tendências de mercado e possíveis reversões, tornando-se essencial para investidores, traders de curto prazo e traders quantitativos que buscam aprimorar sua aná
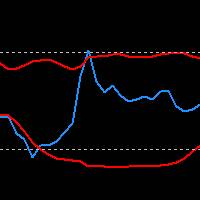
RSI Indicator with Bollinger Bands: Maximize Your Win Rate with Precision and Advanced Trading Strategies Take your trading to the next level with the RSI Indicator combined with Bollinger Bands. Customize the RSI period, band moving average, and deviation to tailor the indicator to your unique strategies. Upon request, we also offer the possibility to customize or create bespoke indicators to best meet your trading needs.
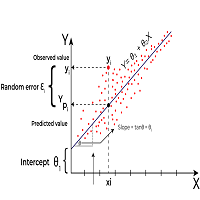
Linear Regression is a statistical method used to model the relationship between two or more variables. The primary goal of Linear Regression is to predict the value of one variable (called the dependent variable or outcome variable) based on the value of one or more other variables (called independent variables or explanatory variables) Linear Regression can be applied to technical analysis, and it is indeed one of the tools used by traders and analysts to make predictions and identify trends i
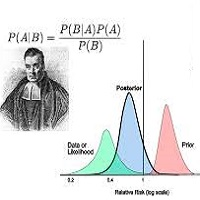
Bayesian methods can be effectively applied to predict price trends in financial markets, including Forex, stocks, and commodities. Here’s how Bayesian techniques can be used for trend prediction: 1. Bayesian Linear Regression Bayesian linear regression can be used to model the relationship between time and price. This method allows for the incorporation of prior beliefs about the trend and updates the trend as new data comes in. Example: Suppose you want to predict the price trend of a currency
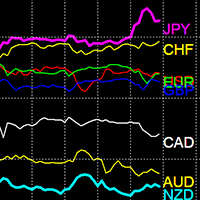
Indicador de força monetária
O Indicador de Força da Moeda é uma ferramenta poderosa para identificar tendências. Compara a força e a fraqueza de diferentes moedas e facilita a localização de pares de moedas em tendência.
Preço de venda: 49$
Funcionalidades
Distingue eficazmente entre moedas fortes e fracas Identifica automaticamente as moedas de tendência Multi-prazo Carrega 28 pares de moedas Desempenho otimizado
Uso do indicador Moedas fortes: As moedas acima de 80 são consideradas

Dominant Candle Finder is a significant candlestick on a price chart that stands out due to its size, volume, or price movement compared to surrounding candles. It often indicates strong buying or selling pressure and can be used to identify potential reversal points, breakouts, or continuations in the market. Dominant candles can serve as key indicators for traders to make informed decisions, providing insights into market sentiment and potential future price movements. MT4 Version - https://w
This indicator will draw lines for previous day Highs and Lows, current day open price and current day price plus and minus ATR. This will provide an overview of the support and resistance for the price movement of the current trading day. The ATR is fixed to the 1 day period, so this indicator is suitable for the time frames lower than 1 day, i.e. 4HRTF, 1HRTF or 15MTF.
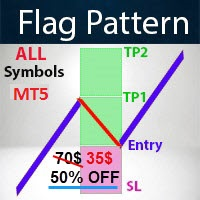
- Real price is 70$ - 50% Discount ( It is 35$ now )
Contact me for instruction, any questions! Introduction A flag can be used as an entry pattern for the continuation of an established trend. The formation usually occurs after a strong trending move. The pattern usually forms at the midpoint of a full swing and shows the start of moving. Bullish flags can form after an uptrend, bearish flags can form after a downtrend.
Flag Pattern Scanner Indicator It is usually difficult for a trade
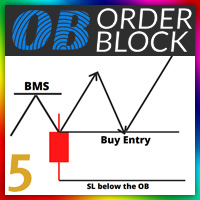
Orde Block Detector: The order block detector can automatically identify the breakthrough of the market structure. After the trend framework breaks through, the order block area can be drawn automatically. In order to draw the OB area more accurately, we also automatically find the candle on the left and right sides of the original candle according to its trading principle, and draw a more accurate ob area through more subtle quantitative rule judgment. Futures : 1. Customize the BMS color, a

RTS5Pattern AVG RTS5Pattern AVG is a revolutionary statistical indicator designed for the MetaTrader 5 platform, bringing an innovative approach to technical analysis and market movement prediction. This indicator combines advanced mathematical methods, including normalization and historical data analysis, with a user-friendly interface and precise trading capabilities. RTS5Pattern AVG is an ideal tool for traders looking to improve their trading strategies and achieve better results. Key Featur

The ICT Propulsion Block indicator is meant to detect and highlight propulsion blocks, which are specific price structures introduced by the Inner Circle Trader (ICT).
Propulsion Blocks are essentially blocks located where prices interact with preceding order blocks. Traders often utilize them when analyzing price movements to identify potential turning points and market behavior or areas of interest in the market.
USAGE (fingure 1) An order block is a significant area on a pric

Here is a version for MetaTrader 5 of the famous Wave Trend indicator. Introducing the Wave Trend Oscillator Indicator for MT5 We are excited to present our Wave Trend Oscillator Indicator, exclusively designed for MetaTrader 5. This advanced tool is a must-have for traders who seek precision and efficiency in their trading journey. Our oscillator is built on the principles of wave trend analysis, capturing the ebb and flow of market trends with unparalleled accuracy. It helps traders identify p
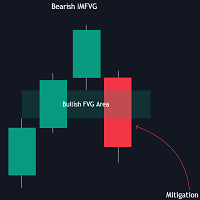
The FVG Instantaneous Mitigation Signals indicator detects and highlights "instantaneously" mitigated fair value gaps (FVG), that is FVGs that get mitigated one bar after their creation, returning signals upon mitigation.
Take profit/stop loss areas, as well as a trailing stop loss are also included to complement the signals.
USAGE Figure 1 Instantaneous Fair Value Gap mitigation is a new concept introduced in this script and refers to the event of price mitigating a fair value gap

Easy Fibonacci é um indicador para MT5 que permite traçar facilmente retrações de Fibonacci. Características Até 10 níveis de Fibonacci podem ser definidos nas configurações do indicador. Cada nível pode ter estilo de linha diferente, cor da linha, largura da linha e outras configurações personalizáveis. Você pode usar um mouse com botões extras para mapear as teclas V e B e traçar Fibonacci convenientemente. Ações dos Botões: B e V: Traçar Fibonacci superior/inferior na área visível do gráfico.

Indicador Financeiro SolarTrade Suite: Indicador do Mercado Terrestre - O seu Guia de Confiança no Mundo dos Mercados Financeiros!
Este é um substituto para os castiçais japoneses cinzentos padrão, que utilizam algoritmos especiais inovadores e avançados para calcular o seu valor e também têm um design agradável à vista.
É muito simples compreender as leituras deste indicador: azul - compra, vermelho - venda. Quanto mais brilhante for a cor, mais forte será o sinal.
Veja os nossos outros
O Mercado MetaTrader é a única loja onde você pode baixar um robô demonstração de negociação gratuitamente para testes e otimização usando dados históricos.
Leia a visão geral e opiniões de outros clientes sobre os aplicativos, faça o download para o seu terminal e teste um robô de negociação antes de comprá-lo. Apenas no Mercado MetaTrader você pode testar um aplicativo de forma absolutamente gratuita.
Você está perdendo oportunidades de negociação:
- Aplicativos de negociação gratuitos
- 8 000+ sinais para cópia
- Notícias econômicas para análise dos mercados financeiros
Registro
Login
Se você não tem uma conta, por favor registre-se
Para login e uso do site MQL5.com, você deve ativar o uso de cookies.
Ative esta opção no seu navegador, caso contrário você não poderá fazer login.