Indicadores técnicos para MetaTrader 4 - 128

MACD - the Moving Averages Convergence/Divergence indicator displays information simultaneously from different periods in one subwindow of the chart.
Parameters Fast EMA — period for Fast average calculation. Slow EMA — period for Slow average calculation. MACD SMA — period for their difference averaging. Type of price — price used. Timeframes for MACD — list of periods, separated by a space or comma or semicolon. Number of bars for each period — the number of bars displayed for each period. So

El sistema comercial listo para usar "Mr. Scalp" muestra al comerciante señales listas cuando es necesario abrir transacciones para la venta o la compra. El sistema muestra cuándo debe abrir una orden y en qué dirección. Funciona en todos los pares de divisas y todos los plazos. Visualmente, este indicador muestra con puntos rojos y azules en el gráfico los momentos en los que es probable que el mercado retroceda para moverse en la dirección opuesta. El sistema también muestra la dirección de l

Do you know the spreads on which your trades are / will be opened. How well do you know about the spreads on which your trades are / will be opened.
The main task of the indicator. Help the user / trader to study the spreads in the trading terminal.
Get information about the minimum and maximum spread on each candle, from M1 and above. This information will help in the following cases: - Maximum trading spread EA --- If your broker has smaller spreads or average statistically higher and th

This indicator will help you identify the key zones needed for The Silver Bullet Strategy which are: The three time-windows the ICT mentioned in the strategy Window 1: 3 AM and 4 AM New York time Window 2: 10 AM and 11 AM New York Time Window 3: 2 PM to 3 PM New York Time Bullish and bearish supply and demand zones which will help you identify FVG inside those time windows T he previous day's high and low, draw on liquidity The indicator does not plot the FVGs to avoid cluttering the chart Exi

Smart Currency Strength is a powerful yet simple indicator that measures the strength of individual currencies.
It features a graphic panel that lists the main currencies and their strength in each timeframe, ranging from 0 (most oversold) to 100 (most overbought). The strength for all currencies in the current timeframe is also shown in a separate window as a multi-line graph, where each currency is represented with a different color, this allows you to monitor the evolution of strength tre

"Scalping and dethatching" es un indicador forex de señal para el scalping, que muestra visualmente la dirección de la tendencia actual en el gráfico. Este indicador le permite determinar la dirección de la tendencia actual con una precisión de hasta el 90% dentro de los 3 segundos posteriores a su incorporación al gráfico. La universalidad del indicador radica en el hecho de que funciona en todos los pares de divisas. Todos los pares de divisas están sujetos a las mismas leyes fundamentales de

With the help of the Fine Market Forex indicator algorithm, you can quickly understand what kind of trend is currently developing in the market. Fine Market is a combined indicator based on several instruments. Fine Market is based on classic basic technical indicators - MA, RSI, MACD, Bollinger Bands, Stochastic. A trader does not need to impose several lines on Forex charts and set up each indicator separately. Fine Market is already successfully combined and has simplified settings, convenie
Accurate Buy sell Levels are the fully automated and purely work's on the basis of the Daily Opening weekly Opening and the Monthly Opening Prices. we don't want to do any analysis and other planning for Intraday or Swing we need to focus only when price approaches near the levels we can add other price action confluence's (Inside Bar's , Bullish / Bearish Engulfing pattern's , SND , Order Blocks ... and so on ) for strong Buy or Sell Confirmation's. Very simple and Easy to Follow system. We c

This indicator gives you the Moving Average based on Renko chart. A Renko chart is a type of chart that is built using price movement rather than both price and standardized time intervals like most charts are. A Moving Average based on Renko chart is considered less noisy since it is not based on the time and only based on price change. You can see my free enhanced Renko indicator here .
Inputs: Box Size: Renko box size based on market Points.
Period: Moving Average Period
Method: Moving

This indicator is great for trading on the pair and many more. The indicator itself uses augmented accuracy mathematical strategies, but so far they are optimized for some currency pairs. Many settings can be configured on the working panel. There are two panels on the chart, for visualization and settings. He displays his solution on the graph in the form of icons. There are only two types of icons. In the tester, it works fine by default in the settings. The second panel for counting the res

The indicator allows for quick identification of price reversals by promptly reacting to price impulses and indicating the beginning of a price reversal. The histogram demonstrates the direction of movement and identifies favorable moments for opening positions. It is recommended for use in swing trading and can be applied to any currency pairs, metals, and cryptocurrencies. It is also suitable for binary options trading. Key Features Rapidly identifies changes in the local trend Works on all t

Fast Scalping is a new product that allows you to identify the current market phase (uptrend, downtrend or flat). Represents a typical investor strategy that usually indicates a trend change from bearish to bullish. A tool that allows you to determine the direction and strength of a trend. Unlike most indicators, Fast Scalping finds longer trends and gives fewer false signals.
This indicator displays arrows of different colors depending on the current state of the market and thus signals the u

Title: Best Reversal Indicator - A Custom MQL4 Indicator for Trend Reversals Description: The "Best Reversal Indicator" is a custom MetaQuotes Language 4 (MQL4) indicator designed to identify potential trend reversals in financial markets. This indicator is intended to be used on MetaTrader 4 (MT4) trading platforms. Key Features: Non Repaint: Best Reversal Indicator is a non repaint indicator means It does not remove its signal after moving forward. Trend Reversal Detection: The indicator scan

The Game-Changing Engulfing Candle Hunter - Your Guide to Profitable Trend Trading
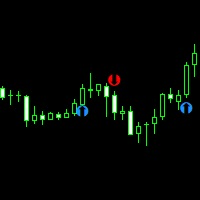
Step into the realm of trading possibilities with our revolutionary product - The Engulfing Hunter. Designed by traders for traders, this dynamic indicator combines the potency of engulfing candlestick patterns and the versatility of proprietary trend detection system, offering a trading edge unlike any other. Engulfing candlestick patterns have always been a revered tool in the arsenal of seasoned traders. Acting
**Features:**
1. **Innovative Trend Tracking:** The UT BOT Simple Indicator leverages the power of the Average True Range (ATR), a renowned volatility measure, to calculate precise trailing stop values, providing unparalleled insights into market trends.
2. **Customizable Settings:** Flexibility is paramount in any trading strategy. With this in mind, our indicator allows you to adjust the ATR periods and other key parameters to tailor the tool to your trading style and strategy.
3. **Real-t

Introducing the Kangaroo Hunter - Your Ultimate Edge in Forex Trading ATTENTION Forex Traders! Are you in constant pursuit of high-probability trade setups? Or maybe you're a novice trader struggling to pinpoint precise entry and exit points? Our solution, the Kangaroo Hunter, is about to revolutionize your trading journey. This meticulously designed indicator simplifies and refines the art of identifying the often elusive Kangaroo Tail patterns in the Forex market, pushing your trading strateg
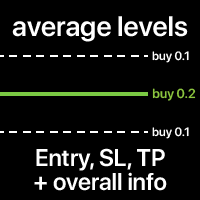
Los niveles promedio de entrada, SL y TP de todas las operaciones en el símbolo. Los niveles pueden calcularse juntos o por separado para operaciones de compra y venta. Puedes mostrar opcionalmente información adicional: precio del nivel, tamaño total del lote, P/L flotante. Los estilos y colores de los niveles son personalizables. Utilidad multifuncional : incluye 66+ funciones | Contáctame si tienes alguna pregunta | Versión para MT5 En la configuración del indicador, puedes configurar:

Este indicador utiliza múltiples indicadores para generar operaciones de señales ganadoras
Alertas y señales mejoradas en V3
Live Testing
El indicador TrendArrowsAlerts para Metatrader 4 es un completo sistema de negociación de divisas que imprime flechas precisas de compra y venta en el gráfico.
El indicador aparece en la ventana principal del gráfico MT4 como flechas de color verde y rojo.
El uso de señales generadas por un solo indicador puede ser riesgoso al operar. Esto se debe a que

The Strong Volume Trend MT4 indicator is a powerful tool designed to help traders identify and capitalize on significant volume trends in the financial markets. With its advanced algorithm, this indicator accurately detects the strength and direction of volume movements, allowing traders to make informed trading decisions. Features: Volume Strength Analysis: The indicator analyzes the volume data and identifies strong volume trends, helping traders spot potential market reversals, breakouts, or

Introducing the "Amusing Entry Arrows" signal indicator, a powerful tool designed to enhance your trading experience on the H1 chart. With its advanced features and customizable arrow settings, this indicator provides valuable insights and timely alerts to help you make informed trading decisions. Key Features: H1 Chart Compatibility: The "Amusing Entry Arrows" indicator is specifically designed to operate on the H1 timeframe, allowing you to analyze price movements effectively within this timef

Visualización de las operaciones de trading, distribuidas por niveles de precio. Puedes establecer cualquier período para el cálculo: entre dos líneas verticales o un intervalo de tiempo fijo. Los niveles del histograma son relativos: una barra más ancha significa mayor volumen de trading. Los extremos de la distribución pueden usarse como niveles de soporte y resistencia.
Todos los estilos, tamaños y colores son personalizables. Utilidad multifuncional : incluye 66+ funciones | Contáctame

Candle Binary Scalper es un producto de análisis técnico para forex y opciones binarias.
Incluye varios indicadores técnicos combinados en un sistema de comercio.
Adecuado para operaciones manuales dentro de una tendencia, para scalping y opciones binarias. Funciona en todos los plazos e instrumentos comerciales.
Los marcos de tiempo recomendados para negociar M15, M30, H1 y H4, M5 y M1 deben usarse en caso de alta volatilidad. Hay varios tipos de alertas.
Cómo usar el producto
Ya se han selec
Trusty Super Signal Indicator
The Trusty Super Signal Indicator is a powerful technical analysis tool designed to assist traders in making informed trading decisions in the financial markets. With its advanced algorithm and user-friendly interface, this indicator provides accurate and timely signals to help identify potential trading opportunities.
Features: 1. Reliable Signal Generation: The Trusty Super Signal Indicator uses a sophisticated algorithm to generate high-quality trading signal

Meet the Tweezer Hunter, an essential tool for every Forex trader looking to make accurate, trend-following trades. This powerful, intuitive indicator helps traders spot potential trend reversals before they happen, providing a significant advantage in the fast-paced world of Forex trading. The Tweezer Hunter is more than your average tweezer candle indicator; it's designed with a built-in trend identification feature that accurately detects whether the market is bearish or bullish. By integrat

Candle confirmer es el indicador que necesitas cuando esperas la confirmación de la última vela para hacer una entrada excelente, este indicador te avisa si la vela actual ha tenido una cotización mayor o menor que la vela anterior. Deja de estar adivinando y empieza a enfocarte en lo que de verdad importa. Puedes activar y desactivar las alertas, elegir el time-frame e incluso cambiar el tamaño, color y posición del indicador. No olvides dejar tu reseña y tus comentarios, nos ayudan a mejorar n

It is no secret that the movements of currency pairs for a certain part of the time occur in a certain price corridor, which is called a channel. The lower limit is considered the level of support, the upper one - resistance. Do not confuse with horizontal support and resistance levels! The distance between the support and resistance levels of a channel is called the range or channel width. The key difference between the Channel Mirosh indicator and other channel indicators (for example, from th
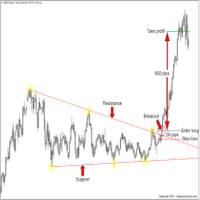
October OFFER: Free Ea with it This is valid till 30th of October. After purchase of indicator connect me on telegram @anabullbear or inbox in mql5 to get free Ea It's a Breakout Scalper On support and resistance and order blocks. Benefits of the indicator: does not redraw arrows. works on all currency pairs. high signal accuracy good for scalping Accuracy level is more than 95 percent. Best TF m15 for gold and major FX pairs Indicator settings: Default for M15,M30, H1 Best Pair -Gold and majo

Combine con Delta Footprint Chart para obtener una imagen completa del perfil de volumen del mercado:
https://www.mql5.com/en/market/product/9415 3 El indicador "Libro de pedidos" muestra un histograma en el gráfico de precios que representa los grupos de volumen de oferta y demanda.
El indicador analiza los datos de precios históricos y calcula los grupos de volumen de oferta y demanda para cada nivel de precio dentro de un número específico de barras. Los grupos de volumen de oferta se
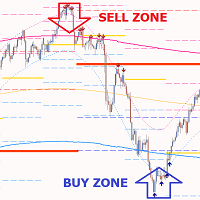
Gold PL MTF es un excelente indicador técnico bursátil. El algoritmo del indicador analiza el movimiento del precio del activo y refleja automáticamente los niveles pivote importantes del período de tiempo especificado (TF) utilizando el método de Fibonacci (sección áurea).
El indicador describe perfectamente la trayectoria del precio del período de tiempo seleccionado (día, semana, mes, año), determina el comienzo de una tendencia y el comienzo de una corrección, que puede convertirse en una
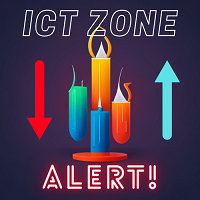
This indicator uses candlesticks with large real bodies to predict possible market structure shift. Displacement is a very powerful move in price action resulting in strong selling or buying pressure. Generally speaking, displacement will appear as a single or a group of candles that are all positioned in the same direction. These candles typically have large real bodies and very short wicks, suggesting very little disagreement between buyers and sellers. Often, a displacement will occur just af

Optimized Version of the Pivot-Based Adaptive Support, Resistance, and Signal Line Indicator No Parameters, Simple and Easy to Use, Suitable for Daily and Lower Timeframes. Advantages: Applicable to all instruments. Suitable for all timeframes. The indicator automatically adjusts with changing data, providing more accurate signals. Instructions for Use: If the current price breaks above the signal line, the trend is bullish, with the initial target being the upper resistance line. If the price

Introducing the Great Oscillator Trend Indicator – a powerful tool designed to enhance your trading strategies and improve your decision-making process.
The Great Oscillator Trend Indicator is a versatile technical analysis tool that helps you identify trends and potential reversals in the financial markets. It utilizes a combination of oscillators and moving averages to generate accurate and reliable signals.
With this indicator, you can easily spot overbought and oversold conditions, as w

The Zigzag Value Indicator is a powerful technical analysis tool designed to assist traders and investors in identifying significant price movements and trends in financial markets. With its advanced algorithm, this indicator helps users determine key turning points and potential reversals, providing valuable insights for making informed trading decisions. To View Our Other Products Go to the link: Other Products
Features:
1. Zigzag Pattern Detection: The Zigzag Value Indicator detects and

All Symbols AND All Time frames Scan
Document Introduction
A breakout refers to when the price of an asset moves above a resistance zone or moves below a support zone. A breakout indicates the potential for a price trend to break.Break provides a potential business opportunity. A break from the top signals to traders that it is better to take a buy position or close a sell position. A breakout from the bottom signals to traders that it is better to take sell positions or close their bu

1 of 10 for 69$
.
Next Price is 89$
SMC Unmitigated Finding is a indicator for find unmitigated supply and demand in previous legs of price
Settings Zigzag Settings ZZDepth - by Default is 12.
ZZDeviation - by Default is 5.
ZZBackStep - by Default is 3. Rectangle Settings SupportColor- color for Support line.
ResistanceColor - color for Resistance line.
Settings Num of Show - Number of Support & Resistance Show.

The DVV indicator is a multifaceted informative indicator for the Forex market or the Cryptocurrency market . The indicator gives clear and reliable signals without redrawin g. The indicator can be used in bots by taking readings from its zero buffer.
Please note that for different currency pairs, the settings must be selected separately, this is not difficult.
Changing the input parameters greatly affects the display. I will show four options for using the indicator. The indicator ha

Gioteen Volatility Index (GVI) - your ultimate solution to overcoming market unpredictability and maximizing trading opportunities. This revolutionary indicator helps you in lowering your losing trades due to choppy market movements. The GVI is designed to measure market volatility, providing you with valuable insights to identify the most favorable trading prospects. Its intuitive interface consists of a dynamic red line representing the volatility index, accompanied by blue line that indicat
Descubre el poder de las tendencias del mercado como nunca antes con el Indicador de Tendencias Multi-Temporales 3-HMA. Esta herramienta fiable es tu compañero de confianza en el complejo mundo del comercio de divisas. Fue diseñado con la versatilidad y la precisión en mente, lo que lo hace ideal para los operadores que comprenden la importancia de seguir las tendencias y quieren aprovechar la reactividad inigualable del Promedio Móvil de Hull (HMA).
El Promedio Móvil de Hull se distingue de l
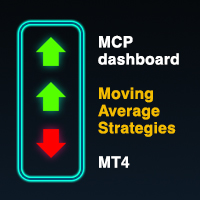
Multicurrency indicator in table format. Signals appear with confirmation, no repaints. Works on the current (open) timeframe. Notifications come for an open instrument. In the indicator settings, you can choose 1 of 4 Moving Average strategies. Strategies (represented in screenshots): Classic fast and slow moving average crossover Reverse signal of classic crossing (used for flat/sideways movement) Classic crossover relative to a slower moving average (Trend MA in settings) Price touching the f
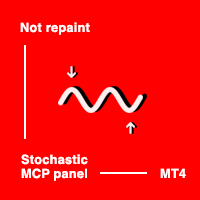
Multicurrency indicator in table format. Signals appear with confirmation, no repaints. In the settings, you can select the number of candles/bars on which the signal will still be displayed so that the trader takes it into account and does not miss it. The indicator works on the current (open) timeframe. Notifications come for an open instrument. In the indicator settings, you can choose 1 of 4 Stochastic strategies Strategies (represented in screenshots): The main line crosses the signal line

Introducing Real Cross System , the cutting-edge trading signal indicator designed to revolutionize your trading experience. Whether you are a seasoned trader or a newcomer to the financial markets, this powerful tool is engineered to provide accurate and timely signals, empowering you to make informed trading decisions with confidence. Features: Real-Time Signal Generation: Real Cross System utilizes advanced algorithms to generate real-time trading signals based on precise market analysis.

El indicador de estrategia inteligente es un sistema comercial que le permite analizar el mercado en términos de varios aspectos del análisis técnico. El primero de ellos es un canal de precios, que se construye automáticamente y permite al comerciante ver la dirección principal del movimiento de precios. También permite analizar el mercado utilizando una estrategia de canal (ruptura y rebote de las líneas del canal).
El bloque 2 es el sistema SAR, que da información general sobre los micromov
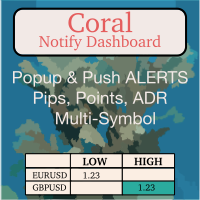
Coral Notify Dash allows you to manage all of your chart price-based notifications from a single consolidated dashboard. It fills a gap left by MT4, which does not support popup alerts. If you're like me and you often don't hear the alert sound for the built-in alerts, this is an indispensable tool. I use Coral Notify Dash as part of my daily chart analysis workflow. I use a tool like Coral Dash (available for free, here ) or one of the other dashboards to set my trading bias. As I review t

The Exact Arrow Entry Signal Indicator is a powerful tool designed to assist traders in making informed decisions in the financial markets. This advanced indicator leverages cutting-edge algorithms and technical analysis to identify potential entry points with high accuracy.
Features: 1. Precision Entry Points: The indicator generates precise arrow signals on the chart, highlighting potential entry points for various trading strategies.
2. Trend Identification: By analyzing price movements a

Presenting the uGenesys Break of Structure and Change of Character Indicator The uGenesys Market Structure Indicator is the advanced solution designed specifically for forex traders seeking a competitive edge. This innovative tool goes beyond merely identifying Break of Structure (BoS) and Change of Character (CHoC); it also illuminates optimal entry and exit points on your forex charts, transforming your trading experience.
While the uGenesys Market Structure Indicator can reveal pivotal pat

Arbitrage MACD: Your Key to Analyzing Market Trends
The Arbitrage MACD is a cutting-edge indicator designed to assist traders and investors in analyzing market trends with greater precision and confidence. MACD, which stands for Moving Average Convergence Divergence, is a well-known and widely used tool in the financial world, and the "Arbitrage MACD" takes its functionality to the next level.
This innovative indicator offers a comprehensive analysis of the relationship between two moving ave

The " Arbitrage RSI " is a cutting-edge technical indicator designed to assist traders in making informed decisions in the financial markets. This powerful tool leverages the concept of Relative Strength Index (RSI) divergence to identify potential trading opportunities. To View Our Other Products Go to the link: Other Products
Features: RSI Divergence Detection: The Arbitrage RSI excels at identifying divergence patterns in the RSI indicator. By comparing the price action with the RSI move
The Finding Average Volume indicator for MetaTrader 4 is a technical analysis tool that calculates the average volume of swing bars. Swing bars are a type of price chart pattern that identifies potential turning points in the market. The indicator is displayed as a zigzag trend line that is bounded by two vertical lines. The average volume is calculated for the entire swing bar pattern. Benefits of Using the Finding Average Volume Indicator Identify potential trend changes: The Finding Average

ATR Channels Indicator Introducing the ATR Channels Indicator, a powerful tool designed to enhance your trading experience and provide valuable insights into market volatility. ATR, short for Average True Range, is a technical indicator that helps traders understand the overall price volatility of an asset or market. The ATR Channels Indicator takes the ATR calculations to the next level by plotting them as dynamic channels on your price chart. These channels represent the range within which pri

Introducing ICT Reaction Levels, a reliable indicator designed to plot key levels on your chart. Unlike classical support and resistance, these levels are derived from significant highs and lows observed on higher timeframes, such as the weekly and monthly periods. The indicator provides a valuable tool for traders seeking to identify critical price levels based on historical price reactions.
ICT Reaction Levels analyzes price action on the specified timeframe, using special inputs to determin

The FollowLine indicator is a trend following indicator. The blue/red lines are activated when the price closes above the upper Bollinger band or below the lower one.
Once the trigger of the trend direction is made, the FollowLine will be placed at High or Low (depending of the trend).
An ATR filter can be selected to place the line at a more distance level than the normal mode settled at candles Highs/Lows.
Some features: + Trend detech + Reversal signal + Alert teminar / mobile app

Title: Best Trend Sniper Indicator - A Custom MQL4 Indicator for Spotting Potential Trends Description: Indicator Name: Best Trend Sniper Indicator Introduction: The "Best Trend Sniper Indicator" is a custom Meta Quotes Language 4 (MQL4) indicator designed to identify potential trends in financial markets. This indicator is intended to be used on Meta Trader 4 (MT4) trading platforms. Key Features: Non Repaint: The Best Trend Sniper Indicator is a non-repaint indicator, which means it does not
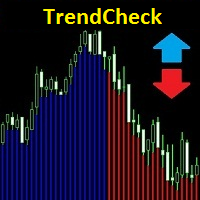
Este indicador dibuja una línea horizontal azul o roja debajo de cada vela, que indica la dirección de la tendencia. La línea azul significa que la tendencia es alcista, la línea roja es la tendencia bajista.
El indicador tiene una nueva lógica, que lo distingue significativamente de muchos análogos. Da señales tempranas de entrada y salida, no vuelve a dibujar sus valores, es decir, si el indicador dio una señal para ingresar a una operación, entonces esta señal no desaparecerá y no se moverá
RSI Divegence Win Pro
The RSI Drivergent is the best indicator for looking for price reversals.
RSI Drivergent Win Pro has used the strengths and best points of RSI to create in a format for traders to understand more easily.
Suitable for beginners and professional traders.
Case Up Trend : Blue line is below Yellow line. Case Down Trend : Blue line is abve Yellow line.
Usage is very easy. 1. Import the indicator into the MT4 chart. 2. Defind Overbought positions and defind oversold positi

MT5 Version
Understanding market sentiment is a critical aspect of successful trading. Market sentiment refers to the overall feeling or attitude of traders and investors towards a particular financial instrument, such as a stock, currency pair, or cryptocurrency. It is a collective perception of market participants' emotions and beliefs about the asset's future price direction. Market sentiment can be bullish (positive), bearish (negative), or neutral (sideways). Knowing the market sentiment c
SWING X Black es un indicador revolucionario de MetaTrader 4 (MT4), meticulosamente elaborado para satisfacer las necesidades del trading manual y automático en los mercados de Opciones Binarias y Forex. Su precisión sin igual, junto con su adaptabilidad a diferentes marcos de tiempo, lo convierte en una herramienta poderosa para los traders que buscan maximizar sus ganancias. SWING X Black está optimizado para el marco de tiempo de 15 minutos, ideal para la toma de decisiones rápida y la ejecuc
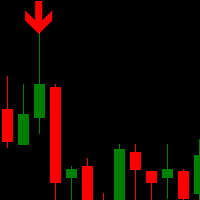
Trend Scalper Arrows is a unique trend reversal 100% non-repainting multi-algo indicator that can be used on all symbols/instruments: forex, commodities, cryptocurrencies, indices, stocks . Trend Scalper Arrows will determine the current trend at its early stages, gathering information and data from up to 10 standard algos When indicator give a valid buy or sell signal, a corresponding arrow will be printed on the chart, open trade at start of the next candle/bar indicating a
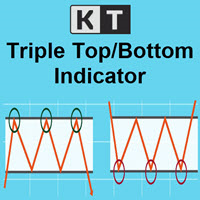
KT Triple Top-Bottom identifies the triple top/bottom pattern with a breakout signal in the opposite direction. It is used to identify potential trend reversals.
A Triple Top pattern is formed when the price reaches a high point three times, while a Triple Bottom pattern occurs when the price comes to a low point three times.
Features The indicator detects the triple top/bottom pattern with high precision and accuracy. The indicator suggests a shift in momentum, with sellers or buyers taking

KT DMA is a modified and advanced version of the classic Displaced Moving Averages with buy/sell crossover alerts and a Multi-Timeframe scanner that shows DMA's direction across each real-time time frame. A Displaced Moving Average is a simple moving average that moves ahead or backward in a time frame (either short-term or long-term). It also allows you to predict price movement more accurately.
Features Depicts the trend direction using the alignment of three moving averages. Buy/Sell signals
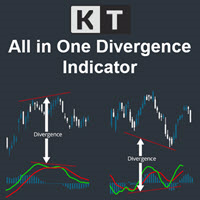
The KT All-In-One Divergence is designed to identify regular and hidden divergences between the price and 11 widely recognized oscillators. This powerful tool is indispensable for swiftly and accurately spotting market reversals. Its a must-have tool in any trader's arsenal, providing clear and accurate divergence patterns. Its accuracy and speed in identifying market reversals are remarkable, allowing traders to seize profitable opportunities confidently.
Features No Interference: You can ad

indicator CE and RF Buy-Sell Chandelier Exit and Range Filter Buy Sell
It is the ultimate indicator for telling entry points or entering trades with high accuracy.
Trades must be short term trading only or Scalping only, not suitable for holding positions across several days.
Suitable for beginner traders and professional traders.
Easy Operation 1. Import Indicator, CE and RF into MT4 chart. 2. Waiting for the signal from the arrow pointing up means recommending a long position. and an arro
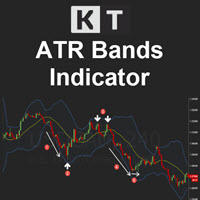
KT ATR Bands dibuja envolventes y bandas de volatilidad utilizando una combinación del indicador Average True Range (ATR) y una media móvil. Estas bandas se utilizan comúnmente para identificar posibles puntos de reversión y períodos de alta o baja volatilidad.
Características
Capacidad Multitemporal: Por ejemplo, puedes visualizar las bandas ATR del gráfico diario en un gráfico H1. Alertas Inteligentes: Puedes activar o desactivar alertas para cada banda por separado y definir un intervalo mín
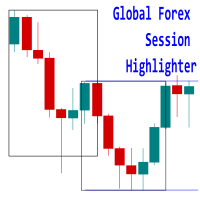
Introducing the 'Global Forex Session Highlighter' , a powerful tool designed to enhance your trading strategy by providing a visual representation of the Three major Forex trading sessions: Tokyo, London, and New York. This indicator is designed to help traders understand the dynamics of the global Forex market by highlighting the trading sessions directly on your MT4 chart. It provides a clear view of when each session starts and ends, allowing you to strategize your trades around the most
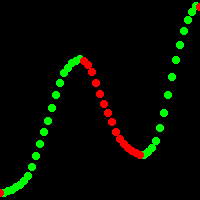
"Xhmaster formula forex indicator" - un nuevo indicador oscilador con modelado matemático de regresión de series numéricas libres. Este indicador es un 60% más preciso en la identificación de puntos de reversión de precios en comparación con el indicador estándar "Xmaster formula", y es menos sensible a pequeñas fluctuaciones de precios. "Xhmaster formula forex indicator" es una herramienta única y avanzada diseñada específicamente para traders en el mercado Forex. Proporciona a los traders exce

However, the difficult task here for traders is to understand and select the indicator or tool that can help them with their trading plan and benefit their trading style. Traders want a tool that requires minimal effort and provides as much support as it can.
There are multiple reasons for which traders need an indicator. One such reason is to determine the buy-sell signals in the market. The King Binary Forex Scalping Indicator is a tool that can help traders get answers to many questions
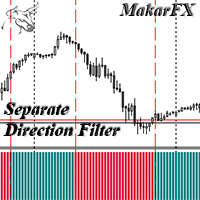
The indicator shows the Buy/Sell direction. The calculations use the opening prices and their rate of change for the billing period - "Calculation period" MTF indicator - "Calculation timeframe", no repaint - NRP. Two display types: "Simple histogram" or "Histogram level crossing" Alerts available: "Chart message", "Push message", "Email message" Two types of signals: "Change direction" or "Crossing level" Level settings: "Crossing UP level" and "Crossing DN level" Color settings. For EA: iCusto

In Forex trading, understanding support and resistance is crucial. Virtually every trading strategy incorporates these levels.
MetaTrader lacks built-in support and resistance calculation features, but there's a solution— the Support and Resistance Lines indicator.
This powerful MetaTrader indicator automatically calculates and displays support and resistance levels for any chosen currency pair or trading instrument.
Benefits of the Support and Resistance Lines indicator:
1. Identify better
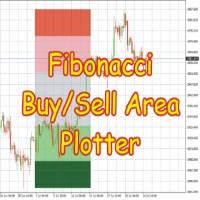
This Indicator is based on Fibonacci levels and draws Buy & Sell Areas. Buy areas are defined in green color (light green & dark green) while Sell areas are defined in red color (light red pink and darker color) Rectangles to easily know that whether price is in buy area or sell area. If price is in gray area, wait for price to come in to your desired area. You can use on any Forex Pairs.
This indicator calculates on the basis of h4 timeframe no matter what time frame you have selected, its calc

All Symbols AND All Time frames Scan
Document Introduction
The ABCD is a basic harmonic pattern. The ABCD pattern is a visual, geometric chart pattern comprised of three consecutive price swings. It looks like a diagonal lightning bolt and can indicate an upcoming trading opportu
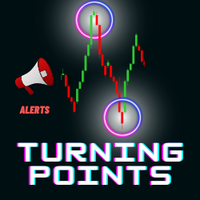
Analice rápidamente la estructura del mercado con esta herramienta y aproveche los niveles de precios importantes.
Estructura del mercado Este indicador personalizado traza los niveles de precios importantes, que pueden utilizarse como puntos de entrada u objetivos de beneficios.
Identifique su rango de negociación Haga scalping con este indicador respetando los puntos de giro del mercado.
Oportunidades de ruptura Utilice este indicador para detectar oportunidades de ruptura. Esta estrate
¿Sabe usted por qué MetaTrader Market es el mejor lugar para vender estrategias comerciales e indicadores técnicos? Con nosotros, el desarrollador no tiene que perder tiempo y fuerzas en publicidad, protección del programa y ajustes de cuentas con los compradores. Todo eso ya está hecho.
Está perdiendo oportunidades comerciales:
- Aplicaciones de trading gratuitas
- 8 000+ señales para copiar
- Noticias económicas para analizar los mercados financieros
Registro
Entrada
Si no tiene cuenta de usuario, regístrese
Para iniciar sesión y usar el sitio web MQL5.com es necesario permitir el uso de Сookies.
Por favor, active este ajuste en su navegador, de lo contrario, no podrá iniciar sesión.