What to feed to the input of the neural network? Your ideas... - page 49
You are missing trading opportunities:
- Free trading apps
- Over 8,000 signals for copying
- Economic news for exploring financial markets
Registration
Log in
You agree to website policy and terms of use
If you do not have an account, please register
My thinking is simple, after experiencing the whole thankless fiddling thing too:
There are market states, you can get them, for example, through clustering.
If you take and connect quotes (returns) from each separate cluster, in some cases you will get almost a stationary series. You can already work with it.
Further, it is absolutely no matter what to feed to the input of the model (preferably raw prices, so that there is no loss of information).
MO algorithms work perfectly well, there is no need to dig into them. You need to look for stationary regularities. Only on them the MOSHka steadily predicts the future.
I saw the results of your article on cross-validation. Evgeny Kostenko made an Expert Advisor with a working forward of 10 years based on it.
The only thing is that it is a long-term construction, in the sense that it is an investment product. Depo is needed there because of long balance flatness.
Another niche - pipsing and scalper - is occupied by broker, the spread kills the high-frequency grail, which can be collected on any MLP, as the practice of commission-free and spread-free testing has shown.
And here is "our", "budget" niche - intraday and mid-term - there is no solution in it. Except for artefacts like technical arbitrage and so on.
And this is where a working solution should be implemented.
I saw the results of your article on cross-validations. Evgeny Kostenko has created an Expert Advisor based on it with a working forward of 10 years.
The only thing is that it is a long-term construction, in the sense that it is an investment product. There depo is needed because of long balance flatness.
Another niche - pipsing and scalper - is occupied by broker, the spread kills the high-frequency grail, which can be collected on any MLP, as the practice of commission-free and spread-free testing has shown.
And here is "our", "budget" niche - intraday and mid-term - there is no solution in it. Except for artefacts like technical arbitrage and so on.
And this is where a working solution should be implemented.
So far I have not been able to conduct many tests on macbook on TF M5 and below to ticks, it is very slow. I'm just too lazy to wait. Maybe I'll give birth sometime later.
Price changes or increments on some kind of floating window or on the current bar - kind of ok.... read.
Thanks, tried it
This design also gives sometimes good results on a simple NS
Potential advantages:
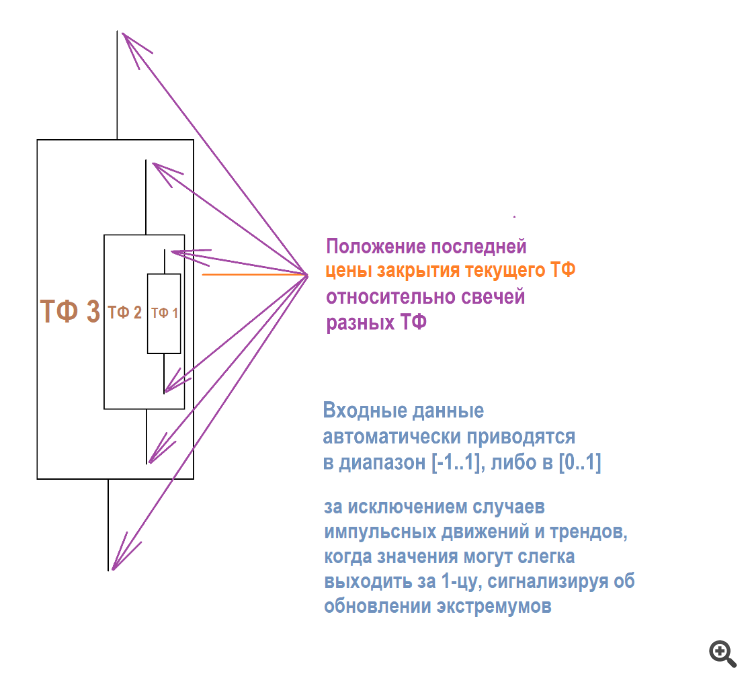
Ideally, we would connect stationary inputs and non-stationary inputs - naked prices, so that the NS could work "according to the instructions", but on a free dynamic (with freely moving price) chart.
Why does multiplication of the input number by some number give more stationary stability in trading?
What is it about multiplication...
That is, if a normalised number is fed to the input and then some coefficient is added to it, the optimization does not give overtrained or simply flat sets.
But if we multiply the input number by a coefficient and run the optimisation again, we get the best overtrained sets. The recovery factor, the profit factor, the balance, everything is orders of magnitude higher than if you add linearly.
Even when they created the perceptron, neural network, they implemented multiplication by weights, not addition/subtraction.
Why is this so? Who knows, is there any "production" sense in it or just tried it - it worked - left it.
UPD
If anything, I got a 3 in maths. Don't swear
This way the sampling increases and the balance line is more likely to be flat.
Yes, it is an over-survivalist, because it does not have a strict stop-loss, but the task is simplified - you need to find ways to suppress these parts of the chart, where the NS starts to fall asleep.
That is, you need to play with the threshold of the output activation function together with the input data specialised for this task. For example, candlesticks are no longer suitable, as they most often show random in the sizes of deals on the chart.
I got this idea from the MO branch. Initially, about 5-10 years ago, when I saw the results of the then NS-advisors, I immediately spat with the words: "Shameful overstayer!". I made sure of it during testing and threw it in the trash.
But now, having double-checked everything and anything I could and figured out, practice itself shows that the most stable results from unstable ones are just when NS "tikes" are low and "moose" are big.
So far, ZigZag remains the top input data type on any simple architectures.
I came to the conclusion that intraday-medium-term working NS should have a low average profit and high average loss.
.
On the example of one of the sets:
It can be seen that the takes are short, and the losers are stronger. If it overstays, it leaves green "snot" in the form of equity sagging. But if it finds a good point on the chart, it can close in time and thus show some stability
Optimisation - year: 2021-2022, EURUSD H1
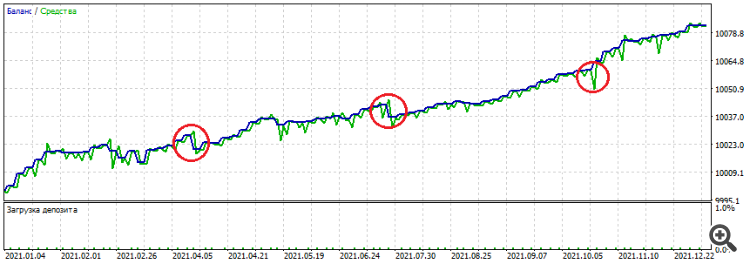
Forward has lasted for 2 whole years: 2022-2024
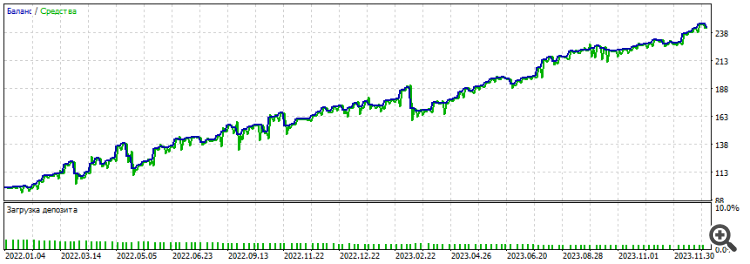
What is also potentially good is the intraday size of the trades: at least they are not single candlestick trades, but are sometimes stretched over time. Also, the trades are traded both ways, BUY and SELL. The eternal problem of approximation (if I use the term correctly) is that NS chooses which trades earn the most and builds weights for them. As a result - if the trend on the optimised section is down, and one third of its section is up, then global subsidence occurs on the forward or backing.
Using one of the sets as an example:
Yes, sometimes I try to remove this restriction.
It makes sense, as the price goes in a snake, ideally it should take both take-outs.