You are missing trading opportunities:
- Free trading apps
- Over 8,000 signals for copying
- Economic news for exploring financial markets
Registration
Log in
You agree to website policy and terms of use
If you do not have an account, please register
The main problem in your case with these coefficients is the large scatter in the recalculation.
You also mentioned that you based your model on the LOC model. This is the most primitive model.With these errors, it is not possible to correctly build a statistical real-time model. Only off-line.
Think about the robustness of these coefficients.
Or fix them according to some condition, until they approximate what is expected.
Try TLS or FLS
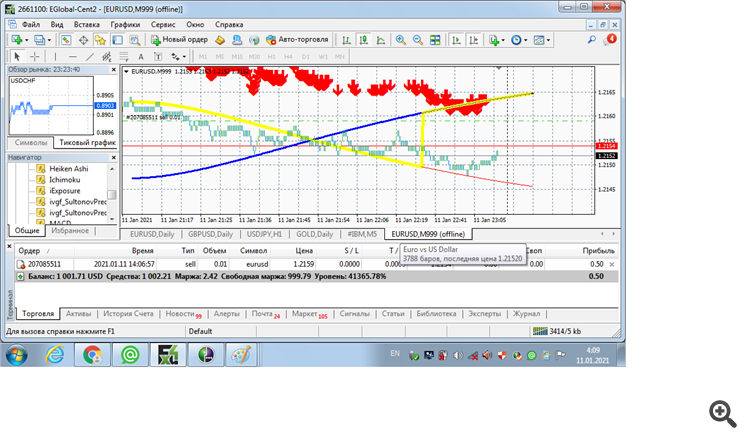
I'm using PNB as a base - the solid line of my indicator is the PNB.
I'm using PNB as a base - the solid line of my indicator is the PNB
That's clear, I've seen these screenshots, and even saved them from the deleted thread. I have them ))
Found the indicator, felt it, looked at it, that's why I am sharing my opinion.
But somewhere you mentioned MNC, can't find it anymore.
For this reason I assumed that your PNB is a transformed ISC by other calculations.
Since you refer to coefficients as the main component of the calculation.
Your approximation of zero is excellent, but unfortunately zero has a large error in the recalculation.
The idea of extrapolating zero is understandable. But it is an inefficient method.
Next:
Next:
Even, the tics are subordinate to the PNB:

What more do you need, gentlemen traders and programmers! We need to test this TS in practice. I am waiting for the proposals. I will consider any Forex instrument and other markets. I need to select the optimal sample for each instrument, and that's it!
What else do you need, gentlemen traders and programmers! We need to test this TS in practice. I am waiting for the proposals.I have pointed out the main problems with your implementation, which many here already know and have tried out.
The PNB has now shown its second branch:
I pointed out the main problems of your implementation, which many here already know and have tested.
Yes, there are problems, and they need to be solved jointly, using a strategy tester and a demo resource, finding an optimal sample, cutting off unnecessary "Future", and identifying the characteristics of the reversals that the PNB points to with its three branches. Each time it is necessary to find out which of the three branches strictly fulfils the condition P+H+B =1. This turned out to be one of the secrets of PNB. I missed this opportunity in the code by being too lazy to declare another conditional transition.
The PNB has now shown its second branch:
Perhaps many here don't understand how you interpret the signals, as you are in search of them yourself.
But statistical methods of analysis fall away unless you get the robustness of the coefficients.
Another question, did I understand correctly that the calculation has no sensitivity parameter?
And it only depends on sample size?
Many here may not understand how you interpret the signals, as you are in search of them yourself.
But statistical methods of analysis fall away unless you achieve robustness of the coefficients.
Another question, did I understand correctly that the calculation has no sensitivity parameter?
And it all depends on sample size?
The sample size starts at 4 bars and is not limited in size. The optimum one should be determined by the tester. For example, optimal size for Eurodollar 5 years ago was 300 daily bars. Now we need to search and find it for each TF relying on trade results and model errors. I have the algorithm, and I will post it here if necessary.
The constants of the trading times for each TF are not completely determined and they set their "watch" for each instrument. There are a lot of questions to be asked and solved. The main thing is not guessing, but a careful study of the problem. The regularity is there, you have to use it properly.
One has to get used to the fact that each tool has its own time, different from what we earthlings are used to. Process does not care about sunrise and sunset, it has its own time. I will show you what time ticks have, if you are interested.
The sample size starts at 4 bars and is not limited in size. The optimal one should be taken according to the tester. For example, for the Eurodollar the optimal sample size 5 years ago was 300 daily bars. Now you need to search and find it for each TF relying on trading results and model errors, I have the algorithm and will post it here if necessary.
Since you are well versed in maths, I can send you a scientific paper from several departments of the University of California in economics from 1989.
Where the problem of robustness of coefficients is discussed as I understand it. By studying this article you might have some ideas for your own algorithm.
But ideally you should first reproduce what is explained in the article. Unfortunately I'm not a mathematician and it's hard for me to understand mathematical laws that are described.
But this article was recommended to me by a man who is commonly referred to as a smart.
If you are interested, I will send it to you in person. The article is in English.