Scalping is a trading strategy that focuses on making small profits repeatedly over very short time frames.
The 5-minute scalping strategy is designed for traders aiming for rapid exchanges in volatile markets such as Forex, stocks, and cryptocurrencies. This guide will break down the key components of this strategy into seven detailed sections:
By the end of this article, you will be equipped with the knowledge to effectively implement the best 5-minute scalping strategy.
Understanding Scalping
Definition and Evolution of Scalping
Scalping involves executing numerous trades within short time frames, often just a few minutes, to exploit minor price movements. The practice has evolved with market technology, allowing traders to use algorithmic systems and sophisticated strategies that capitalize on fleeting opportunities.
Our product delves into the concept of scalping, which involves executing numerous trades within short time frames to capitalize on minor price fluctuations, enhanced by market technology with algorithmic systems and sophisticated strategies.Don't forget to check the link for more details!
The Power of the 5-Minute Time Frame
The5-minute frame provides a balanced approach, allowing traders to realize quick profits while reducing exposure to sudden market shifts. This time frame is optimal for traders looking to leverage both intraday price volatility and news events that might impact asset prices rapidly.
Characteristics of Suitable Markets
Scalping is most effective in markets characterized by high liquidity, tight spreads, and significant volatility. Traders should focus on:
Forex Pairs: EUR/USD, GBP/USD, AUD/USD are popular for scalping due to their high liquidity.
Stock Indices: S&P500 and NASDAQ offer high trading volume, allowing quick transactions.
Cryptocurrencies: Bitcoin and Ethereum stand out due to their inherent volatility yet liquidity.
Core Principles of the5-Minute Scalping Strategy
Mastering Technical Analysis
Technical analysis is essential for scalpers. Traders should focus on specific techniques like:
Support and Resistance Levels: Identifying critical levels can inform entry and exit decisions.
Candlestick Patterns: Recognizing candlestick formations like dojis or hammers can signal potential reversals
If you're eager to elevate your trading game and discover powerful strategies for success, don't miss our in-depth article on scalping strategies! It's packed with insights that can significantly enhance your trading approach. Check it out now and take your skills to the next level!
Monitoring volume helps to confirm breakout sustainability.
Exponential Moving Averages (EMA):
Particularly short-term EMAs can be used to identify trends quickly.
Step-by-Step Execution Techniques
Pre-Trading Analysis:
The importance of preparation cannot be overstated. Traders should conduct thorough pre-trading analysis by reviewing:-
Economic Calendars:
Being aware of scheduled economic events can prevent unplanned volatility.
Live Market Sentiment:
Gauging market sentiment can aid in decision-making for news releases.
Execution Precision
Once a strategy is in place, focus on executing trades correctly. Key considerations include:
Limit and Market Orders:
Understanding when to use limit vs. market orders can affect entry prices.
Rapid Reaction to Price Movement:
Being prepared to act as prices approach pre-determined support and resistance levels is crucial.
Continuous Trade Monitoring
Effectively monitoring trades post-execution aids in timely adjustments. Use alerts and notifications to remain responsive to market shifts.
Indicators that can be taken advantage of
Candlestick Charts
Although resembling a bar chart, each candlestick encapsulates four key data points for the day: the opening and closing prices in the solid body, along with the highest and lowest prices in the "candle wick." Being rich in information, it often illustrates trading trends over brief timeframes, typically spanning a few days or trading sessions.
Candlestick charts are primarily utilized in the technical analysis of stock and currency price patterns. Traders employ them to assess potential price movements based on historical patterns, using the opening price, closing price, high, and low for that time period. They are visually similar to box plots, although box plots convey different information.
Moving average
A moving average is a technical indicator that helps identify trend directions by averaging the price of a financial security over a specific time period. It is continually updated with the latest price data.
Analysts use moving averages to assess support and resistance by analyzing an asset's price movements, reflecting its past price action.
Analysts and investors use moving averages to predict potential price directions. It is considered a lagging indicator since it follows the asset's price action to generate signals or indicate trends.
Types of Moving Averages
The Simple Moving Average (SMA)
The Simple Moving Average (SMA) is a straightforward technical indicator calculated by summing recent data points and dividing by the number of time periods. Traders use the SMA to generate signals for entering or exiting the market. This indicator is backward-looking, relying on past price data, and can be computed for different types of prices, including high, low, open, and close.Analysts and investors use the SMA to determine buy and sell signals for securities and identify support and resistance levels. To generate the SMA, traders first add prices over a specific period and then divide the total by the number of periods. This information is then plotted on a graph.
Sarah, wants to calculate the simple moving average for Stock XYZ by examining the closing prices of the stock for the last seven days. The closing prices for Stock XYZ for the last seven days are as follows: $30, $31, $30.50, $32, $33, $34, and $35.The SMA is then calculated as follows:SMA = ($30 + $31 + $30.50 + $32 + $33 + $34 + $35) /7SMA = $32.07Therefore, the simple moving average for Stock XYZ over the last seven days is $32.07.
Exponential Moving Average (EMA)
The Exponential Moving Average (EMA) gives more weight to recent prices, making it more responsive to short-term price changes compared to the Simple Moving Average (SMA), which applies equal weight to all price changes over a specified period.**
Steps to Calculate EMA:
1. Calculate the Simple Moving Average (SMA) for the selected period:
The EMA needs a starting point, which is the SMA. The SMA is obtained by summing the closing prices over the period and dividing by the number of periods.
2. Calculate the multiplier for weighting the EMA:
The formula for calculating the multiplier is:
For exsmple if time period in question is 10 . The multiplier
3. The current EMA is computed using the formula:
The weighting given to recent price data is higher for a shorter-period EMA than for a longer-period EMA. For instance, an EMA over 10 periods has a higher multiplier (18.18%) applied to recent prices compared to a 20-period EMA, which has a multiplier of9.52%.
The relative strength index (RSI)
The relative strength index (RSI) is a momentum gauge utilized in technical analysis. RSI assesses the velocity and extent of a security's recent price fluctuations to identify overbought or oversold conditions in the price of that security.
The RSI is presented as an oscillator (a line chart) on a range from zero to100. The indicator was created by J. Welles Wilder Jr. and unveiled in his groundbreaking1978 publication, New Concepts in Technical Trading Systems.
Your Navigator in the Ocean of Market Fluctuations! (RSI)
As a momentum indicator, the relative strength index compares a security's strength on days when prices go up to its strength on days when prices go down. Relating the result of this comparison to price action can give traders an idea of how a security may perform.2 The RSI, used in conjunction with other technical indicators, can help traders make better-informed trading decisions.
Measuring RSI
The RSI employs a two-step computation that begins with the subsequent equation:
Once there are14 intervals of data accessible, the subsequent computation can be performed. Its aim is to refine the outcomes so that the RSI only approaches100 or zero in a significantly trending market.
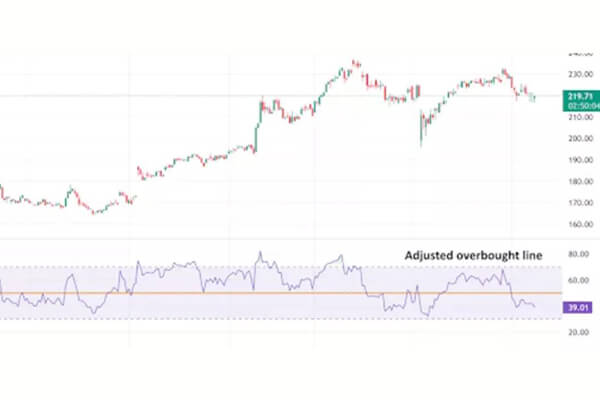
As you can observe in the chart above, the RSI indicator can remain in the overbought zone for prolonged durations while the stock is experiencing an upward trend. The indicator may also persist in the oversold area for an extended time when the stock is undergoing a downward trend. This can be perplexing for novice analysts, but gaining an understanding of how to utilize the indicator within the framework of the current trend will elucidate these matters.
Overbought / Oversold
Overbought or Oversold Conditions in RSI
RSI Levels:
An RSI above 70 indicates overbought, suggesting a potential price correction.
An RSI below 30 indicates oversold, implying a potential price rebound.
Overbought: A security is overbought when its price exceeds its true value, often prompting traders to sell due to expected price declines.
Oversold: A security is oversold when it trades below its true value, leading traders to consider buying in anticipation of a price increase.
Trading Implications:
For overbought conditions, traders may sell or take profits.
For oversold conditions, traders may buy, aiming for a potential rebound.In summary, RSI helps traders identify overbought and oversold conditions, guiding their buying and selling decisions.
The Moving Average Convergence Divergence (MACD)
The MACD (Moving Average Convergence Divergence) indicator is a popular trading tool used in technical analysis to identify potential buy and sell signals. Here's how to use it:
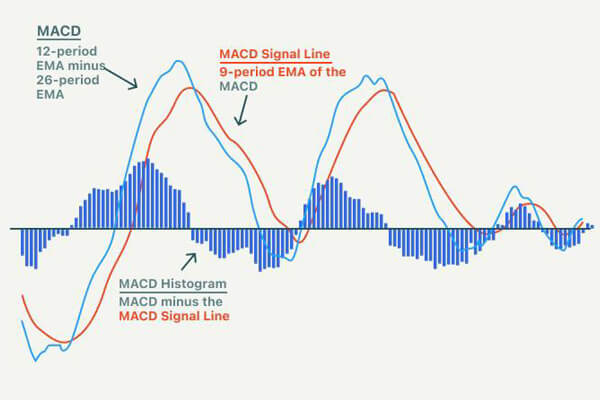
1.the Components
MACD Line : The difference between the12-day and26-day exponential moving averages (EMAs).
Signal Line: A 9-day EMA of the MACD Line.
Histogram: The difference between the MACD Line and the Signal Line, which indicates momentum.
Setting It Up:
Most trading platforms offer the MACD as a built-in indicator. Simply add it to your chart.
Interpreting the MACD: Crossovers: A buy signal occurs when the MACD Line crosses above the Signal Line. Conversely, a sell signal occurs when the MACD Line crosses below the Signal Line.
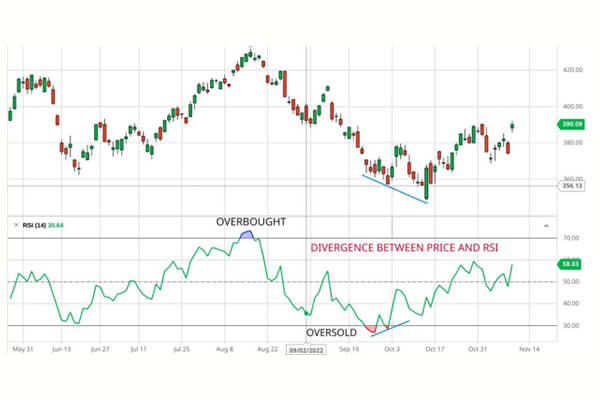
Divergence: If the price is making new highs/lows but the MACD is not, this indicates potential reversals.
Histogram: A growing histogram indicates increasing momentum, while a shrinking histogram suggests weakening momentum.
Using MACD in Context: Always consider MACD signals in conjunction with other indicators and chart patterns for better decision-making. Look for support and resistance levels to validate signals.
Practice and Adjust: Experiment with different time frames and settings to see what works best for your trading style. - Backtesting can also be helpful in understanding how MACD would have performed in different market conditions.Remember, while the MACD is a powerful tool, it's important to use it as part of a broader trading strategy. Always manage risk effectively.
At the end
5-minute scalping offers traders a dynamic approach to capitalize on market volatility effectively. By mastering technical analysis, employing robust strategies, and utilizing essential tools, traders can maximize gains in short time frames while skillfully managing risks. Embrace this exciting trading technique for enhanced market opportunities!


")


")
