Articles with examples of indicators developed in MQL5
The articles contain detailed explanation of the attached codes. Download and open them in MetaEditor and program together with the author while reading the article.
Add a new article

You are missing trading opportunities:
- Free trading apps
- Over 8,000 signals for copying
- Economic news for exploring financial markets
Registration
Log in
You agree to website policy and terms of use
If you do not have an account, please register

Graphical Interfaces V: The Vertical and Horizontal Scrollbar (Chapter 1)
We are still discussing the development of the library for creating graphical interfaces in the MetaTrader environment. In the first article of the fifth part of the series, we will write classes for creating vertical and horizontal scrollbars.

Price Action Analysis Toolkit Development (Part 53): Pattern Density Heatmap for Support and Resistance Zone Discovery
This article introduces the Pattern Density Heatmap, a price‑action mapping tool that transforms repeated candlestick pattern detections into statistically significant support and resistance zones. Rather than treating each signal in isolation, the EA aggregates detections into fixed price bins, scores their density with optional recency weighting, and confirms levels against higher‑timeframe data. The resulting heatmap reveals where the market has historically reacted—levels that can be used proactively for trade timing, risk management, and strategy confidence across any trading style.

Developing multi-module Expert Advisors
MQL programming language allows implementing the concept of modular development of trading strategies. The article shows an example of developing a multi-module Expert Advisor consisting of separately compiled file modules.

CCI indicator. Upgrade and new features
In this article, I will consider the possibility of upgrading the CCI indicator. Besides, I will present a modification of the indicator.
Market Profile indicator
In this article, we will consider Market Profile indicator. We will find out what lies behind this name, try to understand its operation principles and have a look at its terminal version (MarketProfile).

Drawing Dial Gauges Using the CCanvas Class
We can find dial gauges in cars and airplanes, in industrial production and everyday life. They are used in all spheres which require quick response to behavior of a controlled value. This article describes the library of dial gauges for MetaTrader 5.

Building a Professional Trading System with Heikin Ashi (Part 1): Developing a custom indicator
This article is the first installment in a two-part series designed to impart practical skills and best practices for writing custom indicators in MQL5. Using Heikin Ashi as a working example, the article explores the theory behind Heikin Ashi charts, explains how Heikin Ashi candlesticks are calculated, and demonstrates their application in technical analysis. The centerpiece is a step-by-step guide to developing a fully functional Heikin Ashi indicator from scratch, with clear explanations to help readers understand what to code and why. This foundational knowledge sets the stage for Part Two, where we will build an expert advisor that trades based on Heikin Ashi logic.
A system of voice notifications for trade events and signals
Nowadays, voice assistants play a prominent role in human life, as we often use navigators, voice search and translators. In this article, I will try to develop a simple and user friendly system of voice notifications for various trade events, market states or signals generated by trading signals.

Using cloud storage services for data exchange between terminals
Cloud technologies are becoming more popular. Nowadays, we can choose between paid and free storage services. Is it possible to use them in trading? This article proposes a technology for exchanging data between terminals using cloud storage services.
Graphical Interfaces IV: Informational Interface Elements (Chapter 1)
At the current stage of development, the library for creating graphical interfaces contains a form and several controls that can be attached to it. It was mentioned before that one of the future articles would be dedicated to the multi-window mode. Now, we have everything ready for that and we will deal with it in the following chapter. In this chapter, we will write classes for creating the status bar and tooltip informational interface elements.

Price Action Analysis Toolkit Development (Part 27): Liquidity Sweep With MA Filter Tool
Understanding the subtle dynamics behind price movements can give you a critical edge. One such phenomenon is the liquidity sweep, a deliberate strategy that large traders, especially institutions, use to push prices through key support or resistance levels. These levels often coincide with clusters of retail stop-loss orders, creating pockets of liquidity that big players can exploit to enter or exit sizeable positions with minimal slippage.

Graphical Interfaces II: the Separation Line and Context Menu Elements (Chapter 2)
In this article we will create the separation line element. It will be possible to use it not only as an independent interface element but also as a part of many other elements. After that, we will have everything required for the development of the context menu class, which will be also considered in this article in detail. Added to that, we will introduce all necessary additions to the class, which is the base for storing pointers to all the elements of the graphical interface of the application.

Graphical Interfaces VIII: The Calendar Control (Chapter 1)
In the part VIII of the series of articles dedicated to creating graphical interfaces in MetaTrader, we will consider complex composite controls like calendars, tree view, and file navigator. Due to the large amount of information, there are separate articles written for every subject. The first chapter of this part describes the calendar control and its expanded version — a drop down calendar.

Econometric Approach to Analysis of Charts
This article describes the econometric methods of analysis, the autocorrelation analysis and the analysis of conditional variance in particular. What is the benefit of the approach described here? Use of the non-linear GARCH models allows representing the analyzed series formally from the mathematical point of view and creating a forecast for a specified number of steps.
Adaptive indicators
In this article, I will consider several possible approaches to creating adaptive indicators. Adaptive indicators are distinguished by the presence of feedback between the values of the input and output signals. This feedback allows the indicator to independently adjust to the optimal processing of financial time series values.
MQL5 Cookbook: Indicator Subwindow Controls - Scrollbar
Let's continue exploring various controls and this time turn our attention to scrollbar. Just like in the previous article entitled "MQL5 Cookbook: Indicator Subwindow Controls - Buttons", all operations will be performed in the indicator subwindow. Take a moment to read the above mentioned article as it provides a detailed description of working with events in the OnChartEvent() function, while this point will only be casually touched upon in this article. For illustrative purposes, this time around we will create a vertical scrollbar for a large list of all financial instrument properties that can be obtained using MQL5 resources.

Extending MQL5 Standard Library and Reusing Code
MQL5 Standard Library makes your life as a developer easier. Nevertheless, it does not implement all the needs of all developers in the world, so if you feel that you need some more custom stuff you can take a step further and extend. This article walks you through integrating MetaQuotes' Zig-Zag technical indicator into the Standard Library. We get inspired by MetaQuotes' design philosophy to achieve our goal.
Graphical Interfaces X: Word wrapping algorithm in the Multiline Text box (build 12)
We continue to develop the Multiline Text box control. This time our task is to implement an automatic word wrapping in case a text box width overflow occurs, or a reverse word wrapping of the text to the previous line if the opportunity arises.

Graphical Interfaces IX: The Color Picker Control (Chapter 1)
With this article we begin chapter nine of series of articles dedicated to creating graphical interfaces in MetaTrader trading terminals. It consists of two chapters where new elements of controls and interface, such as color picker, color button, progress bar and line chart are presented.

Graphical Interfaces I: Testing Library in Programs of Different Types and in the MetaTrader 4 Terminal (Chapter 5)
In the previous chapter of the first part of the series about graphical interfaces, the form class was enriched by methods which allowed managing the form by pressing its controls. In this article, we will test our work in different types of MQL program such as indicators and scripts. As the library was designed to be cross-platform so it could be used in all MetaTrader platforms, we will also test it in MetaTrader 4.

Decreasing Memory Consumption by Auxiliary Indicators
If an indicator uses values of many other indicators for its calculations, it consumes a lot of memory. The article describes several methods of decreasing the memory consumption when using auxiliary indicators. Saved memory allows increasing the number of simultaneously used currency pairs, indicators and strategies in the client terminal. It increases the reliability of trade portfolio. Such a simple care about technical resources of your computer can turn into money resources at your deposit.

Introduction to MQL5 (Part 12): A Beginner's Guide to Building Custom Indicators
Learn how to build a custom indicator in MQL5. With a project-based approach. This beginner-friendly guide covers indicator buffers, properties, and trend visualization, allowing you to learn step-by-step.
Graphical Interfaces X: Sorting, rebuilding the table and controls in the cells (build 11)
We continue to add new features to the rendered table: data sorting, managing the number of columns and rows, setting the table cell types to place controls into them.
Graphical Interfaces XI: Integrating the Standard Graphics Library (build 16)
A new version of the graphics library for creating scientific charts (the CGraphic class) has been presented recently. This update of the developed library for creating graphical interfaces will introduce a version with a new control for creating charts. Now it is even easier to visualize data of different types.
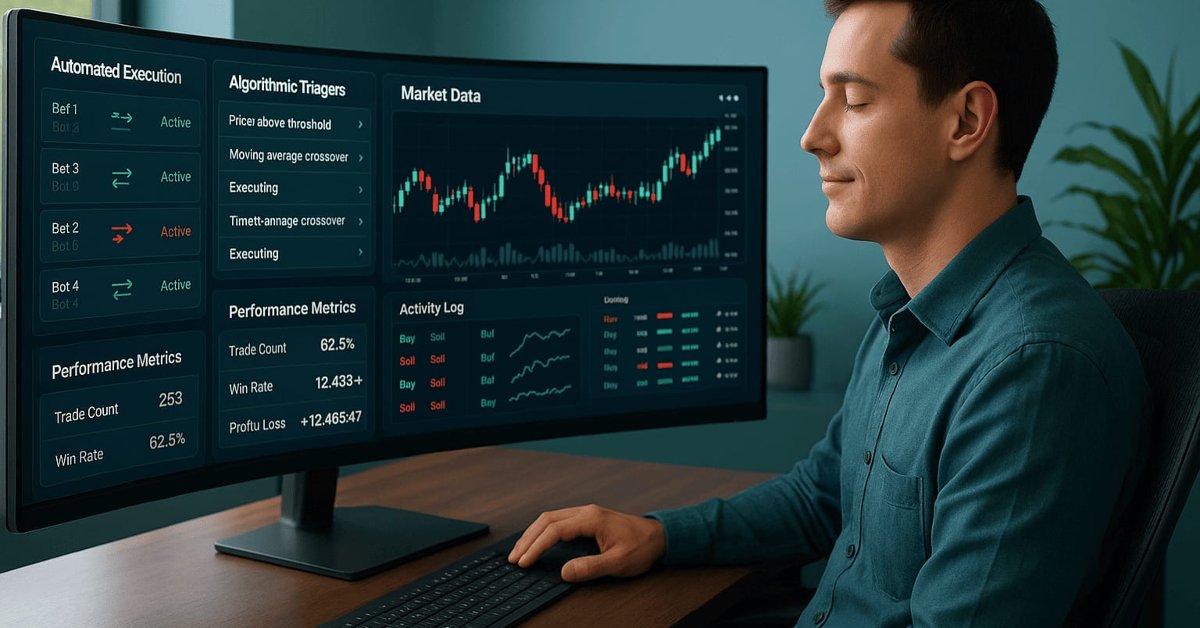
Advanced Order Execution Algorithms in MQL5: TWAP, VWAP, and Iceberg Orders
An MQL5 framework that brings institutional-grade execution algorithms (TWAP, VWAP, Iceberg) to retail traders through a unified execution manager and performance analyzer for smoother, more precise order slicing and analytics.
Graphical Interfaces V: The List View Element (Chapter 2)
In the previous chapter, we wrote classes for creating vertical and horizontal scrollbars. In this chapter, we will implement them. We will write a class for creating the list view element, a compound part of which will be a vertical scrollbar.
Price Action Analysis Toolkit Development (Part 32): Python Candlestick Recognition Engine (II) — Detection Using Ta-Lib
In this article, we’ve transitioned from manually coding candlestick‑pattern detection in Python to leveraging TA‑Lib, a library that recognizes over sixty distinct patterns. These formations offer valuable insights into potential market reversals and trend continuations. Follow along to learn more.
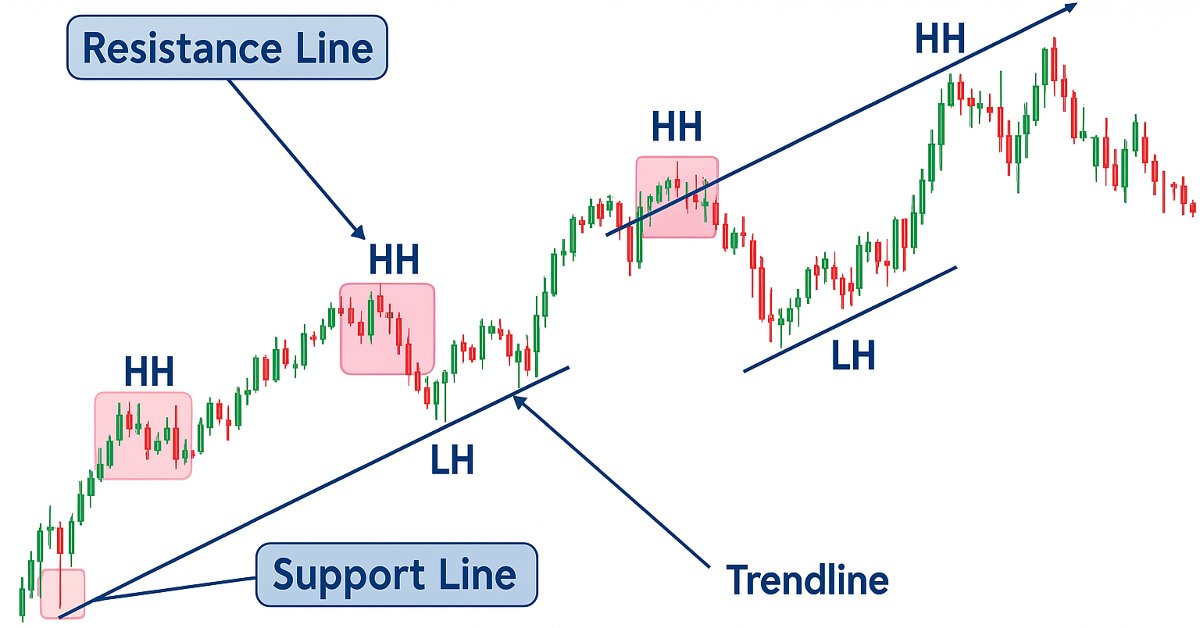
Price Action Analysis Toolkit Development (Part 19): ZigZag Analyzer
Every price action trader manually uses trendlines to confirm trends and spot potential turning or continuation levels. In this series on developing a price action analysis toolkit, we introduce a tool focused on drawing slanted trendlines for easy market analysis. This tool simplifies the process for traders by clearly outlining key trends and levels essential for effective price action evaluation.
Graphical Interfaces XI: Text edit boxes and Combo boxes in table cells (build 15)
In this update of the library, the Table control (the CTable class) will be supplemented with new options. The lineup of controls in the table cells is expanded, this time adding text edit boxes and combo boxes. As an addition, this update also introduces the ability to resize the window of an MQL application during its runtime.

The Principles of Economic Calculation of Indicators
Calls to user and technical indicators takes up very little space in the program code of automated trading systems. Often it’s simply a few code lines. But it often happens that it is these few lines of code which use up the largest portion of time, which needs to be spent on testing the Expert Advisor. Therefore, everything that is related to data calculations within an indicator, needs to be considered much more thoroughly than would seem at first glance. This article will talk precisely about this.
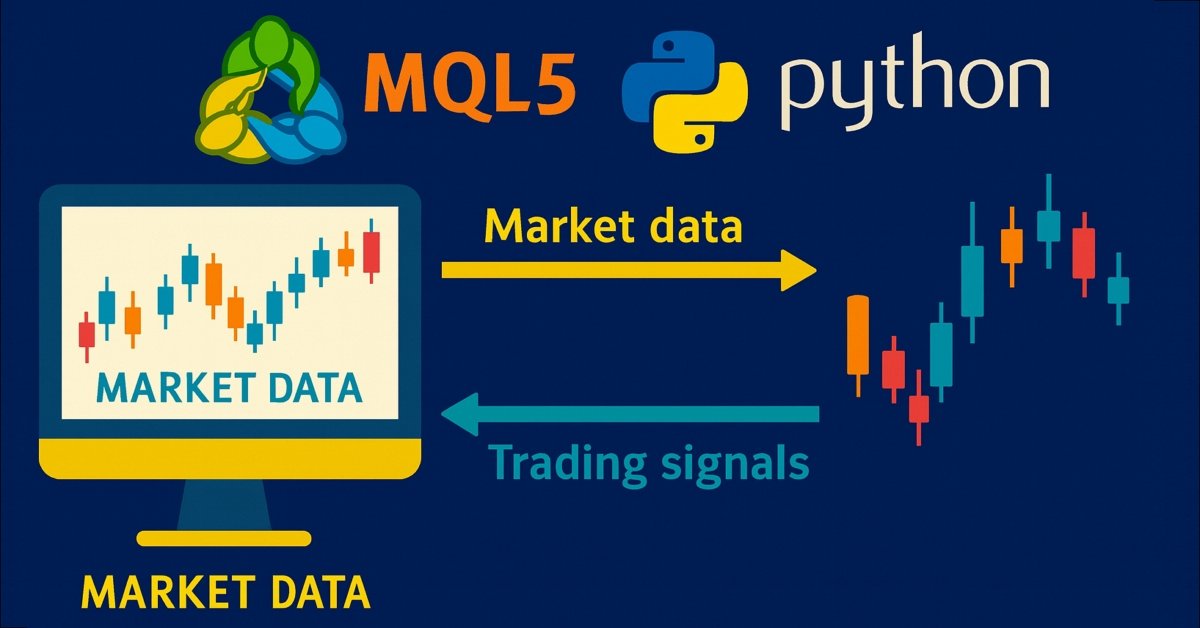
Price Action Analysis Toolkit Development (Part 36): Unlocking Direct Python Access to MetaTrader 5 Market Streams
Harness the full potential of your MetaTrader 5 terminal by leveraging Python’s data-science ecosystem and the official MetaTrader 5 client library. This article demonstrates how to authenticate and stream live tick and minute-bar data directly into Parquet storage, apply sophisticated feature engineering with Ta and Prophet, and train a time-aware Gradient Boosting model. We then deploy a lightweight Flask service to serve trade signals in real time. Whether you’re building a hybrid quant framework or enhancing your EA with machine learning, you’ll walk away with a robust, end-to-end pipeline for data-driven algorithmic trading.

Graphical Interfaces XI: Rendered controls (build 14.2)
In the new version of the library, all controls will be drawn on separate graphical objects of the OBJ_BITMAP_LABEL type. We will also continue to describe the optimization of code: changes in the core classes of the library will be discussed.

Price Action Analysis Toolkit Development (Part 51): Revolutionary Chart Search Technology for Candlestick Pattern Discovery
This article is intended for algorithmic traders, quantitative analysts, and MQL5 developers interested in enhancing their understanding of candlestick pattern recognition through practical implementation. It provides an in‑depth exploration of the CandlePatternSearch.mq5 Expert Advisor—a complete framework for detecting, visualizing, and monitoring classical candlestick formations in MetaTrader 5. Beyond a line‑by‑line review of the code, the article discusses architectural design, pattern detection logic, GUI integration, and alert mechanisms, illustrating how traditional price‑action analysis can be automated efficiently.

Practical Application Of Databases For Markets Analysis
Working with data has become the main task for modern software - both for standalone and network applications. To solve this problem a specialized software were created. These are Database Management Systems (DBMS), that can structure, systematize and organize data for their computer storage and processing. As for trading, the most of analysts don't use databases in their work. But there are tasks, where such a solution would have to be handy. This article provides an example of indicators, that can save and load data from databases both with client-server and file-server architectures.

Price Action Analysis Toolkit Development (Part 1): Chart Projector
This project aims to leverage the MQL5 algorithm to develop a comprehensive set of analysis tools for MetaTrader 5. These tools—ranging from scripts and indicators to AI models and expert advisors—will automate the market analysis process. At times, this development will yield tools capable of performing advanced analyses with no human involvement and forecasting outcomes to appropriate platforms. No opportunity will ever be missed. Join me as we explore the process of building a robust market analysis custom tools' chest. We will begin by developing a simple MQL5 program that I have named, Chart Projector.

Graphical Interfaces II: Setting Up the Event Handlers of the Library (Chapter 3)
The previous articles contain the implementation of the classes for creating constituent parts of the main menu. Now, it is time to take a close look at the event handlers in the principle base classes and in the classes of the created controls. We will also pay special attention to managing the state of the chart depending on the location of the mouse cursor.
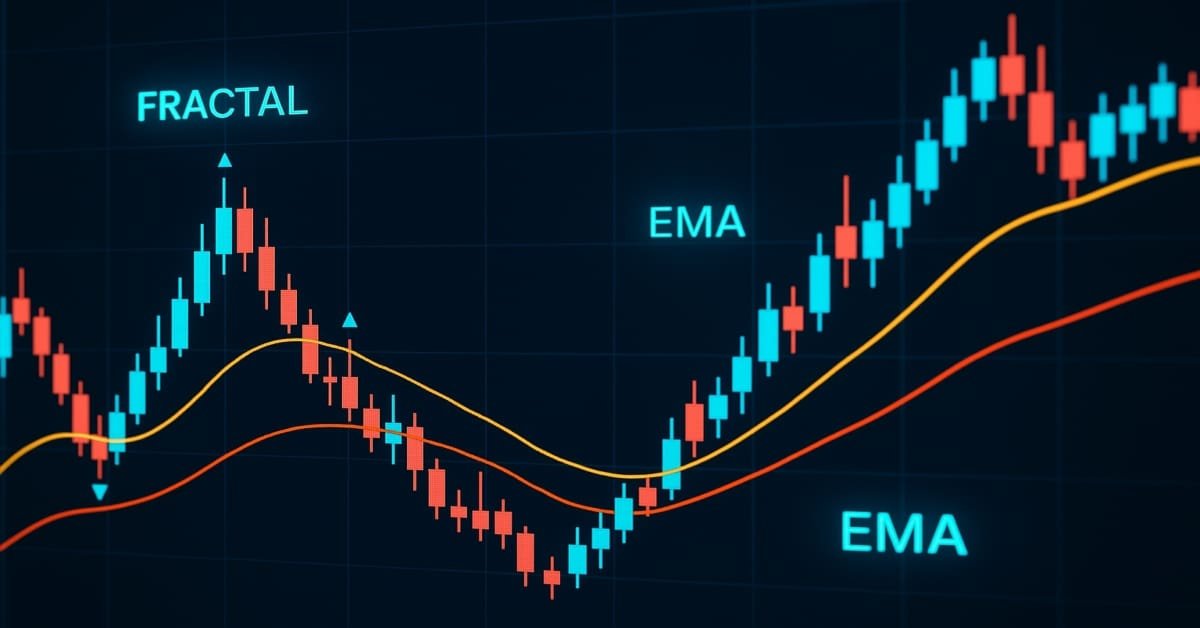
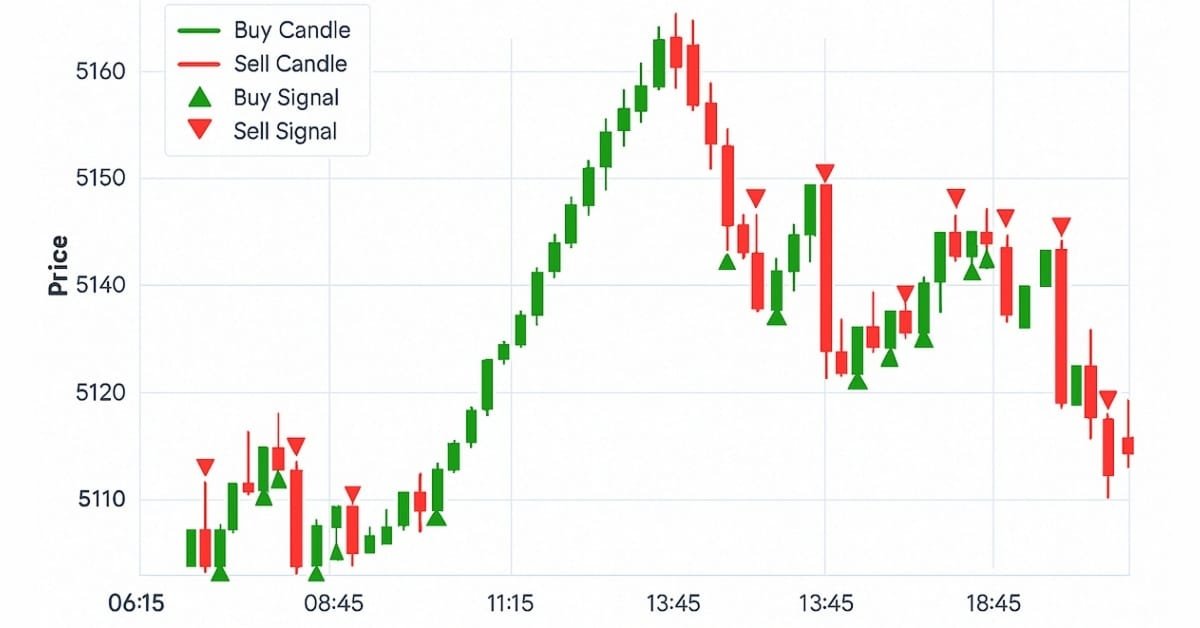
Price Action Analysis Toolkit Development (Part 25): Dual EMA Fractal Breaker
Price action is a fundamental approach for identifying profitable trading setups. However, manually monitoring price movements and patterns can be challenging and time-consuming. To address this, we are developing tools that analyze price action automatically, providing timely signals whenever potential opportunities are detected. This article introduces a robust tool that leverages fractal breakouts alongside EMA 14 and EMA 200 to generate reliable trading signals, helping traders make informed decisions with greater confidence.

Price Action Analysis Toolkit Development (Part 3): Analytics Master — EA
Moving from a simple trading script to a fully functioning Expert Advisor (EA) can significantly enhance your trading experience. Imagine having a system that automatically monitors your charts, performs essential calculations in the background, and provides regular updates every two hours. This EA would be equipped to analyze key metrics that are crucial for making informed trading decisions, ensuring that you have access to the most current information to adjust your strategies effectively.

Graphical Interfaces VIII: the File Navigator Control (Chapter 3)
In the previous chapters of the eighth part of the series, our library has been reinforced by several classes for developing mouse pointers, calendars and tree views. The current article deals with the file navigator control that can also be used as part of an MQL application graphical interface.
Indicators with on-chart interactive controls
The article offers a new perspective on indicator interfaces. I am going to focus on convenience. Having tried dozens of different trading strategies over the years, as well as having tested hundreds of different indicators, I have come to some conclusions I want to share with you in this article.