MQL5 Programming Articles
Study the MQL5 language for programming trading strategies in numerous published articles mostly written by you - the community members. The articles are grouped into categories to help you quicker find answers to any questions related to programming: Integration, Tester, Trading Strategies, etc.
Follow our new publications and discuss them on the Forum!
Add a new article

You are missing trading opportunities:
- Free trading apps
- Over 8,000 signals for copying
- Economic news for exploring financial markets
Registration
Log in
You agree to website policy and terms of use
If you do not have an account, please register

Developing a trading Expert Advisor from scratch (Part 18): New order system (I)
This is the first part of the new order system. Since we started documenting this EA in our articles, it has undergone various changes and improvements while maintaining the same on-chart order system model.


Statistical Estimations
Estimation of statistical parameters of a sequence is very important, since most of mathematical models and methods are based on different assumptions. For example, normality of distribution law or dispersion value, or other parameters. Thus, when analyzing and forecasting of time series we need a simple and convenient tool that allows quickly and clearly estimating the main statistical parameters. The article shortly describes the simplest statistical parameters of a random sequence and several methods of its visual analysis. It offers the implementation of these methods in MQL5 and the methods of visualization of the result of calculations using the Gnuplot application.

Graphical Interfaces XI: Rendered controls (build 14.2)
In the new version of the library, all controls will be drawn on separate graphical objects of the OBJ_BITMAP_LABEL type. We will also continue to describe the optimization of code: changes in the core classes of the library will be discussed.

Using Discriminant Analysis to Develop Trading Systems
When developing a trading system, there usually arises a problem of selecting the best combination of indicators and their signals. Discriminant analysis is one of the methods to find such combinations. The article gives an example of developing an EA for market data collection and illustrates the use of the discriminant analysis for building prognostic models for the FOREX market in Statistica software.

Graphical Interfaces VIII: The Tree View Control (Chapter 2)
The previous chapter of part VIII on graphical interfaces has focused on the elements of static and drop-down calendar. The second chapter will be dedicated to an equally complex element — a tree view, that is included in every complete library used for creating graphical interfaces. A tree view implemented in this article contains multiple flexible settings and modes, thus allowing to adjust this element of control to your needs.

Developing a trading Expert Advisor from scratch (Part 31): Towards the future (IV)
We continue to remove separate parts from our EA. This is the last article within this series. And the last thing to be removed is the sound system. This can be a bit confusing if you haven't followed these article series.

Trader-friendly stop loss and take profit
Stop loss and take profit can have a significant impact on trading results. In this article, we will look at several ways to find optimal stop order values.

Brute force approach to pattern search (Part II): Immersion
In this article we will continue discussing the brute force approach. I will try to provide a better explanation of the pattern using the new improved version of my application. I will also try to find the difference in stability using different time intervals and timeframes.

Creating an EA that works automatically (Part 06): Account types (I)
Today we'll see how to create an Expert Advisor that simply and safely works in automatic mode. Our EA in its current state can work in any situation but it is not yet ready for automation. We still have to work on a few points.

Tracing, Debugging and Structural Analysis of Source Code
The entire complex of problems of creating a structure of an executed code and its tracing can be solved without serious difficulties. This possibility has appeared in MetaTrader 5 due to the new feature of the MQL5 language - automatic creation of variables of complex type of data (structures and classes) and their elimination when going out of local scope. The article contains the description of the methodology and the ready-made tool.
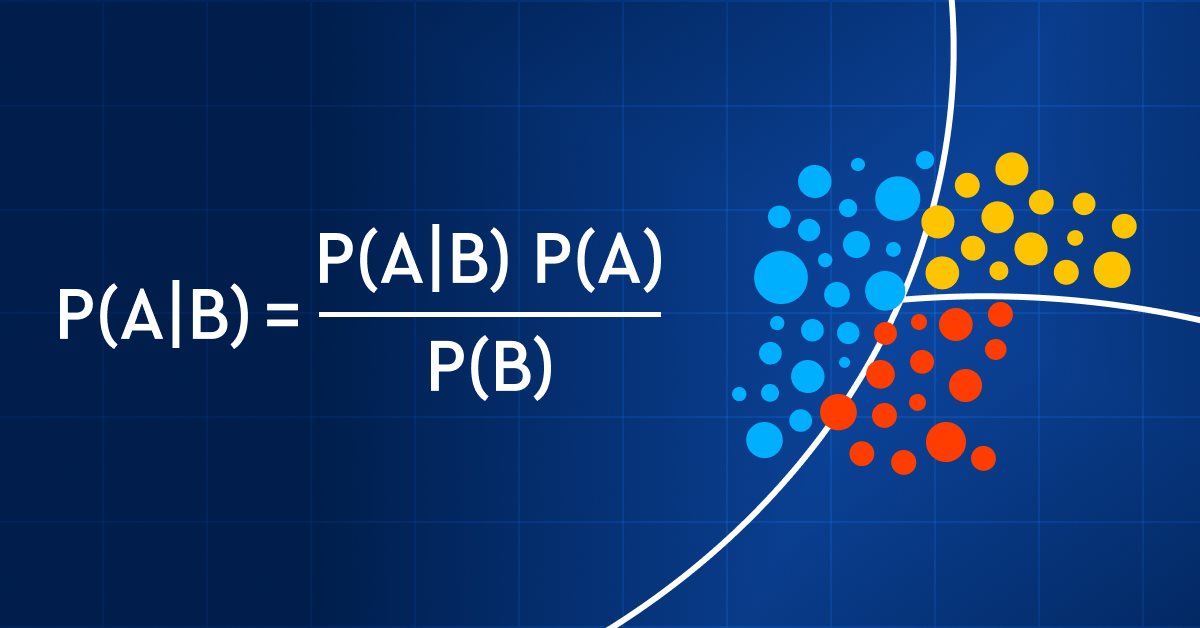
Data Science and Machine Learning (Part 11): Naïve Bayes, Probability theory in Trading
Trading with probability is like walking on a tightrope - it requires precision, balance, and a keen understanding of risk. In the world of trading, the probability is everything. It's the difference between success and failure, profit and loss. By leveraging the power of probability, traders can make informed decisions, manage risk effectively, and achieve their financial goals. So, whether you're a seasoned investor or a novice trader, understanding probability is the key to unlocking your trading potential. In this article, we'll explore the exciting world of trading with probability and show you how to take your trading game to the next level.
Interview with Juan Pablo Alonso Escobar (ATC 2012)
"Everyone who is struggling with programming and who were not able to participate in this year's competition, know that it becomes a lot easier in time", said Juan Pablo Alonso Escobar (JPAlonso), the hero of today's interview.

Optimal approach to the development and analysis of trading systems
In this article, I will show the criteria to be used when selecting a system or a signal for investing your funds, as well as describe the optimal approach to the development of trading systems and highlight the importance of this matter in Forex trading.
Graphics in DoEasy library (Part 94): Moving and deleting composite graphical objects
In this article, I will start the development of various composite graphical object events. We will also partially consider moving and deleting a composite graphical object. In fact, here I am going to fine-tune the things I implemented in the previous article.

Revisiting an Old Trend Trading Strategy: Two Stochastic oscillators, a MA and Fibonacci
Old trading strategies. This article presents one of the strategies used to follow the trend in a purely technical way. The strategy is purely technical and uses a few technical indicators and tools to deliver signals and targets. The components of the strategy are as follows: A 14-period stochastic oscillator. A 5-period stochastic oscillator. A 200-period moving average. A Fibonacci projection tool (for target setting).
Graphics in DoEasy library (Part 89): Programming standard graphical objects. Basic functionality
Currently, the library is able to track standard graphical objects on the client terminal chart, including their removal and modification of some of their parameters. At the moment, it lacks the ability to create standard graphical objects from custom programs.
Other classes in DoEasy library (Part 70): Expanding functionality and auto updating the chart object collection
In this article, I will expand the functionality of chart objects and arrange navigation through charts, creation of screenshots, as well as saving and applying templates to charts. Also, I will implement auto update of the collection of chart objects, their windows and indicators within them.

Filtering Signals Based on Statistical Data of Price Correlation
Is there any correlation between the past price behavior and its future trends? Why does the price repeat today the character of its previous day movement? Can the statistics be used to forecast the price dynamics? There is an answer, and it is positive. If you have any doubt, then this article is for you. I'll tell how to create a working filter for a trading system in MQL5, revealing an interesting pattern in price changes.
Prices in DoEasy library (part 60): Series list of symbol tick data
In this article, I will create the list for storing tick data of a single symbol and check its creation and retrieval of required data in an EA. Tick data lists that are individual for each used symbol will further constitute a collection of tick data.

Neural networks made easy (Part 13): Batch Normalization
In the previous article, we started considering methods aimed at improving neural network training quality. In this article, we will continue this topic and will consider another approach — batch data normalization.
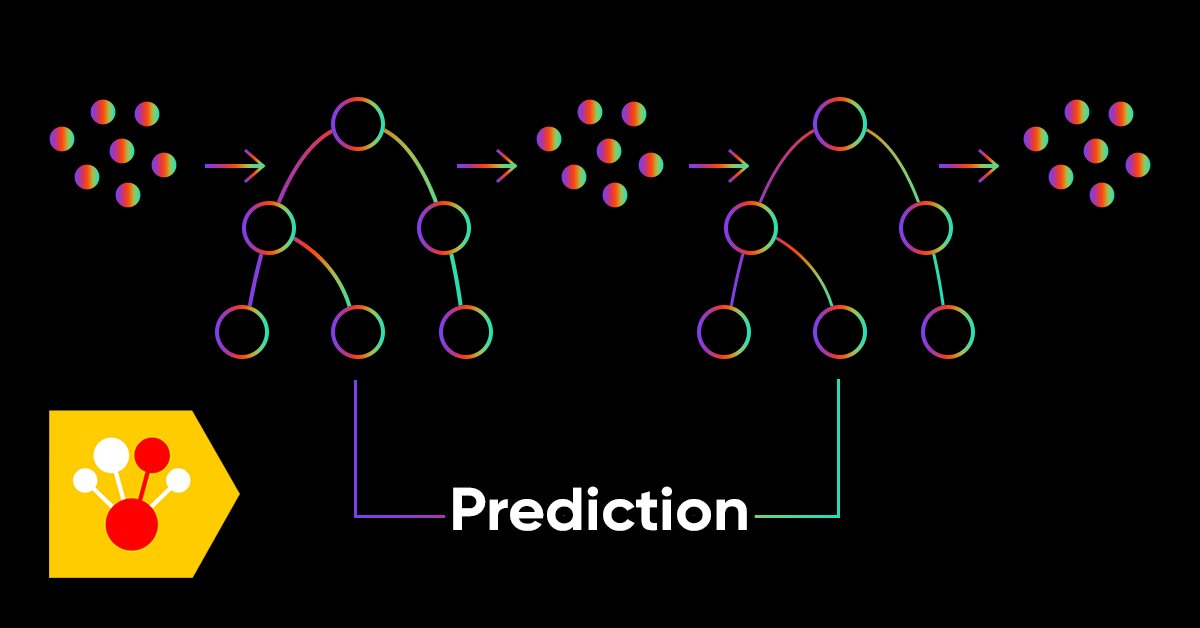
Gradient boosting in transductive and active machine learning
In this article, we will consider active machine learning methods utilizing real data, as well discuss their pros and cons. Perhaps you will find these methods useful and will include them in your arsenal of machine learning models. Transduction was introduced by Vladimir Vapnik, who is the co-inventor of the Support-Vector Machine (SVM).
Calculation of Integral Characteristics of Indicator Emissions
Indicator emissions are a little-studied area of market research. Primarily, this is due to the difficulty of analysis that is caused by the processing of very large arrays of time-varying data. Existing graphical analysis is too resource intensive and has therefore triggered the development of a parsimonious algorithm that uses time series of emissions. This article demonstrates how visual (intuitive image) analysis can be replaced with the study of integral characteristics of emissions. It can be of interest to both traders and developers of automated trading systems.
Library for easy and quick development of MetaTrader programs (part IX): Compatibility with MQL4 - Preparing data
In the previous articles, we started creating a large cross-platform library simplifying the development of programs for MetaTrader 5 and MetaTrader 4 platforms. In the eighth part, we implemented the class for tracking order and position modification events. Here, we will improve the library by making it fully compatible with MQL4.
Graphics in DoEasy library (Part 80): "Geometric animation frame" object class
In this article, I will optimize the code of classes from the previous articles and create the geometric animation frame object class allowing us to draw regular polygons with a given number of vertices.

MQL5 Programming Basics: Global Variables of the Terminal
This article highlights object-oriented capabilities of the MQL5 language for creating objects facilitating work with global variables of the terminal. As a practical example I consider a case when global variables are used as control points for implementation of program stages.

Learn how to design a trading system by Gator Oscillator
A new article in our series about learning how to design a trading system based on popular technical indicators will be about the Gator Oscillator technical indicator and how to create a trading system through simple strategies.

Magic of time trading intervals with Frames Analyzer tool
What is Frames Analyzer? This is a plug-in module for any Expert Advisor for analyzing optimization frames during parameter optimization in the strategy tester, as well as outside the tester, by reading an MQD file or a database that is created immediately after parameter optimization. You will be able to share these optimization results with other users who have the Frames Analyzer tool to discuss the results together.

Jeremy Scott - Successful MQL5 Market Seller
Jeremy Scott who is better known under Johnnypasado nickname at MQL5.community became famous offering products in our MQL5 Market service. Jeremy has already made several thousands of dollars in the Market and that is not the limit. We decided to take a closer look at the future millionaire and receive some pieces of advice for MQL5 Market sellers.
Library for easy and quick development of MetaTrader programs (part VI): Netting account events
In the previous articles, we started creating a large cross-platform library simplifying the development of programs for MetaTrader 5 and MetaTrader 4 platforms. In the fifth part of the article series, we created trading event classes and the event collection, from which the events are sent to the base object of the Engine library and the control program chart. In this part, we will let the library to work on netting accounts.

Simple Mean Reversion Trading Strategy
Mean reversion is a type of contrarian trading where the trader expects the price to return to some form of equilibrium which is generally measured by a mean or another central tendency statistic.

Developing a Replay System — Market simulation (Part 03): Adjusting the settings (I)
Let's start by clarifying the current situation, because we didn't start in the best way. If we don't do it now, we'll be in trouble soon.

Population optimization algorithms: Particle swarm (PSO)
In this article, I will consider the popular Particle Swarm Optimization (PSO) algorithm. Previously, we discussed such important characteristics of optimization algorithms as convergence, convergence rate, stability, scalability, as well as developed a test stand and considered the simplest RNG algorithm.

Data Science and Machine Learning (Part 04): Predicting Current Stock Market Crash
In this article I am going to attempt to use our logistic model to predict the stock market crash based upon the fundamentals of the US economy, the NETFLIX and APPLE are the stocks we are going to focus on, Using the previous market crashes of 2019 and 2020 let's see how our model will perform in the current dooms and glooms.

A Library for Constructing a Chart via Google Chart API
The construction of various types of diagrams is an essential part of the analyses of the market situation and the testing of a trading system. Frequently, in order to construct a nice looking diagram, it is necessary to organize the data output into a file, after which it is used in applications such as MS Excel. This is not very convenient and deprives us of the ability to dynamically update the data. Google Charts API provided the means for creating charts in online modes, by sending a special request to the server. In this article we attempt to automate the process of creating such a request and obtaining a chart from the Google server.
Prices in DoEasy library (part 62): Updating tick series in real time, preparation for working with Depth of Market
In this article, I will implement updating tick data in real time and prepare the symbol object class for working with Depth of Market (DOM itself is to be implemented in the next article).

Indicators with on-chart interactive controls
The article offers a new perspective on indicator interfaces. I am going to focus on convenience. Having tried dozens of different trading strategies over the years, as well as having tested hundreds of different indicators, I have come to some conclusions I want to share with you in this article.

Learn how to design a trading system by Bill Williams' MFI
This is a new article in the series in which we learn how to design a trading system based on popular technical indicators. This time we will cover Bill Williams' Market Facilitation Index (BW MFI).

Timeseries in DoEasy library (part 58): Timeseries of indicator buffer data
In conclusion of the topic of working with timeseries organise storage, search and sort of data stored in indicator buffers which will allow to further perform the analysis based on values of the indicators to be created on the library basis in programs. The general concept of all collection classes of the library allows to easily find necessary data in the corresponding collection. Respectively, the same will be possible in the class created today.

Universal regression model for market price prediction (Part 2): Natural, technological and social transient functions
This article is a logical continuation of the previous one. It highlights the facts that confirm the conclusions made in the first article. These facts were revealed within ten years after its publication. They are centered around three detected dynamic transient functions describing the patterns in market price changes.

Building an Interactive Application to Display RSS Feeds in MetaTrader 5
In this article we look at the possibility of creating an application for the display of RSS feeds. The article will show how aspects of the Standard Library can be used to create interactive programs for MetaTrader 5.