
MQL5 Cookbook: Writing the History of Deals to a File and Creating Balance Charts for Each Symbol in Excel
Introduction
When communicating in various forums, I often used examples of my test results displayed as screenshots of Microsoft Excel charts. I have many times been asked to explain how such charts can be created. Excel offers ample features for creating charts and there are lots of books on that subject. To find the required information in a book, one may have to read it all. Now finally, I have some time to explain it all in this article.
In the previous two articles MQL5 Cookbook: Multi-Currency Expert Advisor - Simple, Neat and Quick Approach and MQL5 Cookbook: Developing a Multi-Currency Expert Advisor with Unlimited Number of Parameters we dealt with the development of multi-currency EAs in MQL5. We know that the test results in MetaTrader 5 are displayed as a general Balance/Equity curve, i.e. if you need to view the results for each symbol separately, you should again and again go to external parameters of the Expert Advisor to disable all the symbols except for the one whose results are required and then run the test again. This is inconvenient.
So today I will show you a simple method of how you can get balance charts for all the symbols along with the cumulative result of a multi-currency Expert Advisor on a single Excel diagram with just a couple of clicks. To reconstruct the example, we will take the multi-currency Expert Advisor from the previous article. It will be enhanced with a function that will write the history of deals and balance curves for all symbols to a .csv file upon completion of the test. Moreover, we will add another column to the report to show drawdowns from all local maxima.
Let's create an Excel book set up so as to be able to connect the data file. The book can be opened all the time, so it will not need to be closed before running another test. Upon completion of the test, you will only need to refresh the data by pressing a certain key to be able to see the changes in the report and on the chart.
Expert Advisor Development
There won't be any significant changes in our EA, we will just add a few functions. Let's start by adding the structure and the array for symbol balances to the main file.
//--- Arrays for balances
struct Balance
  {
   double            balance[];
  };
//--- Array of balances for all symbols
Balance symbol_balance[];
Then, we create the separate Report.mqh include file for functions that generate test reports and include it in the main file of the Expert Advisor (see the highlighted line in the code below):
//--- Include custom libraries
#include "Include/Auxiliary.mqh"
#include "Include/Enums.mqh"
#include "Include/Errors.mqh"
#include "Include/FileFunctions.mqh"
#include "Include/InitializeArrays.mqh"
#include "Include/Report.mqh"
#include "Include/ToString.mqh"
#include "Include/TradeFunctions.mqh"
#include "Include/TradeSignals.mqh"
Let's first create a deal property structure, like the one we already have in the project for position and symbol properties. To do this, we add the enumeration of property identifiers to the Enums.mqh file:
//+------------------------------------------------------------------+
//| Enumeration of deal properties                                   |
//+------------------------------------------------------------------+
enum ENUM_DEAL_PROPERTIES
  {
   D_SYMBOL     = 0, // Deal symbol
   D_COMMENT    = 1, // Deal comment
   D_TYPE       = 2, // Deal type
   D_ENTRY      = 3, // Deal entry - entry in, entry out, reverse
   D_PRICE      = 4, // Deal price
   D_PROFIT     = 5, // Deal result (profit/loss)
   D_VOLUME     = 6, // Deal volume
   D_SWAP       = 7, // Cumulative swap on close
   D_COMMISSION = 8, // Deal commission
   D_TIME       = 9, // Deal time
   D_ALL        = 10 // All of the above mentioned deal properties
  };
Further, in the Report.mqh file we create the deal property structure and the GetHistoryDealProperties() function that returns a deal property. The function accepts two parameters: deal ticket and property identifier.
Below, you can see the code of the structure and the GetHistoryDealProperties() function:
//--- Deal properties in the history
struct HistoryDealProperties
  {
   string            symbol;     // Symbol
   string            comment;    // Comment
   ENUM_DEAL_TYPE    type;       // Deal type
   ENUM_DEAL_ENTRY   entry;      // Direction
   double            price;      // Price
   double            profit;     // Profit/Loss
   double            volume;     // Volume
   double            swap;       // Swap
   double            commission; // Commission
   datetime          time;       // Time
  };
//--- Variable of deal properties
HistoryDealProperties  deal;
//+------------------------------------------------------------------+
//| Gets deal properties by ticket                                   |
//+------------------------------------------------------------------+
void GetHistoryDealProperties(ulong ticket_number,ENUM_DEAL_PROPERTIES history_deal_property)
  {
   switch(history_deal_property)
     {
      case D_SYMBOL     : deal.symbol=HistoryDealGetString(ticket_number,DEAL_SYMBOL);                 break;
      case D_COMMENT    : deal.comment=HistoryDealGetString(ticket_number,DEAL_COMMENT);               break;
      case D_TYPE       : deal.type=(ENUM_DEAL_TYPE)HistoryDealGetInteger(ticket_number,DEAL_TYPE);    break;
      case D_ENTRY      : deal.entry=(ENUM_DEAL_ENTRY)HistoryDealGetInteger(ticket_number,DEAL_ENTRY); break;
      case D_PRICE      : deal.price=HistoryDealGetDouble(ticket_number,DEAL_PRICE);                   break;
      case D_PROFIT     : deal.profit=HistoryDealGetDouble(ticket_number,DEAL_PROFIT);                 break;
      case D_VOLUME     : deal.volume=HistoryDealGetDouble(ticket_number,DEAL_VOLUME);                 break;
      case D_SWAP       : deal.swap=HistoryDealGetDouble(ticket_number,DEAL_SWAP);                     break;
      case D_COMMISSION : deal.commission=HistoryDealGetDouble(ticket_number,DEAL_COMMISSION);         break;
      case D_TIME       : deal.time=(datetime)HistoryDealGetInteger(ticket_number,DEAL_TIME);          break;
      case D_ALL        :
         deal.symbol=HistoryDealGetString(ticket_number,DEAL_SYMBOL);
         deal.comment=HistoryDealGetString(ticket_number,DEAL_COMMENT);
         deal.type=(ENUM_DEAL_TYPE)HistoryDealGetInteger(ticket_number,DEAL_TYPE);
         deal.entry=(ENUM_DEAL_ENTRY)HistoryDealGetInteger(ticket_number,DEAL_ENTRY);
         deal.price=HistoryDealGetDouble(ticket_number,DEAL_PRICE);
         deal.profit=HistoryDealGetDouble(ticket_number,DEAL_PROFIT);
         deal.volume=HistoryDealGetDouble(ticket_number,DEAL_VOLUME);
         deal.swap=HistoryDealGetDouble(ticket_number,DEAL_SWAP);
         deal.commission=HistoryDealGetDouble(ticket_number,DEAL_COMMISSION);
         deal.time=(datetime)HistoryDealGetInteger(ticket_number,DEAL_TIME);                           break;
         //---
      default: Print("The passed deal property is not listed in the enumeration!");                          return;
     }
  }
We will also need several functions that will convert some deal properties to string values. These simple functions return a dash ("-") if the passed value is empty or zero. Let's write them in the ToString.mqh file:
//+------------------------------------------------------------------+
//| Returns the symbol name, otherwise - dash                        |
//+------------------------------------------------------------------+
string DealSymbolToString(string deal_symbol)
  {
   return(deal_symbol=="" ? "-" : deal_symbol);
  }
//+------------------------------------------------------------------+
//| Converts deal type to string                                     |
//+------------------------------------------------------------------+
string DealTypeToString(ENUM_DEAL_TYPE deal_type)
  {
   string str="";
//---
   switch(deal_type)
     {
      case DEAL_TYPE_BUY                      : str="buy";                      break;
      case DEAL_TYPE_SELL                     : str="sell";                     break;
      case DEAL_TYPE_BALANCE                  : str="balance";                  break;
      case DEAL_TYPE_CREDIT                   : str="credit";                   break;
      case DEAL_TYPE_CHARGE                   : str="charge";                   break;
      case DEAL_TYPE_CORRECTION               : str="correction";               break;
      case DEAL_TYPE_BONUS                    : str="bonus";                    break;
      case DEAL_TYPE_COMMISSION               : str="commission";               break;
      case DEAL_TYPE_COMMISSION_DAILY         : str="commission daily";         break;
      case DEAL_TYPE_COMMISSION_MONTHLY       : str="commission monthly";       break;
      case DEAL_TYPE_COMMISSION_AGENT_DAILY   : str="commission agent daily";   break;
      case DEAL_TYPE_COMMISSION_AGENT_MONTHLY : str="commission agent monthly"; break;
      case DEAL_TYPE_INTEREST                 : str="interest";                 break;
      case DEAL_TYPE_BUY_CANCELED             : str="buy canceled";             break;
      case DEAL_TYPE_SELL_CANCELED            : str="sell canceled";            break;
      //--- Unknown deal type
      default : str="unknown";
     }
//---
   return(str);
  }
//+------------------------------------------------------------------+
//| Converts direction of deal to string                             |
//+------------------------------------------------------------------+
string DealEntryToString(ENUM_DEAL_ENTRY deal_entry)
  {
   string str="";
//---
   switch(deal_entry)
     {
      case DEAL_ENTRY_IN    : str="in";            break;
      case DEAL_ENTRY_OUT   : str="out";           break;
      case DEAL_ENTRY_INOUT : str="in/out";        break;
      case DEAL_ENTRY_STATE : str="status record"; break;
      //--- Unknown direction type
      default : str="unknown";
     }
//---
   return(str);
  }
//+------------------------------------------------------------------+
//| Converts volume to string                                        |
//+------------------------------------------------------------------+
string DealVolumeToString(double deal_volume)
  {
   return(deal_volume<=0 ? "-" : DoubleToString(deal_volume,2));
  }
//+------------------------------------------------------------------+
//| Converts price to string                                         |
//+------------------------------------------------------------------+
string DealPriceToString(double deal_price,int digits)
  {
   return(deal_price<=0 ? "-" : DoubleToString(deal_price,digits));
  }
//+------------------------------------------------------------------+
//| Converts deal result to string                                   |
//+------------------------------------------------------------------+
string DealProfitToString(string deal_symbol,double deal_profit)
  {
   return((deal_profit==0 || deal_symbol=="") ? "-" : DoubleToString(deal_profit,2));
  }
//+------------------------------------------------------------------+
//| Converts swap to string                                          |
//+------------------------------------------------------------------+
string DealSwapToString(double deal_swap)
  {
   return(deal_swap<=0 ? "-" : DoubleToString(deal_swap,2));
  }
Now, everything is ready to write the CreateSymbolBalanceReport() function that prepares data for the report and writes it to the LastTest.csv file. It's pretty simple: first we write the header (note how the string is adjusted if the test was run for more than one symbol), then the required deal properties for the report are consecutively concatenated into string that is further written to the file.
Below is the code of the CreateSymbolBalanceReport() function:
//+------------------------------------------------------------------+
//| Creates the test report on deals in .csv format                  |
//+------------------------------------------------------------------+
void CreateSymbolBalanceReport()
  {
   int    file_handle =INVALID_HANDLE; // File handle
   string path        ="";             // File path

//--- If an error occurred when creating/getting the folder, exit
   if((path=CreateInputParametersFolder())=="")
      return;
//--- Create file to write data in the common folder of the terminal
   file_handle=FileOpen(path+"\\LastTest.csv",FILE_CSV|FILE_WRITE|FILE_ANSI|FILE_COMMON);
//--- If the handle is valid (file created/opened)
   if(file_handle>0)
     {
      int    digits          =0;   // Number of decimal places in the price
      int    deals_total     =0;   // Number of deals in the specified history
      ulong  ticket          =0;   // Deal ticket
      double drawdown_max    =0.0; // Maximum drawdown
      double balance         =0.0; // Balance
      //---
      string delimeter       =","; // Delimiter
      string string_to_write ="";  // To generate the string for writing

      //--- Generate the header string
      string headers="TIME,SYMBOL,DEAL TYPE,ENTRY TYPE,VOLUME,PRICE,SWAP($),PROFIT($),DRAWDOWN(%),BALANCE";
      //--- If more than one symbol is involved, modify the header string
      if(SYMBOLS_COUNT>1)
        {
         for(int s=0; s<SYMBOLS_COUNT; s++)
            StringAdd(headers,","+InputSymbols[s]);
        }
      //--- Write the report headers
      FileWrite(file_handle,headers);
      //--- Get the complete history
      HistorySelect(0,TimeCurrent());
      //--- Get the number of deals
      deals_total=HistoryDealsTotal();
      //--- Resize the array of balances according to the number of symbols
      ArrayResize(symbol_balance,SYMBOLS_COUNT);
      //--- Resize the array of deals for each symbol
      for(int s=0; s<SYMBOLS_COUNT; s++)
         ArrayResize(symbol_balance[s].balance,deals_total);
      //--- Iterate in a loop and write the data
      for(int i=0; i<deals_total; i++)
        {
         //--- Get the deal ticket
         ticket=HistoryDealGetTicket(i);
         //--- Get all the deal properties
         GetHistoryDealProperties(ticket,D_ALL);
         //--- Get the number of digits in the price
         digits=(int)SymbolInfoInteger(deal.symbol,SYMBOL_DIGITS);
         //--- Calculate the overall balance
         balance+=deal.profit+deal.swap+deal.commission;
         //--- Generate a string for writing via concatenation
         StringConcatenate(string_to_write,
                           deal.time,delimeter,
                           DealSymbolToString(deal.symbol),delimeter,
                           DealTypeToString(deal.type),delimeter,
                           DealEntryToString(deal.entry),delimeter,
                           DealVolumeToString(deal.volume),delimeter,
                           DealPriceToString(deal.price,digits),delimeter,
                           DealSwapToString(deal.swap),delimeter,
                           DealProfitToString(deal.symbol,deal.profit),delimeter,
                           MaxDrawdownToString(i,balance,max_drawdown),delimeter,
                           DoubleToString(balance,2));

         //--- If more than one symbol is involved, write their balance values
         if(SYMBOLS_COUNT>1)
           {
            //--- Iterate over all symbols
            for(int s=0; s<SYMBOLS_COUNT; s++)
              {
               //--- If the symbols are equal and the deal result is non-zero
               if(deal.symbol==InputSymbols[s] && deal.profit!=0)
                 {
                  //--- Display the deal in the balance for the corresponding symbol
                  //    Take into consideration swap and commission
                  symbol_balance[s].balance[i]=symbol_balance[s].balance[i-1]+
                                               deal.profit+
                                               deal.swap+
                                               deal.commission;
                  //--- Add to the string
                  StringAdd(string_to_write,","+DoubleToString(symbol_balance[s].balance[i],2));
                 }
               //--- Otherwise write the previous value
               else
                 {
                  //--- If the deal type is "Balance" (the first deal)
                  if(deal.type==DEAL_TYPE_BALANCE)
                    {
                     //--- the balance is the same for all symbols
                     symbol_balance[s].balance[i]=balance;
                     StringAdd(string_to_write,","+DoubleToString(symbol_balance[s].balance[i],2));
                    }
                  //--- Otherwise write the previous value to the current index
                  else
                    {
                     symbol_balance[s].balance[i]=symbol_balance[s].balance[i-1];
                     StringAdd(string_to_write,","+DoubleToString(symbol_balance[s].balance[i],2));
                    }
                 }
              }
           }
         //--- Write the generated string
         FileWrite(file_handle,string_to_write);
         //--- Mandatory zeroing out of the variable for the next string
         string_to_write="";
        }
      //--- Close the file
      FileClose(file_handle);
     }
//--- If the file could not be created/opened, print the appropriate message
   else
      Print("Error creating file: "+IntegerToString(GetLastError())+"");
  }
The MaxDrawdownToString() function highlighted in the code above calculates all drawdowns from local maxima and returns a string representation of time of the new local maximum. In all other cases the function returns a string containing "-" (a dash).
//+------------------------------------------------------------------+
//| Returns the maximum drawdown from the local maximum              |
//+------------------------------------------------------------------+
string MaxDrawdownToString(int deal_number,double balance,double &max_drawdown)
  {
//--- The string to be displayed in the report
   string str="";
//--- To calculate the local maximum and drawdown
   static double max=0.0;
   static double min=0.0;
//--- If this is the first deal
   if(deal_number==0)
     {
      //--- No drawdown yet
      max_drawdown=0.0;
      //--- Set the initial point as the local maximum
      max=balance;
      min=balance;
     }
   else
     {
      //--- If the current balance is greater than in the memory
      if(balance>max)
        {
         //--- calculate the drawdown using the previous values
         max_drawdown=100-((min/max)*100);
         //--- update the local maximum
         max=balance;
         min=balance;
        }
      else
        {
         //--- Return zero value of the drawdown
         max_drawdown=0.0;
         //--- Update the minimum
         min=fmin(min,balance);
        }
     }
//--- Determine the string for the report
   if(max_drawdown==0)
      str="-";
   else
      str=DoubleToString(max_drawdown,2);
//--- Return result
   return(str);
  }
So all the report generation functions are ready. We only need to see how we should use all of the above. This will require the OnTester() function called upon completion of testing. Make sure that you check the detailed description of this function in MQL5 Reference.
Simply write a few lines of code in the body of the OnTester() function to specify condition when the report should be generated. The corresponding code snippet is provided below:
//+------------------------------------------------------------------+
//| Handler of the event of testing completion                       |
//+------------------------------------------------------------------+
double OnTester()
  {
//--- Write the report only after testing
   if(IsTester() && !IsOptimization() && !IsVisualMode())
      //--- Generate the report and write it to the file
      CreateSymbolBalanceReport();
//---
   return(0.0);
  }
Now, if you run the Expert Advisor in the Strategy Tester, at the end of testing you will see a folder of the Expert Advisor created in the common terminals folder C:\ProgramData\MetaQuotes\Terminal\Common\Files. And the LastTest.csv report file will be generated in the folder of the Expert Advisor. If you open the file with Notepad, you'll see something like this:
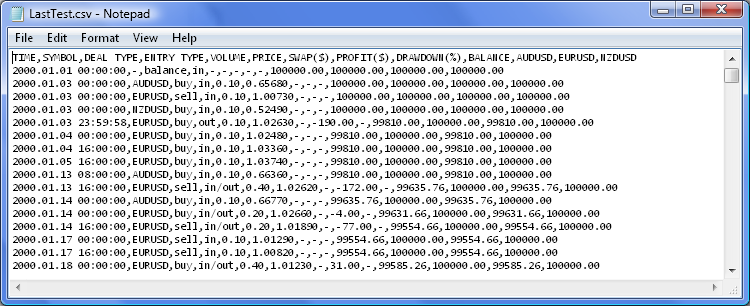
Figure 1. The report file in .csv format.
Creating Charts in Excel
We can open the created file in Excel and see that each data type is in a separate column. This way data appears much more convenient for viewing. At this point, we are technically ready to create charts and save the file as Excel book in *.xlsx format. However, if afterwards we run the test and open the book again, we will still see the old data.
If we try to refresh data, while the LastTest.csv file is already being used in Excel, the file will not be updated, since the Expert Advisor will not be able to open it for writing while it is being used by another application.
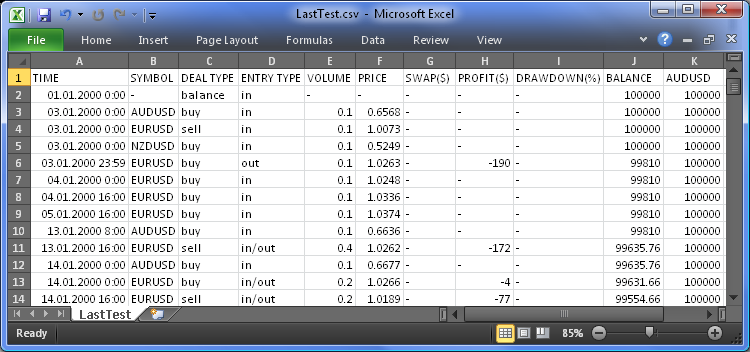
Figure 2. The report file in .csv format in Excel 2010.
There is a solution that can be used in our case. First create an Excel book in *.xlsx format in any folder you like. Then open it and go to the Data tab.

Figure 3. The Data tab in Excel 2010.
On the ribbon of this tab, select the From Text option. The Import Text File dialog will pop up where you need to select the "LastTest.csv" file. Select the file and click the Open button. The Text Import Wizard - Step 1 of 3 dialog will pop up as shown below:
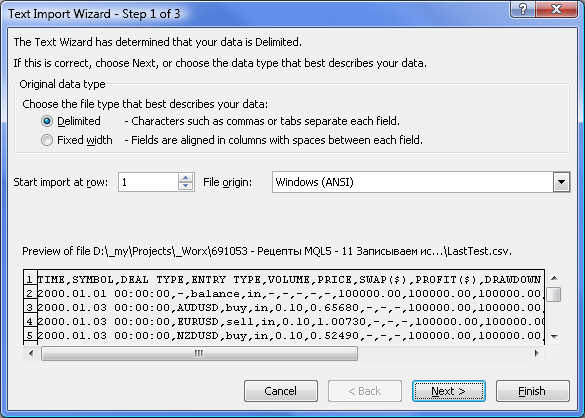
Figure 4. The "Text Import Wizard - Step 1 of 3" dialog.
Adjust settings as shown above and click Next >. Here, (Step 2 of 3) you need to specify the delimiter used in the data file. In our file, it is "," (Comma).
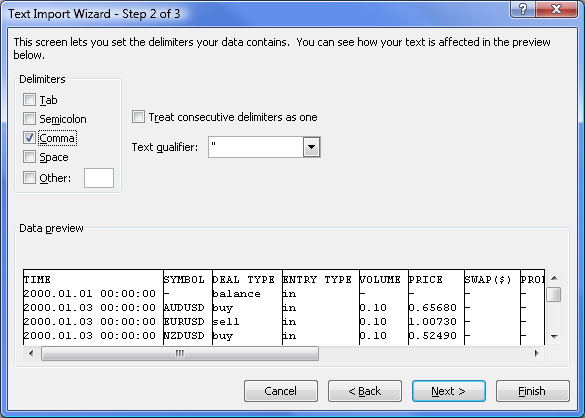
Figure 5. The "Text Import Wizard - Step 2 of 3" dialog.
Click Next > to advance to Text Import Wizard - Step 3 of 3. Here, leave the General as the data format for all the columns. You can change the format later on.
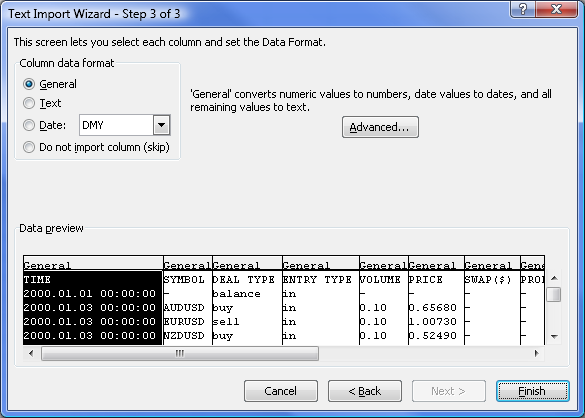
Figure 6. The "Text Import Wizard - Step 3 of 3" dialog.
After clicking the Finish button, the Import Data window will appear where you need to specify the worksheet and the cell for data import.
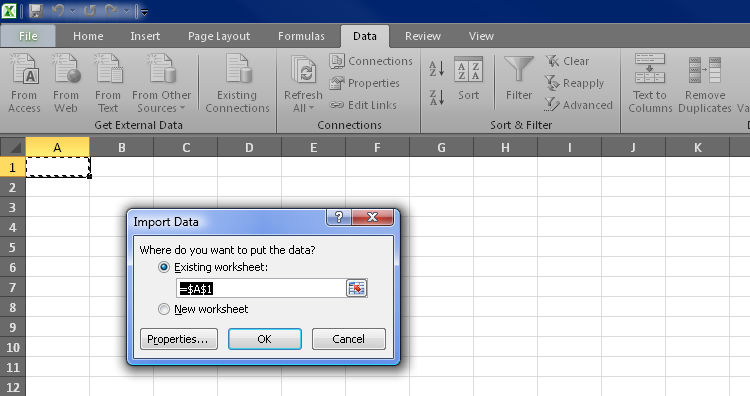
Figure 7. Selecting the cell for data import in Excel 2010.
Usually, we select the top left cell A1. Before clicking OK, click the Properties... button to set the external data range properties. You will see a dialog box as shown below.
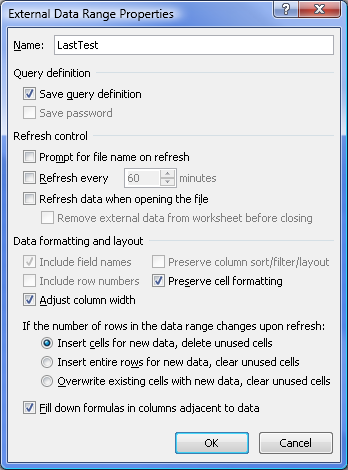
Figure 8. External Data Range Properties when importing data from text files in Excel 2010.
Adjust settings exactly as shown above and click OK in the current and subsequent window.
As a result, your data will appear just the same as if you had simply loaded the .csv file. But now you can run repeated tests in MetaTrader 5, without having to close the Excel book. All you need to do after running the test, is to simply refresh the data using Ctrl+Alt+F5 shortcut or the Refresh All button on the Data tab ribbon.
Using the Conditional Formatting options on the Home tab ribbon, you can set the required visual properties for data representation.
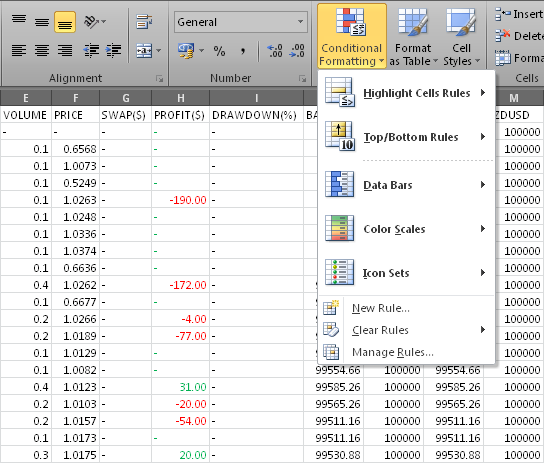
Figure 9. Conditional Formatting in Excel 2010.
Now we need to display the data on Excel charts. One chart will show all the balance charts and the other one will display all drawdowns from local maxima as a histogram.
Let's first create a diagram for the balance charts. Select the headers of all the balances and the whole data array top to bottom (while holding the Shift key, press the End key and then the Down Arrow key). Now on the Insert tab, select the desired chart type.
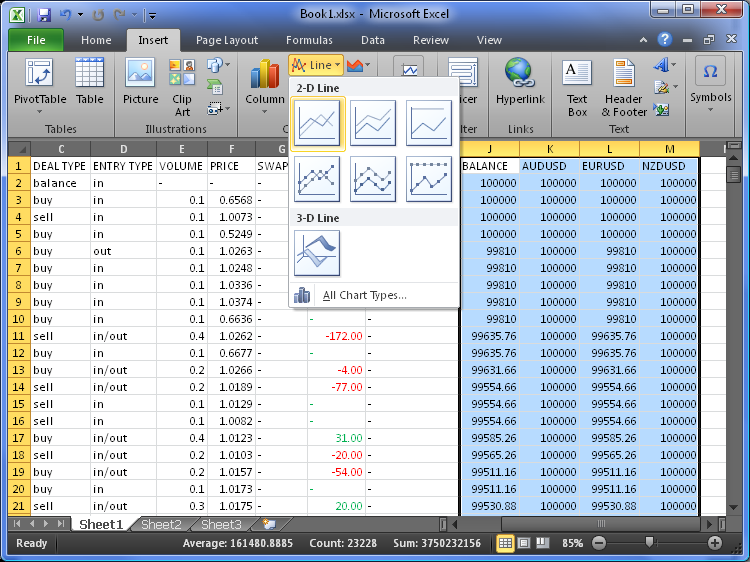
Figure 10. Selecting a chart type in Excel 2010.
As a result, the chart will be created which can be moved to another worksheet for convenience. To do this, simply select it and press Ctrl+X (Cut). Then go to the newly created worksheet, select the A1 cell and press Ctrl+V (Paste).
The created chart with default settings is shown in the image below:
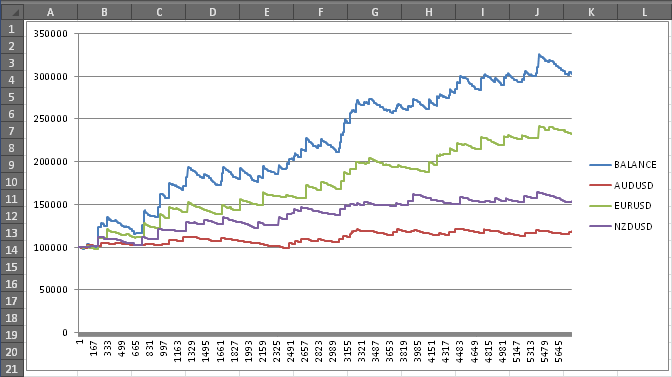
Figure 11. Look-and-feel of chart with default settings.
You can customize any element of the chart: change its size, color, style, etc.
In the image above, the horizontal axis shows the number of deals. Let's modify it so that it displays dates instead. For this purpose, right-click the chart and select the Select Data option from the context menu. The Select Data Source dialog will pop up. Click the Edit button, then select the required data range in the TIME column and click OK.
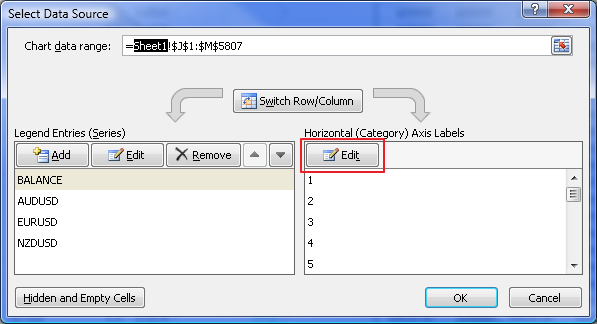
Figure 12. The "Select Data Source" dialog box.
Try to create the drawdowns chart on your own and place it under the first chart. Now their visual properties can be customized, if necessary. Personally, I usually do so:
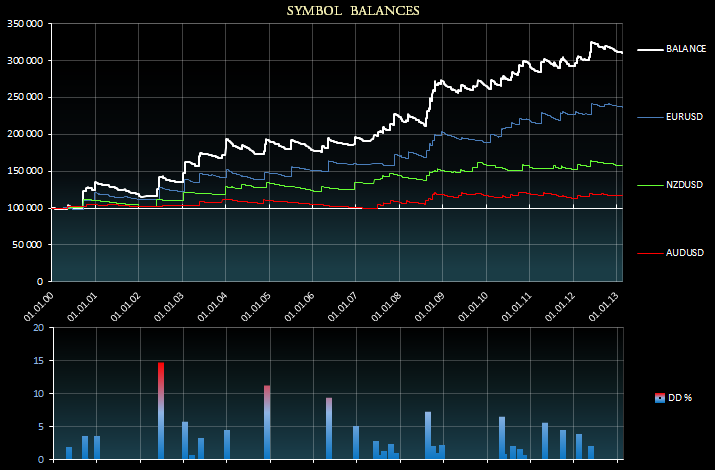
Figure 13. Customized charts in Excel 2010.
Conclusion
So, we have got the Excel charts with testing results that look fairly decent. In one of my future articles, I will show you how to create even more informative reports. Attached to the article is the downloadable archive with the files of the Expert Advisor for your consideration.
After extracting files from the archive, place the ReportInExcelfolder to the MetaTrader 5\MQL5\Experts directory. Further, the EventsSpy.mq5 indicator must be placed in the MetaTrader 5\MQL5\Indicators directory.
Translated from Russian by MetaQuotes Ltd.
Original article: https://www.mql5.com/ru/articles/651
 How Reliable is Night Trading?
 Money Management Revisited
 Building an Automatic News Trader
 Another MQL5 OOP Class
- Free trading apps
- Over 8,000 signals for copying
- Economic news for exploring financial markets
You agree to website policy and terms of use