
80-20 trading strategy
Introduction
'80-20' is a name of one of the trading strategies (TS) described in the book Street Smarts: High Probability Short-Term Trading Strategies by Linda Raschke and Laurence Connors. Similar to the strategies discussed in my previous article, the authors attribute it to the stage when the price tests the range borders. It is also focused on profiting from false breakouts and roll-backs from the borders. But this time, we analyze the price movement on a significantly shorter history interval involving the previous day only. The lifetime of an obtained signal is also relatively short, since the system is meant for intraday trading.
The first objective of the article is to describe the development of the '80-20' trading strategy signal module using MQL5 language. Then, we are going to connect this module to the slightly edited version of the basic trading robot developed in the previous article of the series. Besides, we are going to use the very same module for the development of an indicator for manual trading.
As already said, the code provided in the article series is aimed mainly at slightly advanced novice programmers. Therefore, besides its main objective, the code is designed to help move from the procedural programming to the object-oriented one. The code will not feature classes. Instead, it will fully implement structures that are easier to master.
Yet another objective of the article is to develop tools allowing us to check if the strategy is still viable today, since Raschke and Connors used the market behavior at the end of the last century when creating it. A few EA tests based on the up-to-date history data are presented at the end of the article.
'80-20' trading system
The authors name George Taylor's The Taylor Trading Technique, as well as Steve Moore's works on the computer analysis of futures markets and Derek Gipson's trading experience as theoretical basis for their own work. The essence of the trading strategy can be briefly described as follows: if the previous day's Open and Close prices are located at the opposite daily range areas, then the probability of a reversal towards the previous day's opening is very high today. The previous day's Open and Close prices should locate close to the range borders. The reversal should start the current day (not before the previous day's candle is closed). The strategy rules for buying are as follows:
1. Make sure that the market opened in the upper 20% and closed in the lower 20% of the daily range yesterday
2. Wait till today's Low breaks the previous day's one at least by 5 ticks
3. Place a buy pending order on the lower border of the yesterday's range
4. Once the pending order triggers, set its initial StopLoss at the day's Low
5. Use trailing stop to protect the obtained profit
Sell entry rules are similar, but the yesterday's bar should be bullish, a buy order should be located at the upper border of the bar, while StopLoss should be placed at the today's High.
Yet another important detail is a size of a closed daily bar. According to Linda Raschke, it should be large enough - more than the average size of daily bars. However, she does not specify how many history days should be taken into consideration when calculating the average daily range.
We should also keep in mind that the TS is designed exclusively for intraday trading — examples shown in the book use M15 charts.
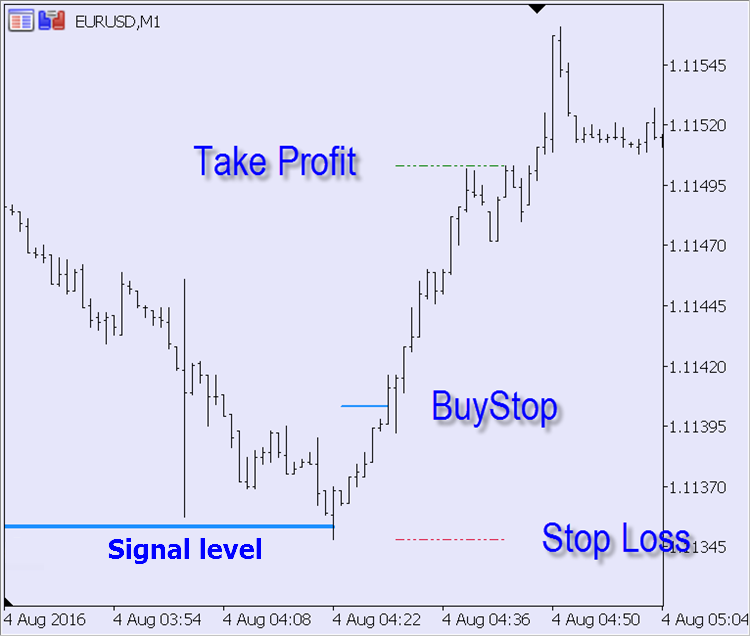
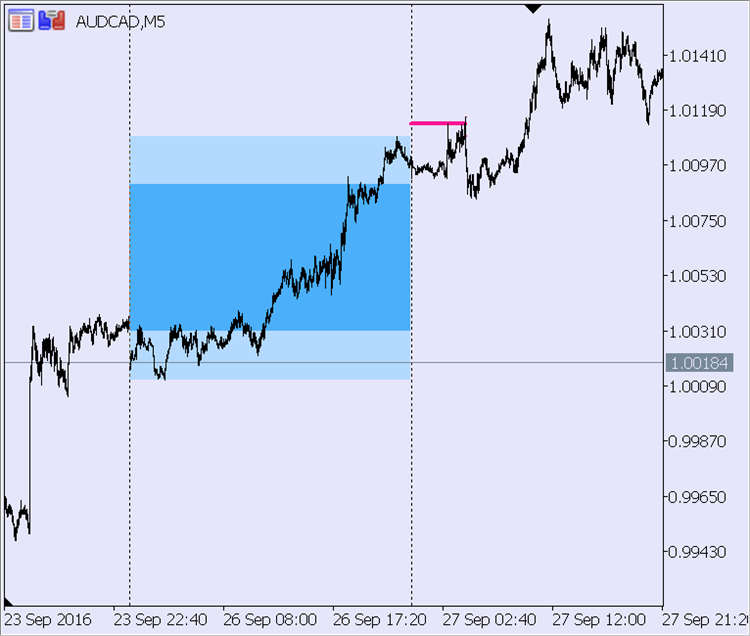
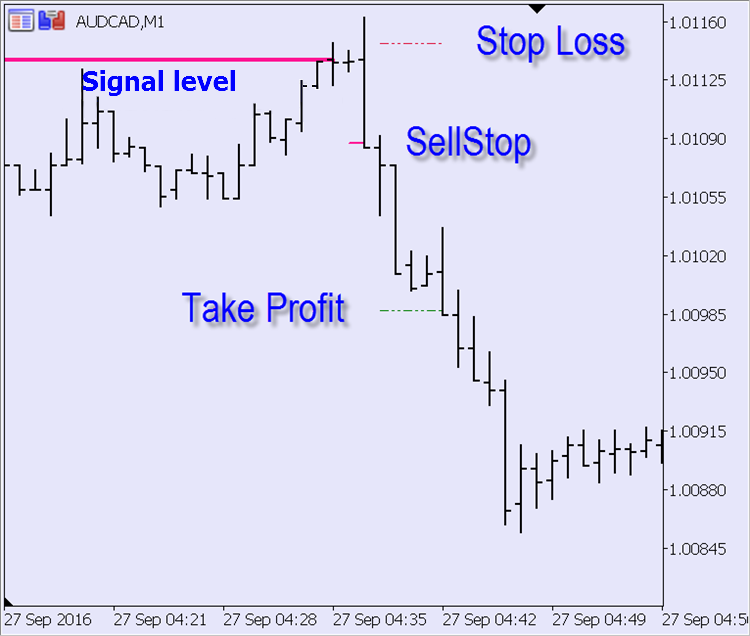
The signal block and the indicator making a layout according to the strategy are described below. You can also see a few screenshots with the indicator operation results. They clearly illustrate patterns corresponding to the system rules and trading levels linked to the patterns.
M5 timeframe:
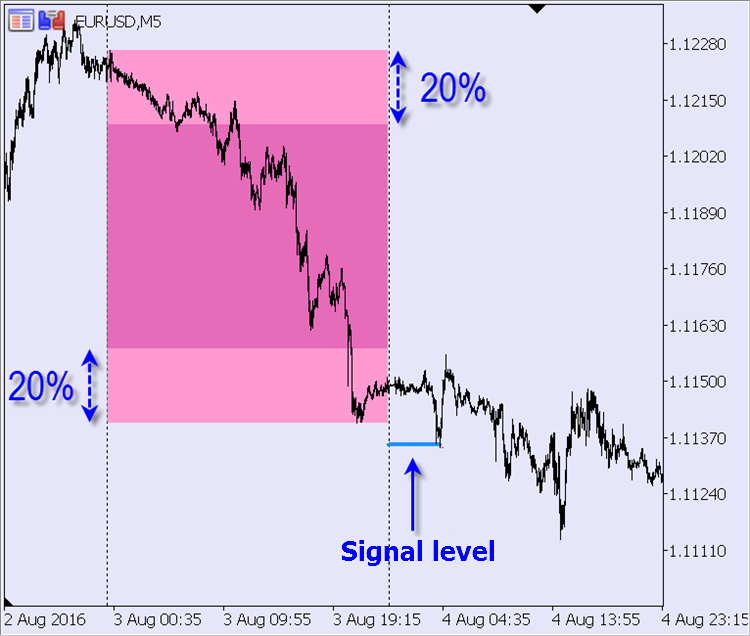
The pattern analysis should result in placing a buy pending order. Appropriate trading levels are better seen on M1 timeframe:
A similar pattern with the opposite trading direction on M5 timeframe:
Its trading levels (M1 timeframe):
Signal module
Let's add Take Profit level calculation to illustrate adding new options to a custom TS. There is no such a level in the original version as only a trailing stop is used to close a position. Let's make Take Profit dependent on the custom minimum breakout level (TS_8020_Extremum_Break) — we will multiply it by the TS_8020_Take_Profit_Ratio custom ratio.
We will need the following elements of the fe_Get_Entry_Signal signal module's main function: current signal status, calculated entry and exit levels (Stop Loss and Take Profit), as well as yesterday's range borders. All levels are received via links to the variables passed to the function, while the signal's return status uses the list of options from the previous article:
ENTRY_BUY, // buy signal
ENTRY_SELL, // sell signal
ENTRY_NONE, // no signal
ENTRY_UNKNOWN // status not defined
};
ENUM_ENTRY_SIGNAL fe_Get_Entry_Signal( // D1 two-candle pattern analysis
datetime t_Time, // current time
double& d_Entry_Level, // entry level (link to the variable)
double& d_SL, // StopLoss level (link to the variable)
double& d_TP, // TakeProfit level (link to the variable)
double& d_Range_High, // High of the pattern's 1 st bar (link to the variable)
double& d_Range_Low // Low of the pattern's 1 st bar (link to the variable)
) {}
In order to detect a signal, we need to analyze the last two bars of D1 timeframe. Let's start from the first one — if it does not meet the TS criteria, there is no need to check the second bar. There are two criteria:
1. The bar size (difference between High and Low) should exceed the average value for the last XX days (set by the TS_8020_D1_Average_Period custom setting)
2. Bar Open and Close levels should be located at the opposite 20% of the bar range
If these conditions are met, High and Low prices should be saved for further use. Since the first bar parameters do not change within the entire day, there is no point in checking them at each function call. Let's store them in static variables:
input uint TS_8020_D1_Average_Period = 20; // 80-20: Number of days for calculating the average daily range
input uint TS_8020_Extremum_Break = 50; // 80-20: Minimum breakout of the yesterday's extremum (in points)
static ENUM_ENTRY_SIGNAL se_Possible_Signal = ENTRY_UNKNOWN; // pattern's first bar signal direction
static double
// variables for storing calculated levels between ticks
sd_Entry_Level = 0,
sd_SL = 0, sd_TP = 0,
sd_Range_High = 0, sd_Range_Low = 0
;
// check the pattern's first bar on D1:
if(se_Possible_Signal == ENTRY_UNKNOWN) { // not carried out yet
st_Last_D1_Bar = t_Curr_D1_Bar; // 1 st bar does not change this day
// average daily range
double d_Average_Bar_Range = fd_Average_Bar_Range(TS_8020_D1_Average_Period, PERIOD_D1, t_Time);
if(ma_Rates[0].high — ma_Rates[0].low <= d_Average_Bar_Range) {
// 1 st bar is not large enough
se_Possible_Signal = ENTRY_NONE; // means no signal today
return(se_Possible_Signal);
}
double d_20_Percents = 0.2 * (ma_Rates[0].high — ma_Rates[0].low); // 20% of the yesterday's range
if((
// bearish bar:
ma_Rates[0].open > ma_Rates[0].high — d_20_Percents // bar opened in the upper 20%
&&
ma_Rates[0].close < ma_Rates[0].low + d_20_Percents // and closed in the lower 20%
) || (
// bullish:
ma_Rates[0].close > ma_Rates[0].high — d_20_Percents // bar closed in the upper 20%
&&
ma_Rates[0].open < ma_Rates[0].low + d_20_Percents // and opened in the lower 20%
)) {
// 1 st bar corresponds to the conditions
// define today's trading direction for the pattern's 1 st bar:
se_Possible_Signal = ma_Rates[0].open > ma_Rates[0].close ? ENTRY_BUY : ENTRY_SELL;
// market entry level:
sd_Entry_Level = d_Entry_Level = se_Possible_Signal == ENTRY_BUY ? ma_Rates[0].low : ma_Rates[0].high;
// pattern's 1 st bar range borders:
sd_Range_High = d_Range_High = ma_Rates[0].high;
sd_Range_Low = d_Range_Low = ma_Rates[0].low;
} else {
// 1 st bar open/close levels do not match conditions
se_Possible_Signal = ENTRY_NONE; // means no signal today
return(se_Possible_Signal);
}
}
Listing of the function for defining the average bar range within the specified number of bars on the specified timeframe beginning from the specified time function:
int i_Bars_Limit, // how many bars to consider
ENUM_TIMEFRAMES e_TF = PERIOD_CURRENT, // bars timeframe
datetime t_Time = WRONG_VALUE // when to start calculation
) {
double d_Average_Range = 0; // variable for summing values
if(i_Bars_Limit < 1) return(d_Average_Range);
MqlRates ma_Rates[]; // bar info array
// get bar info from the specified history interval:
if(t_Time == WRONG_VALUE) t_Time = TimeCurrent();
int i_Price_Bars = CopyRates(_Symbol, e_TF, t_Time, i_Bars_Limit, ma_Rates);
if(i_Price_Bars == WRONG_VALUE) { // processing CopyRates function error
if(Log_Level > LOG_LEVEL_NONE) PrintFormat("%s: CopyRates: error #%u", __FUNCTION__, _LastError);
return(d_Average_Range);
}
if(i_Price_Bars < i_Bars_Limit) { // CopyRates function has not retrieved the required data amount
if(Log_Level > LOG_LEVEL_NONE) PrintFormat("%s: CopyRates: copied %u bars of %u", __FUNCTION__, i_Price_Bars, i_Bars_Limit);
}
// sum of ranges:
int i_Bar = i_Price_Bars;
while(i_Bar-- > 0)
d_Average_Range += ma_Rates[i_Bar].high — ma_Rates[i_Bar].low;
// average value:
return(d_Average_Range / double(i_Price_Bars));
}
There is only one criterion for the pattern's second (current) bar — breakout of the yesterday's range border should not be less than the one specified in the settings (TS_8020_Extremum_Break). As soon as the level is reached, a signal for placing a pending order appears:
if(se_Possible_Signal == ENTRY_BUY) {
sd_SL = d_SL = ma_Rates[1].low; // StopLoss — to the today's High
if(TS_8020_Take_Profit_Ratio > 0) sd_TP = d_TP = d_Entry_Level + _Point * TS_8020_Extremum_Break * TS_8020_Take_Profit_Ratio; // TakeProfit
return(
// is the downward breakout clearly seen?
ma_Rates[1].close < ma_Rates[0].low — _Point * TS_8020_Extremum_Break ?
ENTRY_BUY : ENTRY_NONE
);
}
if(se_Possible_Signal == ENTRY_SELL) {
sd_SL = d_SL = ma_Rates[1].high; // StopLoss — to the today's Low
if(TS_8020_Take_Profit_Ratio > 0) sd_TP = d_TP = d_Entry_Level — _Point * TS_8020_Extremum_Break * TS_8020_Take_Profit_Ratio; // TakeProfit
return(
// is the upward breakout clearly seen?
ma_Rates[1].close > ma_Rates[0].high + _Point * TS_8020_Extremum_Break ?
ENTRY_SELL : ENTRY_NONE
);
}
Save the two functions mentioned above (fe_Get_Entry_Signal and fd_Average_Bar_Range) and the custom settings related to receiving a signal to the mqh library file. The full listing is attached below. Let's name the file Signal_80-20.mqh and place it to the appropriate directory of the terminal data folder (MQL5\Include\Expert\Signal).
Indicator for manual trading
Just like the EA, the indicator is to use the signal module described above. The indicator should inform a trader on receiving a pending order placement signal and provide the calculated levels — order placement, Take Profit and Stop Loss levels. A user can select a notification method — a standard pop-up window, email alert or push notification. It is possible to choose all at once or any combination you like.
Another indicator objective is a trading history layout according to '80-20' TS. The indicator is to highlight daily bars corresponding to the system criteria and plot calculated trading levels. The level lines display how the situation evolved over time. For more clarity, let's do as follows: when the price touches the signal line, the latter is replaced with a pending order line. When the pending order is activated, its line is replaced with Take Profit and Stop Loss lines. These lines are interrupted when the price touches one of them (the order is closed). This layout makes it easier to evaluate the efficiency of the trading system rules and define what can be improved.
Let's start with declaring the buffers and their display parameters. First, we need to declare the two buffers with the vertical area filling (DRAW_FILLING). The first one is to highlight the full daily bar range of the previous day, while another one is to highlight the inner area only to separate it from the upper and lower 20% of the range used in TS. After that, declare the two buffers for the multi-colored signal line and the pending order line (DRAW_COLOR_LINE). Their color depends on the trading direction. There are other two lines (Take Proft and Stop Loss) with their color remaining the same (DRAW_LINE) — they are to use the same standard colors assigned to them in the terminal. All selected display types, except for a simple line, require two buffers each, therefore the code looks as follows:
#property indicator_buffers 10
#property indicator_plots 6
#property indicator_label1 "1 st bar of the pattern"
#property indicator_type1 DRAW_FILLING
#property indicator_color1 clrDeepPink, clrDodgerBlue
#property indicator_width1 1
#property indicator_label2 "1 st bar of the pattern"
#property indicator_type2 DRAW_FILLING
#property indicator_color2 clrDeepPink, clrDodgerBlue
#property indicator_width2 1
#property indicator_label3 "Signal level"
#property indicator_type3 DRAW_COLOR_LINE
#property indicator_style3 STYLE_SOLID
#property indicator_color3 clrDeepPink, clrDodgerBlue
#property indicator_width3 2
#property indicator_label4 "Entry level"
#property indicator_type4 DRAW_COLOR_LINE
#property indicator_style4 STYLE_DASHDOT
#property indicator_color4 clrDeepPink, clrDodgerBlue
#property indicator_width4 2
#property indicator_label5 "Stop Loss"
#property indicator_type5 DRAW_LINE
#property indicator_style5 STYLE_DASHDOTDOT
#property indicator_color5 clrCrimson
#property indicator_width5 1
#property indicator_label6 "Take Profit"
#property indicator_type6 DRAW_LINE
#property indicator_style6 STYLE_DASHDOTDOT
#property indicator_color6 clrLime
#property indicator_width6 1
Let's provide traders with the ability to disable the filling of the daily pattern's first bar, select signal notification options and limit the history layout depth. All trading system settings from the signal module are also included here. To do this, we need to preliminarily enumerate the variables used in the module even if some of them are to be used only in the EA and are of no need in the indicator:
input bool Show_Outer = true; // 1 st bar of the pattern: Show the full range?
input bool Show_Inner = true; // 1 st bar of the pattern: Show the inner area?
input bool Alert_Popup = true; // Alert: Show a pop-up window?
input bool Alert_Email = false; // Alert: Send an eMail?
input string Alert_Email_Subj = ""; // Alert: eMail subject
input bool Alert_Push = true; // Alert: Send a push notification?
input uint Bars_Limit = 2000; // History layout depth (in the current TF bars)
ENUM_LOG_LEVEL Log_Level = LOG_LEVEL_NONE; // Logging mode
double
buff_1st_Bar_Outer[], buff_1st_Bar_Outer_Zero[], // buffers for plotting the full range of the pattern's 1 st bar
buff_1st_Bar_Inner[], buff_1st_Bar_Inner_Zero[], // buffers for plotting the internal 60% of the pattern's 1 st bar
buff_Signal[], buff_Signal_Color[], // signal line buffers
buff_Entry[], buff_Entry_Color[], // pending order line buffers
buff_SL[], buff_TP[], // StopLoss and TakeProfit lines' buffers
gd_Extremum_Break = 0 // TS_8020_Extremum_Break in symbol prices
;
int
gi_D1_Average_Period = 1, // correct value for TS_8020_D1_Average_Period
gi_Min_Bars = WRONG_VALUE // minimum required number of bars for re-calculation
;
int OnInit() {
// check the entered TS_8020_D1_Average_Period parameter:
gi_D1_Average_Period = int(fmin(1, TS_8020_D1_Average_Period));
// converting points to symbol prices:
gd_Extremum_Break = TS_8020_Extremum_Break * _Point;
// minimum required number of bars for re-calculation = number of bars of the current TF within a day
gi_Min_Bars = int(86400 / PeriodSeconds());
// indicator buffers' objective:
// 1 st bar's full range rectangle
SetIndexBuffer(0, buff_1st_Bar_Outer, INDICATOR_DATA);
PlotIndexSetDouble(0, PLOT_EMPTY_VALUE, 0);
SetIndexBuffer(1, buff_1st_Bar_Outer_Zero, INDICATOR_DATA);
// 1 st bar's inner area rectangle
SetIndexBuffer(2, buff_1st_Bar_Inner, INDICATOR_DATA);
PlotIndexSetDouble(1, PLOT_EMPTY_VALUE, 0);
SetIndexBuffer(3, buff_1st_Bar_Inner_Zero, INDICATOR_DATA);
// signal line
SetIndexBuffer(4, buff_Signal, INDICATOR_DATA);
PlotIndexSetDouble(2, PLOT_EMPTY_VALUE, 0);
SetIndexBuffer(5, buff_Signal_Color, INDICATOR_COLOR_INDEX);
// pending order placement line
SetIndexBuffer(6, buff_Entry, INDICATOR_DATA);
PlotIndexSetDouble(3, PLOT_EMPTY_VALUE, 0);
SetIndexBuffer(7, buff_Entry_Color, INDICATOR_COLOR_INDEX);
// SL line
SetIndexBuffer(8, buff_SL, INDICATOR_DATA);
PlotIndexSetDouble(4, PLOT_EMPTY_VALUE, 0);
// TP line
SetIndexBuffer(9, buff_TP, INDICATOR_DATA);
PlotIndexSetDouble(5, PLOT_EMPTY_VALUE, 0);
IndicatorSetInteger(INDICATOR_DIGITS, _Digits);
IndicatorSetString(INDICATOR_SHORTNAME, "80-20 TS");
return(INIT_SUCCEEDED);
}
Place the main program's code to the built-in OnCalculate function — arrange the loop for iterating over the current timeframe's bars from the past to the future searching them for a signal using the function from the signal module. Declare and initialize the necessary variables using initial values. Let's define the oldest loop bar for the first calculation considering a user-defined history depth limit (Bars_Limit). For subsequent calls, all bars of the current day (rather than the last bar) are re-calculated, since the two-bar pattern actually belongs to D1 chart regardless of the current timeframe.
Besides, we should protect against the so-called phantoms: if we do not perform a forced indicator buffers clearing during re-initialization, then no longer relevant filled areas remain on the screen when switching timeframes or symbols. The buffer clearing should be bound to the first OnCalculate function call after the indicator initialization. However, the standard prev_calculated variable is not enough for defining if the call is the first one, since it may contain zero not only during the first function call but also "when changing the checksum". Let's spend some time to properly solve this issue by creating the structure not affected by setting the prev_calculated variable to zero. The structure is to store and process data frequently used in the indicators:
- flag of the OnCalculate function first launch;
- the counter of calculated bars that is not set to zero when changing the checksum;
- flag of changing the checksum;
- flag of the beginning of a new bar;
- current bar start time.
The structure combining all these data is to be declared at the global level. It should be able to gather or present data from/to any built-in or custom functions. Let's name this structure Brownie. It can be placed to the end of the indicator code. A single global type structure object named go_Brownie is to be declared there as well:
datetime t_Last_Bar_Time; // time of the last processed bar
int i_Prew_Calculated; // number of calculated bars
bool b_First_Run; // first launch flag
bool b_History_Updated; // history update flag
bool b_Is_New_Bar; // new bar opening flag
BROWNIE() { // constructor
// default values:
t_Last_Bar_Time = 0;
i_Prew_Calculated = WRONG_VALUE;
b_First_Run = b_Is_New_Bar = true;
b_History_Updated = false;
}
void f_Reset(bool b_Reset_First_Run = true) { // setting variables to zero
// default values:
t_Last_Bar_Time = 0;
i_Prew_Calculated = WRONG_VALUE;
if(b_Reset_First_Run) b_First_Run = true; // set to zero if there is permission
b_Is_New_Bar = true;
b_History_Updated = false;
}
void f_Update(int i_New_Prew_Calculated = WRONG_VALUE) { // update the variables
// flag of the OnCalculate built-in function first call
if(b_First_Run && i_Prew_Calculated > 0) b_First_Run = false;
// new bar?
datetime t_This_Bar_Time = TimeCurrent() - TimeCurrent() % PeriodSeconds();
b_Is_New_Bar = t_Last_Bar_Time == t_This_Bar_Time;
// update the current bar time?
if(b_Is_New_Bar) t_Last_Bar_Time = t_This_Bar_Time;
if(i_New_Prew_Calculated > -1) {
// are there any changes in history?
b_History_Updated = i_New_Prew_Calculated == 0 && i_Prew_Calculated > WRONG_VALUE;
// use prew_calculated in case of OnCalculate 1 st call
if(i_Prew_Calculated == WRONG_VALUE) i_Prew_Calculated = i_New_Prew_Calculated;
// or if there was no history update
else if(i_New_Prew_Calculated > 0) i_Prew_Calculated = i_New_Prew_Calculated;
}
}
};
BROWNIE go_Brownie;
Let's inform the Brownie of the indicator de-initialization event:
go_Brownie.f_Reset(); // inform Brownie
}
If necessary, the amount of data stored by the Brownie can be expanded if custom functions or classes need prices, volumes or the current bar's spread value (Open, High, Low, Close, tick_volume, volume, spread). It is more convenient to use ready-made data from the OnCalculate function and pass them via Brownie rather than using the time series copying functions (CopyOpen, CopyHigh etc. or CopyRates) — this saves the CPU resources and eliminates the necessity to arrange processing of errors of these language functions.
Let's get back to the main indicator function. Declaring variables and preparing the arrays using the go_Brownie structure look as follows:
int
i_Period_Bar = 0, // auxiliary counter
i_Current_TF_Bar = rates_total - int(Bars_Limit) // bar index of the current TF loop start
;
static datetime st_Last_D1_Bar = 0; // time of the last processed bar of the couple of D1 bars (pattern's 2 nd bar)
static int si_1st_Bar_of_Day = 0; // index of the current day's first bar
if(go_Brownie.b_First_Run) { // if this is the 1 st launch
// clear the buffers during re-initialization:
ArrayInitialize(buff_1st_Bar_Inner, 0); ArrayInitialize(buff_1st_Bar_Inner_Zero, 0);
ArrayInitialize(buff_1st_Bar_Outer, 0); ArrayInitialize(buff_1st_Bar_Outer_Zero, 0);
ArrayInitialize(buff_Entry, 0); ArrayInitialize(buff_Entry_Color, 0);
ArrayInitialize(buff_Signal, 0); ArrayInitialize(buff_Signal_Color, 0);
ArrayInitialize(buff_TP, 0);
ArrayInitialize(buff_SL, 0);
st_Last_D1_Bar = 0;
si_1st_Bar_of_Day = 0;
} else { // this is not the 1 st launch
datetime t_Time = TimeCurrent();
// minimum re-calculation depth - from the previous day:
i_Current_TF_Bar = rates_total - Bars(_Symbol, PERIOD_CURRENT, t_Time - t_Time % 86400, t_Time) - 1;
}
ENUM_ENTRY_SIGNAL e_Signal = ENTRY_UNKNOWN; // signal
double
d_SL = WRONG_VALUE, // SL level
d_TP = WRONG_VALUE, // TP level
d_Entry_Level = WRONG_VALUE, // entry level
d_Range_High = WRONG_VALUE, d_Range_Low = WRONG_VALUE // borders of the pattern's 1 st bar range
;
datetime
t_Curr_D1_Bar = 0, // current D1 bar time (pattern's 2 nd bar)
t_D1_Bar_To_Fill = 0 // D1 bar time to be filled (pattern's 1 st bar)
;
// make sure the initial re-calculation bar index is within acceptable range:
i_Current_TF_Bar = int(fmax(0, fmin(i_Current_TF_Bar, rates_total - gi_Min_Bars)));
while(++i_Current_TF_Bar < rates_total && !IsStopped()) { // iterate over the current TF bars
// the main program loop is to be located here
}
Check the presence of a signal when iterating over the current timeframe bars:
if(e_Signal > 1) continue; // no signal during the day the bar belongs to
If there is a signal on a new day's first bar, the range of the previous daily bar should be filled. The value of the t_D1_Bar_To_Fill variable of datetime type is used as a flag. If it is equal to WRONG_VALUE, no filling is required on this bar. The signal line should start at the same first bar, but let's extend it to the last bar of the previous day for better layout perception. Since the calculations of a signal line, as well as line and filling colors for bullish and bearish bars are different, let's make two similar blocks:
if(st_Last_D1_Bar < t_Curr_D1_Bar) { // this is a new day bar
t_D1_Bar_To_Fill = Time[i_Current_TF_Bar — 1] — Time[i_Current_TF_Bar — 1] % 86400;
si_1st_Bar_of_Day = i_Current_TF_Bar;
}
else t_D1_Bar_To_Fill = WRONG_VALUE; // previous day bar, no new filling required
st_Last_D1_Bar = t_Curr_D1_Bar; // remember
if(t_D1_Bar_To_Fill != WRONG_VALUE) { // new D1 bar
// Filling the previous day's D1 bar:
i_Period_Bar = i_Current_TF_Bar;
if(d_Entry_Level < d_Range_High) { // D1 bearish bar
if(Show_Outer) while(--i_Period_Bar > 0) { // full range
if(Time[i_Period_Bar] < t_D1_Bar_To_Fill) break;
buff_1st_Bar_Outer_Zero[i_Period_Bar] = d_Range_Low;
buff_1st_Bar_Outer[i_Period_Bar] = d_Range_High;
}
if(Show_Inner) { // inner area
i_Period_Bar = i_Current_TF_Bar;
while(--i_Period_Bar > 0) {
if(Time[i_Period_Bar] < t_D1_Bar_To_Fill) break;
buff_1st_Bar_Inner_Zero[i_Period_Bar] = d_Range_Low + 0.2 * (d_Range_High — d_Range_Low);
buff_1st_Bar_Inner[i_Period_Bar] = d_Range_High — 0.2 * (d_Range_High — d_Range_Low);
}
}
// start of the signal line — from the previous day's last bar
buff_Signal[i_Current_TF_Bar] = buff_Signal[i_Current_TF_Bar — 1] = d_Range_Low — gd_Extremum_Break;
buff_Signal_Color[i_Current_TF_Bar] = buff_Signal_Color[i_Current_TF_Bar — 1] = 0;
} else { // bullish D1 bar
if(Show_Outer) while(--i_Period_Bar > 0) { // full range
if(Time[i_Period_Bar] < t_D1_Bar_To_Fill) break;
buff_1st_Bar_Outer_Zero[i_Period_Bar] = d_Range_High;
buff_1st_Bar_Outer[i_Period_Bar] = d_Range_Low;
}
if(Show_Inner) { // inner area
i_Period_Bar = i_Current_TF_Bar;
while(--i_Period_Bar > 0) {
if(Time[i_Period_Bar] < t_D1_Bar_To_Fill) break;
buff_1st_Bar_Inner_Zero[i_Period_Bar] = d_Range_High — 0.2 * (d_Range_High — d_Range_Low);
buff_1st_Bar_Inner[i_Period_Bar] = d_Range_Low + 0.2 * (d_Range_High — d_Range_Low);
}
}
// start of the signal line — from the previous day's last bar
buff_Signal[i_Current_TF_Bar] = buff_Signal[i_Current_TF_Bar — 1] = d_Range_High + gd_Extremum_Break;
buff_Signal_Color[i_Current_TF_Bar] = buff_Signal_Color[i_Current_TF_Bar — 1] = 1;
}
} else continue;
All the remaining layout lines are to be plotted inside the current timeframe's bars iteration loop. As already mentioned, the signal line should end at the bar where the price touched it. The pending order line should start at the same bar and end on the bar, at which the contact with the price occurs. Take Profit and Stop Loss lines should start at the same bar. The layout of the pattern is finished at the bar, at which the price touches one of them:
i_Period_Bar = i_Current_TF_Bar;
if(d_Entry_Level < d_Range_High) { // bearish D1 bar
while(++i_Period_Bar < rates_total) {
if(Time[i_Period_Bar] > t_Curr_D1_Bar + 86399) break;
buff_Signal[i_Period_Bar] = d_Range_Low — gd_Extremum_Break;
buff_Signal_Color[i_Period_Bar] = 0;
if(d_Range_Low — gd_Extremum_Break >= Low[i_Period_Bar]) break;
}
} else { // bullish D1 bar
while(++i_Period_Bar < rates_total) {
if(Time[i_Period_Bar] > t_Curr_D1_Bar + 86399) break;
buff_Signal[i_Period_Bar] = d_Range_High + gd_Extremum_Break;
buff_Signal_Color[i_Period_Bar] = 1;
if(d_Range_High + gd_Extremum_Break <= High[i_Period_Bar]) break;
}
}
// Entry line till crossed by a bar:
if(d_Entry_Level < d_Range_High) { // bearish D1 bar
while(++i_Period_Bar < rates_total) {
if(Time[i_Period_Bar] > t_Curr_D1_Bar + 86399) break;
buff_Entry[i_Period_Bar] = d_Range_Low;
buff_Entry_Color[i_Period_Bar] = 0;
if(d_Range_Low <= High[i_Period_Bar]) {
if(buff_Entry[i_Period_Bar — 1] == 0.) {
// start and end on a single bar, extend by 1 bar to the past
buff_Entry[i_Period_Bar — 1] = d_Range_Low;
buff_Entry_Color[i_Period_Bar — 1] = 0;
}
break;
}
}
} else { // bullish D1 bar
while(++i_Period_Bar < rates_total) {
if(Time[i_Period_Bar] > t_Curr_D1_Bar + 86399) break;
buff_Entry[i_Period_Bar] = d_Range_High;
buff_Entry_Color[i_Period_Bar] = 1;
if(d_Range_High >= Low[i_Period_Bar]) {
if(buff_Entry[i_Period_Bar — 1] == 0.) {
// start and end on a single bar, extend by 1 bar to the past
buff_Entry[i_Period_Bar — 1] = d_Range_High;
buff_Entry_Color[i_Period_Bar — 1] = 1;
}
break;
}
}
}
// TP and SL lines till one of them is crossed by a bar:
if(d_Entry_Level < d_Range_High) { // bearish D1 bar
// SL is equal to the Low since the beginning of a day:
d_SL = Low[ArrayMinimum(Low, si_1st_Bar_of_Day, i_Period_Bar — si_1st_Bar_of_Day)];
while(++i_Period_Bar < rates_total) {
if(Time[i_Period_Bar] > t_Curr_D1_Bar + 86399) break;
buff_SL[i_Period_Bar] = d_SL;
buff_TP[i_Period_Bar] = d_TP;
if(d_TP <= High[i_Period_Bar] || d_SL >= Low[i_Period_Bar]) {
if(buff_SL[i_Period_Bar — 1] == 0.) {
// start and end on a single bar, extend by 1 bar to the past
buff_SL[i_Period_Bar — 1] = d_SL;
buff_TP[i_Period_Bar — 1] = d_TP;
}
break;
}
}
} else { // bullish D1 bar
// SL is equal to the High since the beginning of a day:
d_SL = High[ArrayMaximum(High, si_1st_Bar_of_Day, i_Period_Bar — si_1st_Bar_of_Day)];
while(++i_Period_Bar < rates_total) {
if(Time[i_Period_Bar] > t_Curr_D1_Bar + 86399) break;
buff_SL[i_Period_Bar] = d_SL;
buff_TP[i_Period_Bar] = d_TP;
if(d_SL <= High[i_Period_Bar] || d_TP >= Low[i_Period_Bar]) {
if(buff_SL[i_Period_Bar — 1] == 0.) {
// start and end on a single bar, extend by 1 bar to the past
buff_SL[i_Period_Bar — 1] = d_SL;
buff_TP[i_Period_Bar — 1] = d_TP;
}
break;
}
}
}
Let's place the call code of the f_Do_Alert signal notification function out of the loop. In fact, it has slightly wider opportunities as compared to the ones involved in this indicator — the function is able to work with audio files meaning that this option can be added to custom settings. The same is true for the ability to select separate files for buy and sell signals. Function listing:
string s_Message, // alert message
bool b_Alert = true, // show a pop-up window?
bool b_Sound = false, // play a sound file?
bool b_Email = false, // send an eMail?
bool b_Notification = false, // send a push notification?
string s_Email_Subject = "", // eMail subject
string s_Sound = "alert.wav" // sound file
) {
static string ss_Prev_Message = "there was silence"; // previous alert message
static datetime st_Prev_Time; // previous alert bar time
datetime t_This_Bar_Time = TimeCurrent() — PeriodSeconds() % PeriodSeconds(); // current bar time
if(ss_Prev_Message != s_Message || st_Prev_Time != t_This_Bar_Time) {
// another and/or 1 st at this bar
// remember:
ss_Prev_Message = s_Message;
st_Prev_Time = t_This_Bar_Time;
// form a message string:
s_Message = StringFormat("%s | %s | %s | %s",
TimeToString(TimeLocal(), TIME_SECONDS), // local time
_Symbol, // symbol
StringSubstr(EnumToString(ENUM_TIMEFRAMES(_Period)), 7), // TF
s_Message // message
);
// activate notification signal:
if(b_Alert) Alert(s_Message);
if(b_Email) SendMail(s_Email_Subject + " " + _Symbol, s_Message);
if(b_Notification) SendNotification(s_Message);
if(b_Sound) PlaySound(s_Sound);
}
}
The code for checking the need for calling the function and forming the text for it located in the program body before completion of the OnCalculate event handler:
i_Period_Bar = rates_total — 1; // current bar
if(Alert_Popup + Alert_Email + Alert_Push == 0) return(rates_total); // all is disabled
if(buff_Signal[i_Period_Bar] == 0) return(rates_total); // nothing to catch yet (or already)
if(
buff_Signal[i_Period_Bar] > High[i_Period_Bar]
||
buff_Signal[i_Period_Bar] < Low[i_Period_Bar]
) return(rates_total); // no signal line touching
// message text:
string s_Message = StringFormat("TS 80-20: needed %s @ %s, TP: %s, SL: %s",
buff_Signal_Color[i_Period_Bar] > 0 ? "BuyStop" : "SellStop",
DoubleToString(d_Entry_Level, _Digits),
DoubleToString(d_TP, _Digits),
DoubleToString(d_SL, _Digits)
);
// notification:
f_Do_Alert(s_Message, Alert_Popup, false, Alert_Email, Alert_Push, Alert_Email_Subj);
return(rates_total); // complete OnCalculate operation
The entire source code of the indicator can be found in the attached files (TS_80-20.mq5). The trading layout according to the system is best seen on minute charts.
Please note that the indicator uses the bar data rather than tick sequences inside bars. This means if the price crossed several layout lines (for example, Take Profit and Stop Loss lines) on a single bar, you cannot always define which of them was crossed first. Another uncertainty stems from the fact that the start and end lines cannot coincide. Otherwise, the lines from the buffer of DRAW_LINE and DRAW_COLOR_LINE types will simply be invisible to a user. These features reduce the layout accuracy but it still remains quite clear.
Expert Advisor for testing the '80-20' trading strategy
The basic EA for testing strategies from the book Street Smarts: High Probability Short-Term Trading Strategies was described in details in the first article. Let's insert two significant changes in it. First, the signal module is to be used in the indicator as well meaning it would be reasonable to set trading levels calculation in it. We have already done this above. Apart from the signal status, the fe_Get_Entry_Signal function returns order placement, Stop Loss and Take Profit levels. Therefore, let's remove the appropriate part of the code from the previous EA version adding the variables for accepting levels from the function and edit the function call itself. The listings of the old and new code blocks can be found in the attached file (strings 128-141).
Another significant addition to the basic EA code is due to the fact that, unlike the previous two, this TS deals with a short-term trend. It assumes that the roll-back happens once a day and is unlikely to be repeated. This means that the robot has to make only one entry ignoring the existing signal all the rest of the time until the next day. The easiest way to implement that is to use a special flag — static or global variable of bool type in the program memory. But if the EA operation is interrupted for some reason (the terminal is closed, the EA is removed from the chart, etc.), the flag value is lost as well. Thus, we should have the ability to check if today's signal was activated previously. To do this, we may analyze the history of trades for today or store the date of the last entry in the terminal global variables rather than in the program. Let us use the second option since it is much easier to implement.
Provide users with the ability to manage 'one entry per day' option and set an ID of each launched version of the robot — it is needed to use global variables of the terminal level:
input uint Magic_Number = 2016; // EA magic number
Let's add the variables necessary to implement 'one entry per day' option to the program's global variables definition block. Initialize them in the OnInit function:
gs_Prefix // identifier of (super)global variables
;
bool
gb_Position_Today = false,
gb_Pending_Today = false
;
int OnInit() {
...
// Create a prefix of (super)global variable names:
gs_Prefix = StringFormat("SSB %s %u %s", _Symbol, Magic_Number, MQLInfoInteger(MQL_TESTER) ? "t " : "");
// Has the robot worked with market or pending orders today?
gb_Position_Today = int(GlobalVariableGet(gs_Prefix + "Last_Position_Date")) == TimeCurrent() — TimeCurrent() % 86400;
gb_Pending_Today = int(GlobalVariableGet(gs_Prefix + "Last_Pending_Date")) == TimeCurrent() — TimeCurrent() % 86400;
...
}
Here the robot reads the values of global variables and compares the written time with the day start time, thus defining if the today's signal has already been processed. Time is written to the variables in two places — let's add the appropriate block to the pending order installation code (additions highlighted):
if(Log_Level > LOG_LEVEL_NONE) Print("Pending order placing error");
// the distance from the current price is not enough :(
if(Log_Level > LOG_LEVEL_ERR)
PrintFormat("Pending order cannot be placed at the %s level. Bid: %s Ask: %s StopLevel: %s",
DoubleToString(d_Entry_Level, _Digits),
DoubleToString(go_Tick.bid, _Digits),
DoubleToString(go_Tick.ask, _Digits),
DoubleToString(gd_Stop_Level, _Digits)
);
} else { // managed
// to update the flag:
GlobalVariableSet( // in the terminal global variables
gs_Prefix + "Last_Pending_Date",
TimeCurrent() — TimeCurrent() % 86400
);
gb_Pending_Today = true; // in the program global variables
}
The second block is placed after the code defining a newly opened position:
if(PositionGetDouble(POSITION_SL) == 0.) { // new position
if(!gb_Position_Today) { // this is the 1 st position today
// update the flag:
GlobalVariableSet( // in the terminal global variables
gs_Prefix + "Last_Position_Date",
TimeCurrent() — TimeCurrent() % 86400
);
gb_Position_Today = true; // in the program global variables
}
...
These are the only significant changes in the previous EA version code. The finalized source code of the new version is attached below.
Strategy backtesting
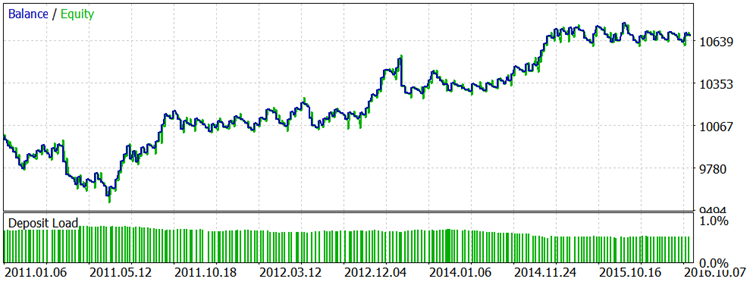
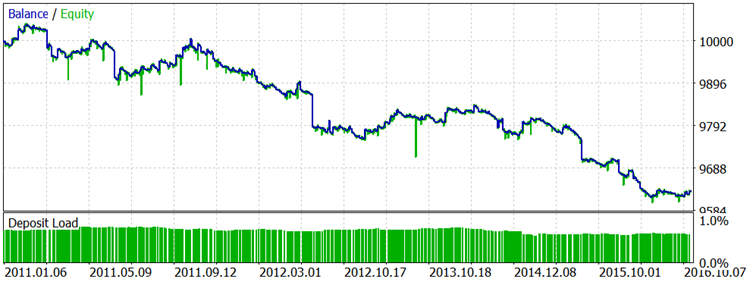
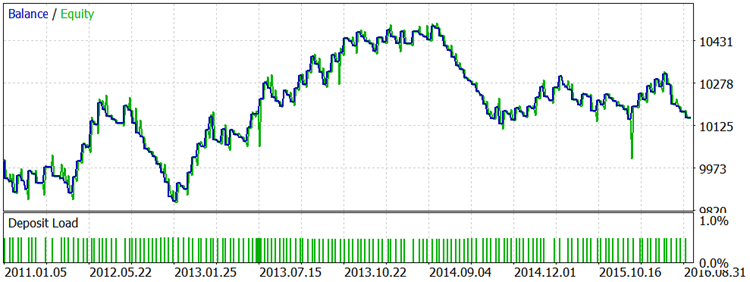
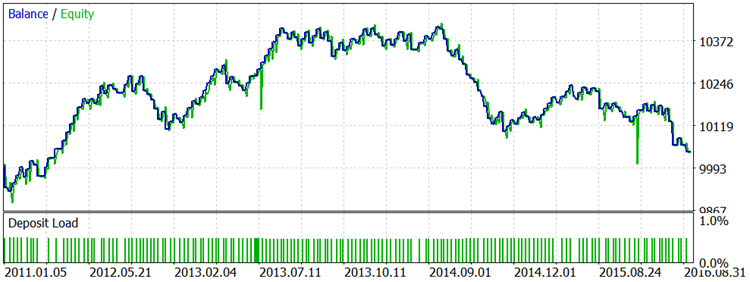
In order to illustrate the trading system viability, its authors use patterns detected on the charts from the end of the last century. Therefore, we need to check its relevance in today's market conditions. For testing, I took the most popular Forex pair EURUSD, the most volatile pair USDJPY and one of the metals — XAUUSD. I increased the indents specified by Raschke and Connors 10 times, since four-digit quotes were used when the book was written, while I tested the EA on five-digit ones. Since there is no any guidance concerning the trailing parameters, I have selected the ones that seem to be most appropriate to daily timeframe and instrument volatility. The same applies to the Take Profit calculation algorithm added to the original rules — the ratio for its calculation was chosen arbitrarily, without deep optimization.
The balance chart when testing on the five-year EURUSD history with the original rules (no Take Profit):
The same settings and Take Profit:
The balance chart when testing the original rules on the five-year USDJPY history:
The same settings and Take Profit:
The balance chart when testing the original rules on the daily gold quotes for the last 4 years:
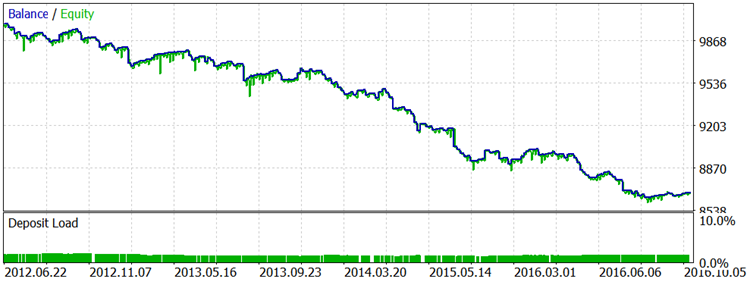
The full data on the robot settings used in each test can be found in the attached archive containing the complete reports.
Conclusion
The rules programmed in the signal module match the 80-20 trading system description provided by Linda Raschke and Laurence Connors in their book "Street Smarts: High Probability Short-Term Trading Strategies". However, we have extended the original rules a bit. The tools (the robot and the indicator) are to help traders draw their own conclusions concerning the TS relevance in today's market. In my humble opinion, the TS needs a serious upgrade. In this article, I have tried to make some detailed comments on developing the code of the signal module, as well as the appropriate robot and indicator. I hope, this will help those who decide to do the upgrade. Apart from modifying the rules, it is also possible to find trading instruments that fit better to the system, as well as signal detection and tracking parameters.
Translated from Russian by MetaQuotes Ltd.
Original article: https://www.mql5.com/ru/articles/2785
Warning: All rights to these materials are reserved by MetaQuotes Ltd. Copying or reprinting of these materials in whole or in part is prohibited.
This article was written by a user of the site and reflects their personal views. MetaQuotes Ltd is not responsible for the accuracy of the information presented, nor for any consequences resulting from the use of the solutions, strategies or recommendations described.
 LifeHack for Trader: A comparative report of several tests
 Universal ZigZag
 The 'Turtle Soup' trading system and its 'Turtle Soup Plus One' modification
- Free trading apps
- Over 8,000 signals for copying
- Economic news for exploring financial markets
You agree to website policy and terms of use
It seems like the criteria for this strategy would rarely be met.
1. First a strong unhesitating momentum candle (with wicks < 20%).
2. Then price must exceed the high or low of that candle, thus confirming the momentum.
3. Then price must reverse and cross the border of yesterday's range against its previous momentum. This is a paradox, and would rarely happen except with news.
If I understood correctly I would guess that this strategy rarely places trades. Is that what your research shows?
Перевод Google
Похоже, что критерии этой стратегии редко будут удовлетворены.
1. Сначала сильный импульс неколеблющийся свеча (с фитилями <20%).
2. Тогда цена должна превышать максимума или минимума этой свечи, подтвердив тем самым импульс.
3. Тогда цена должна развернуться и пересечь границу вчерашнего диапазона от его предыдущего импульса. Это парадокс, и редко случаются, кроме как с новостями.
Если я правильно понял, я бы предположил, что эта стратегия редко ставит сделок. Это то, что ваше исследование показывает?
Thanks for sharing, gold 0.3 U.S. dollars can return to the capital of the broker, there is a need to contact WeChat whkh18 Both username
Russian? No problem! I speak German and reasonable English and found my way:
Put Windows on Russian for 8-bit characters. My Windows 10 is in German now, Later I can add, how to do it in English Windows 10. Now for German Windows 10 - this is the way:
Open "Control Panel"
switch to "Large icons" or "Small icons"
From there open "Region"
On the top you find 2 pages, named "Formats" and Administration" switch to "Administration"
Now you see two buttons (where you need Administrator-rights) "Copy settings..." and "Change locale"
The latter one is what you need, "Change locale". Here you choose "Russian (Russian Federation"
You need to restart, by clicking OK and your way out of there the machine will tell you.
Now ASCII 7-bit is still correct (English) but the higher letters (above 127) are now Russian.
Then you can copy the Russian from Metaeditor and paste it to a translator i.e. translate.google.com.
I recommend to translate to English - most of the time it looks like any US-programmer did it. to German is very often terrible (just my opinion).
Greetings to the non-Russian-speaking world (and to the Russian spoken authors as well,
Gerhard