
Practical Application of Cluster Indicators in FOREX
Introduction
In the article "Theoretical Basis of Building Cluster Indicators for FOREX" we analyzed the operation principle of cluster indicators. The article also introduced
main definitions: "overbuying", "overselling" of currencies and balance line. In this article we will dwell on the practical application of indicators. The
article includes a number of tactical and strategical methods of trading on them:
- methods, helping to detect potential pairs, on which trends may start;
- procedures of defining entry and exit times;
- methods of tracing long-term and medium-term positions.
Examples here contain the full cluster, consisting of eight currencies. In practice
you can develop any cluster, for example, you can omit primary currencies or currencies,
the information on which is excessive for your own trading system. Besides when
working with cluster indicators, take into account that they provide information
on the basis of all currencies, included into the cluster, and not only currencies
of the analyzed currency pair. This factor sometimes distorts useful information.
Still signals, received from the indicators, are considered more reliable, because
they take into account price fluctuations of all currency pairs, and not only of
the analyzed one.
Projection of Main Elements of Price Charts onto Cluster Indicators
The price chart contains periods of trend, consolidation periods (flat) and pivot areas. Cluster indicators, like any other indicator, reflect prices; that is why they cannot forecast future directions and pivot points. But on the other hand the behaviour of cluster indicators differs much from the majority of classical tools; that is why they may display the information about prices, which is not very evident when using other indicators.
In examples we used such indicators as CCFp and CCp. These indicators have up to
eight information lines, each of them corresponds to a certain currency. Very often
in analysis it is interesting to view all lines, but in the examples the lines
of currencies, not included into the analyzed pair, will be hidden for better attention
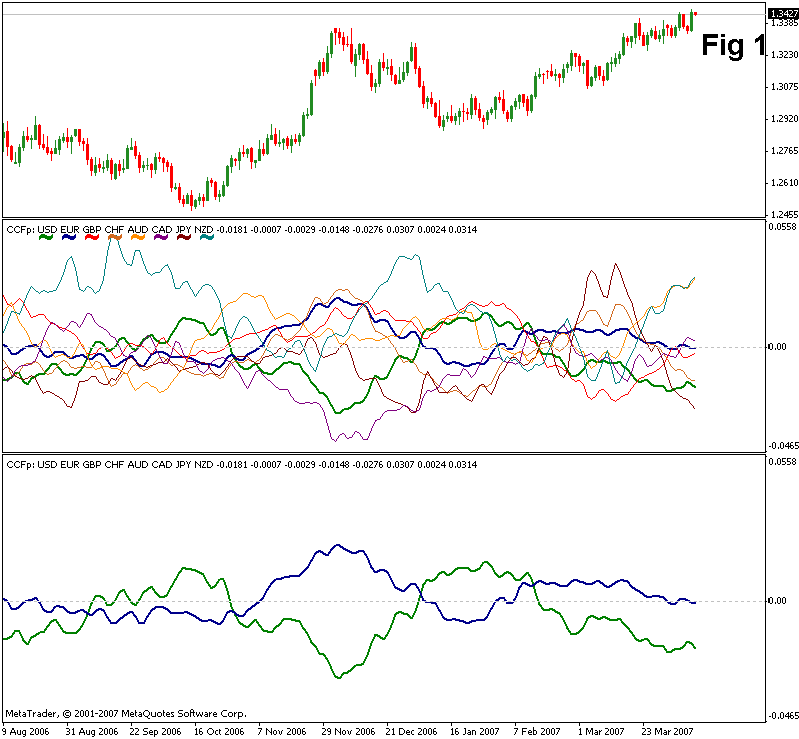
to the necessary information. Fig 1 displays one and the same indicator CCFp for
the pair EURUSD, but in different forms. The upper indicator reflects all currencies
included into the cluster. The one below is the same cluster, consisting of eight
currencies, but visible are only lines of EUR and USD, other lines are hidden.
It is possible due to the indicator settings (See the article "Theoretical Basis of Building Cluster Indicators for FOREX").
Trend Change
Any price chart reflects the periods of uptrend and downtrend. And the main task of cluster indicators is to determine the change of the direction. There are two types of cluster indicators: trend-following and impulse (or signal). Each type has two modifications: complex, which reflect all cluster currencies, and pair, intended only for a chosen pair. Let us analyze each type.
Impulse (Signal) Indicators
This type includes indicators CCp and Complex_pairs (Complex_pairs - original, Complex_pairs1 - light version). The picture Fig 2 displays Complex_pairs1 (upper one) and CCp (lower one). The indicator CCp displays only two currencies - EUR (blue line) and USD (green line) - other currencies are hidden, though they take part in the cluster. If in this indicator one currency is higher than the other one, it is considered to experience growth relative to each other. When the lines intersect, the balance of the pair currencies is achieved. As a rule, the achievement of the balance point shows that the direction will probably change, i.e. a signal appears.
This indicator not always shows, whether the currency lines intersected or not.
For a better visualization of this moment, and for strengthening an amplitude,
the indicator Complex_pairs is used. In it the intersection of a signal line with
a balance line will coincide with the intersection of currency lines in the indicator
CCp. In Fig 2 vertical lines are drawn through the points of intersection of the
indicator Complex_pairs with the zero line, and with points of intersection of
currency lines in the indicator CCp. All intersections take place in one and the
same moment of time.
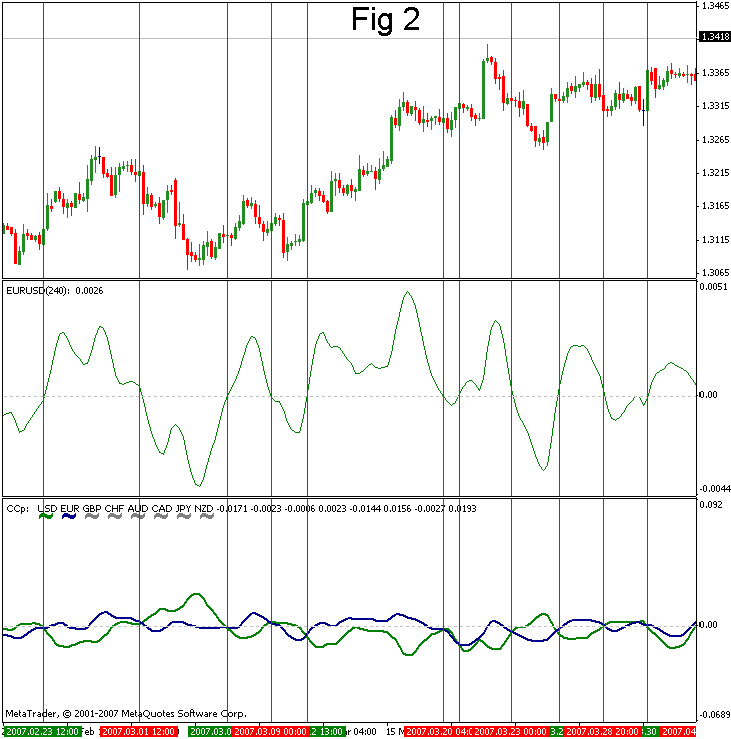
Red vertical lines are drawn in the moment, when a bear signal on the pair EURUSD comes. In the indicator Complex_pairs it is the intersection of the signal line with the zero line downwards, and on the indicator CCp it is the moment, when the dollar line is above the euro line. Green vertical lines give the bull signal for the pair EURUSD. However one cannot use signals produced by impulse indicators directly in trading. In trading it is necessary to take into account the general direction of the pair's movement. For example, one cannot follow signals, which are against the trend. To determine the general direction of a trend either higher timeframes are used, or trend following indicators are analyzed.
Trend-Following Indicators
This type includes two indicators (See Fig 3): CCFp, which reflects two currencies,
and others are hidden, and the indicator CFP, adjusted to the given pair EURUSD.
Like in impulse indicators, intersection points of CCFp indicator lines coincide
with the intersection of the indicator line with the balance line. As distinct
from signal indicators, trend-following indicators do not give trade signals, but
they show the general trend, i.e. point out, which signals are more preferable
at this moment of time - bull or bear.
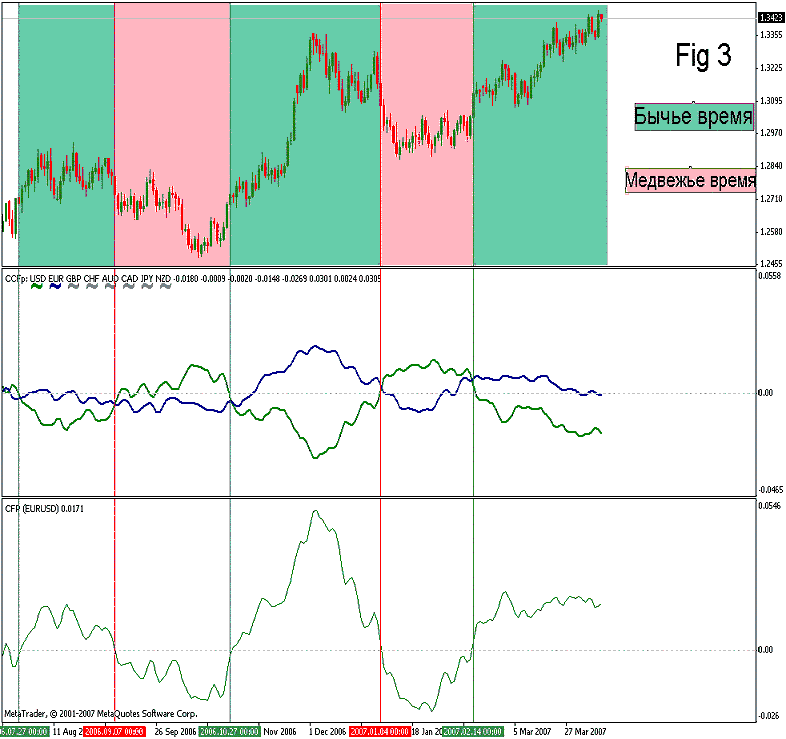
In Fig 3 such periods of time are marked out. Green areas are periods, when it is more preferable to process bull signals, red areas are bear periods. While trend-following indicators take into account the influence of higher timeframes, they have inertial character and that is why they show the trend change later than other indicators. But at the same time, due to this inertance and dependence on higher timeframes, these indicators show pivot points more exactly. But we will discuss it later, when analyzing trading by indicators. And now let us see, what information is presented by the balance line.
Balance Line
The total sum of all currency lines on the indicators CCFp and CCp in each time
unit is equal to zero, irrelative of the amount of currencies in a cluster. So
the indicators described reflect not only the mutual fluctuation relative to each
other, but also the fluctuation relative to zero. If a currency line is above the
zero line, it is said to be "overbought", if it is below the zero line,
it is said to be "oversold".
When a currency is in the zero line area (balance line), it does not experience
tension, being in the equilibrium point. The further movement from the balance
line will depend on the fact, whether the currency will be sold or bought. On the
other hand, when a currency line is in the overbought area (above the zero line)
or in the oversold area (below the zero line), the occurring tension forces the
currency to return to its balance state - zero line. While in practice we deal
with currency pairs, we always have to analyze the dynamics of two pairs. For this
purpose there are special indicators CFP and Complex_pairs, which also have the
balance line, and the signal line is the sum of two currencies.
Exactly the same way the zero line in these indicators will show, when the currency
pair is in the balance state, and when it experiences this or that tension. Projection
from the intersection of indicator lines with the balance line can point out the
price, around which the currency is fluctuating, thus determining the periods of
flat or trend. At the picture Fig 4 blue vertical lines are drawn through the intersection points of the indicator
lines. They allow to determine the equilibrium price for the pair EURUSD. Thus,
we can transfer the balance line onto a price chart (purple line). Actually there
is a special indicator Complex_balance, which allows to do it automatically. But
analyzing this indicator is outside the topic of this article. You can find more
information about it on the site Onix.
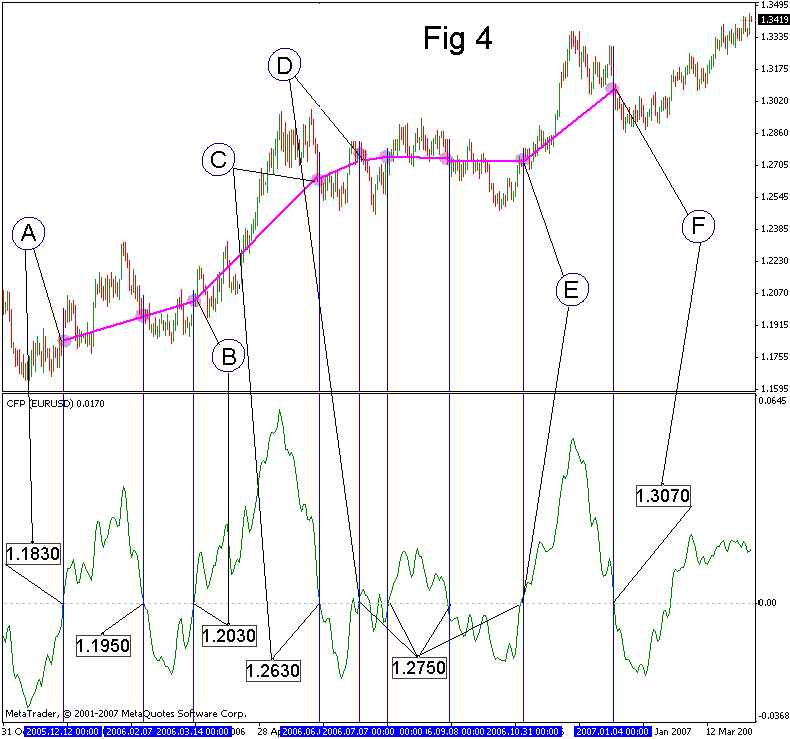
The horizontal balance line on the price charts shows that the currency pair is
in flat. If it is sloping, the pair is in trend. Thus, for example, the period
between A and B is determined as a trend. The period BC is a strong trend, and
CD is its fading. After that in the period DE the pair was in consolidation, and
in the period EF we see a new trend on the pair EURUSD.
Tactical Trading Techniques with Cluster Indicators
To tactical techniques we refer trade signals for short-term and medium-term trading, as well as determination of the nearest levels, which can be used for setting targets and stop signals.
Trading Using the Balance Line on a Chart
As an example we will analyze the pair EURUSD and the same timeframe, described
earlier. The initial position is the presence of points A and B, which show that
the price is in trend, and two levels of price range on a chart - 1.1635 and 1.
2320 (See Fig 5).
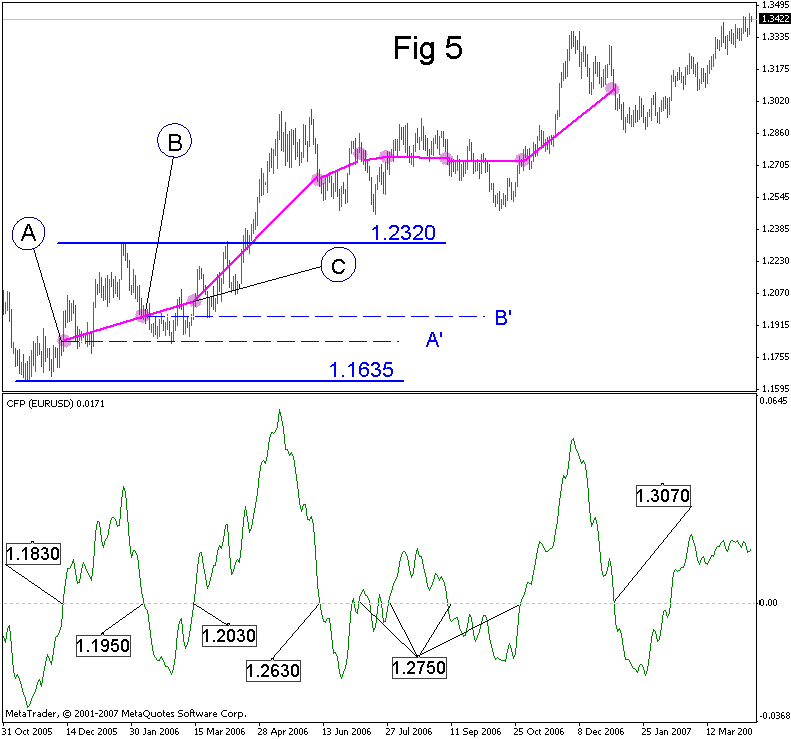
Two horizontal dotted lines are drawn from points A and B. In future they will give
support to the uptrend. You can buy starting from these lines in the direction
of the uptrend. We buy from the line A' until point C appears. After that we expect
the price to return till the line B'. While the point C proved the continuation
of the trend, buying from the line B' is appropriate. After the point C we expect
the appearance of the next point D and returning to level C' (See Fig 5a).
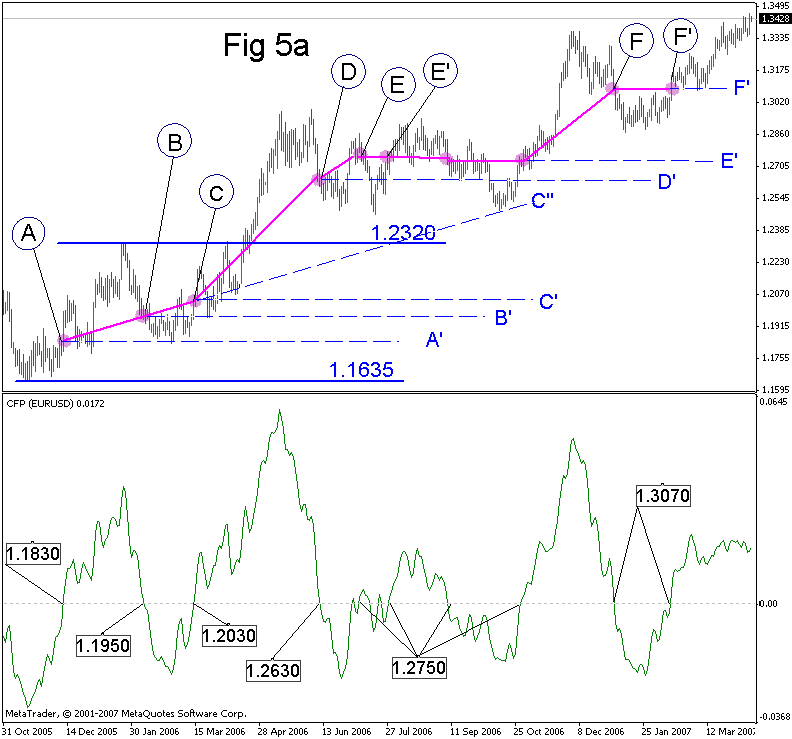
But this returning did not happen, because the trend became stronger and the point
D appeared much higher than we expected. The only trend support at this moment
can be the continuation of ABC trend main line - line C''. This support was used,
but after the pair consolidation period (DE in Fig 4), still a trend continued
due to this support. We see, that after the line E appeared, the balance line changed
its slope - the trend diminishes and the failure of the support of D' is quite
probable, what actually happened and the confirmation is the following: the next
point E shows there is no trend any more. The consolidation period will be over
only after testing the line C'', from which a trend can be renewed or, in case
of its failure, we expect the fall of the pair till C'. The history shows that
the trend continued (See picture Fig 5a). The appearance of the point F’ shows that the trend slows down. At the present moment of time we expect the formation of the next
point. The functioning supports of the trend are C'', E', F' (information at the moment of writing the article).
If the pair trend changes downwards, the target may be the line C', from which the price could not move upwards.
Trading Using Impulse Indicators
In trading on a separate currency pair the indicator Complex_pairs is used. First,
general definitions (See Fig 6).
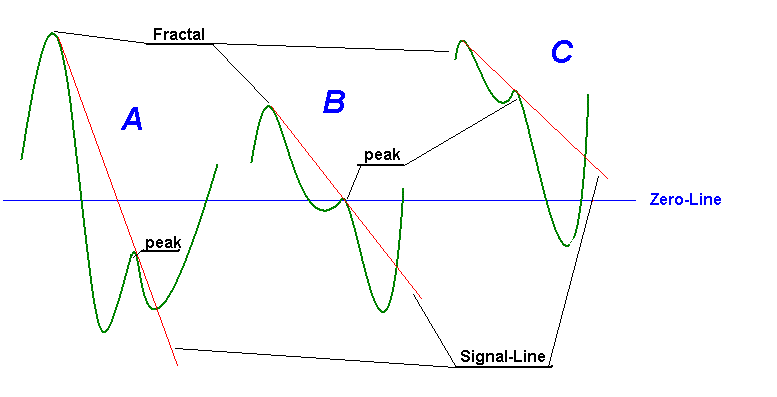
For determining a signal we need a clearly expressed Fractal - a sharp peak, which, as a rule, appears after strong movements. The second element
is the presence of a subsidiary (supporting) peak. From a fractal through this peak a signal line (a red line on the picture) is drawn. When the indicator line crosses a signal line,
an aggressive signal appears. At that, if the fractal was above a zero line, and
the intersection was below it, this is a signal to buy the pair analyzed.
This aggressive signal will be confirmed, when the indicator line crosses a balance
line. Trading may be different: you may buy at an aggressive signal, and add or
move the stop into lossless area. And sometimes you may act in a conservative way
and process only confirmed signals. Besides signals differ in their strength. In Fig 6, variant A is a strong signal, the probability of its processing is very high. Moreover its
potential is much higher than that of other variants. Variant B occurs much oftener than variant A, but the signal itself is much weaker, because the subsidiary peak is in the balance
line area. The third variant C is the weakest one. As a rule it is more likely to produce loss than profit. The
difference from the previous variants is the following: the intersection of the
indicator line and the balance line happens earlier, than crossing the signal line.
It happens so, that the indicator line after crossing the signal line goes down,
causing divergence. Such signal is considered to be the strongest one, but it happens
not very often. Let us view a practical example - the pair USDJPY is used to show
not only successful entries, but unsuccessful signals as well. In Fig 7, signals
are produced by the indicator Complex_pairs (original). Timeframe is H4. We analyze
signals only for variants A and B, because variant C is very weak.
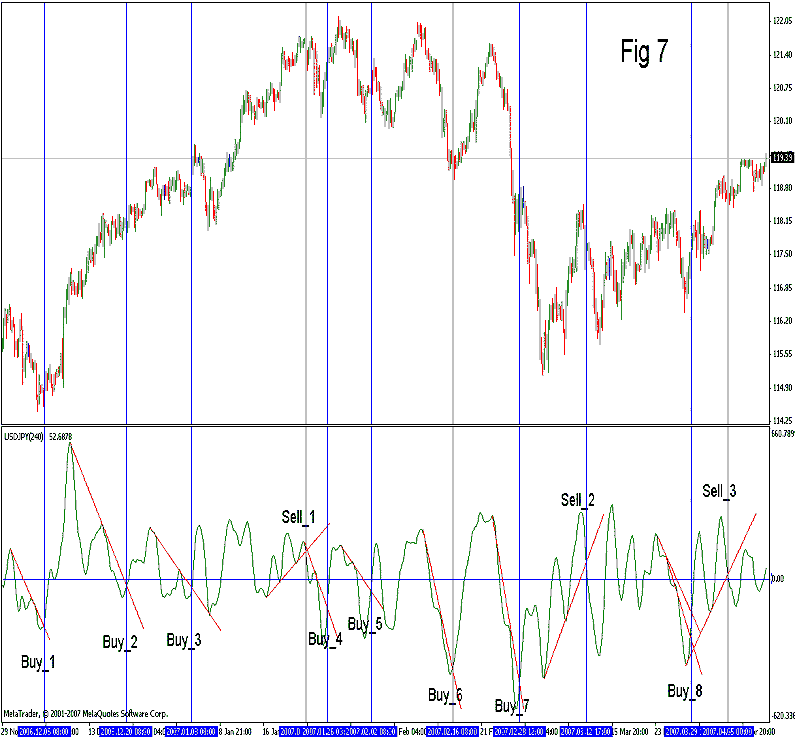
Red signal lines are drawn from a fractal through a subsidiary peak till the intersection
with the indicator line. The intersection point gives an aggressive entry signal,
Buy_N signals to buy the pair, Sell_N - signals to sell the pair. Through the intersection
points vertical lines are drawn; they help to see the entry points on the price
chart. The first signal to buy the pair (Buy_1) is very strong, because the subsidiary
peak is in the oversold zone. The signal Buy_2, is weaker than the previous one,
inspite of the fact, that the fractal itself is quite high, but the subsidiary
peak is above the zero line, though the signal point is below the balance line.
The same is with the signal Buy_3. But it is even weaker because, the fractal is
not very high and the signal line is very close to the balance line.
The signal Sell_1 is very strong, even though there is a small peak, but it has
two subsidiary peaks. Here we need to make one note. The signal comes after the
signal line crosses the balance line. You cannot trade by expectancies (open a
position before the intersection point, hoping that there will be such an intersection),
because the indicator line may move aside and not cross the signal line, or may
fail to reach it (See the signal Buy_8). The signal Buy_6 is a very strong signal,
like Buy_1. And the same as Buy_7. But exactly Buy_7, despite that it is a very
strong signal, did not function, moreover the movement in the opposite direction
was very impetuous. That is why any system needs predetermined levels of stop signals.
Talking about the indicator Complex_pairs, I would like to mention that it has a
light version Complex_pairs1. Their behaviour is almost identical on higher timeframes,
but differs on small ones. However Complex_pairs1 may operate with any financial
instrument, including stocks, futures and raw materials.
Strategical Trading Techniques in Cluster Indicators
Strategical trading using cluster indicators consists of determining a potential of new trends formation, entering ling-term positions and their tracing. As a rule trend-following indicators CCFp and CFP are used for these purposes.
Searching Promising Currency Pairs
Not very often, but from time to time there are such moments in the cluster, when
the generation of a new trend is expected. In Fig 8a you can see both indicators
CCFp (with all currencies) and CFP for the pair EURUSD (daily timeframe).
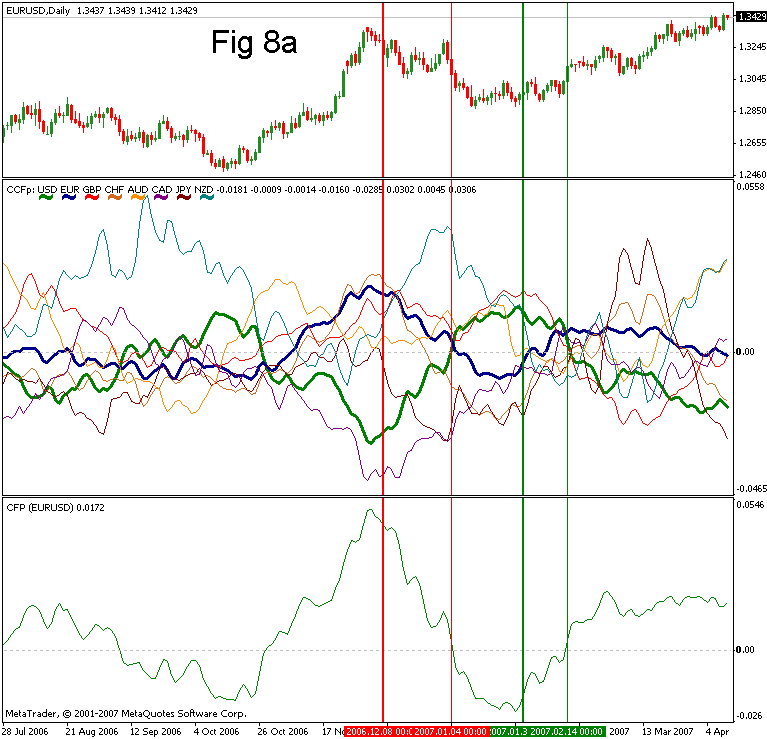
The advantage of these indicators is the following: if a currency starts falling
it is likely to continue falling due to the inertial character of such indicators.
The same is with the pair indicator CFP. In the picture there is a potential for
the pair EURUSD to fall, it is marked with a thick red vertical line. This line
is shifted from peaks to make sure that euro started falling and USD experiences
trend, and the pair EURUSD started falling. It is not seen on peaks in real trading.
But in medium-term and long-term meaning it is not so important to catch the peak,
because anyway we expect enough profit for not trying to catch a new trend from
the pivot point.
From the thick red line till the thin red line we see the formation of a new trend,
the intersection of currencies on the upper indicator and crossing of the balance
line on the lower one prove that the trend has changed. Usually after an intersection
point strong movements appear, i.e. a trend starts. As a rule, the trend movement
causes the reverse tension of currencies - the potential changes its sign. The
thick green line shows the appearance of a potential for the rise of this currency
pair, and the thin green line in the intersection point hindered the trend change.
But while the potential was not very strong, the movements are not very impetuous.
However such movements usually last longer.
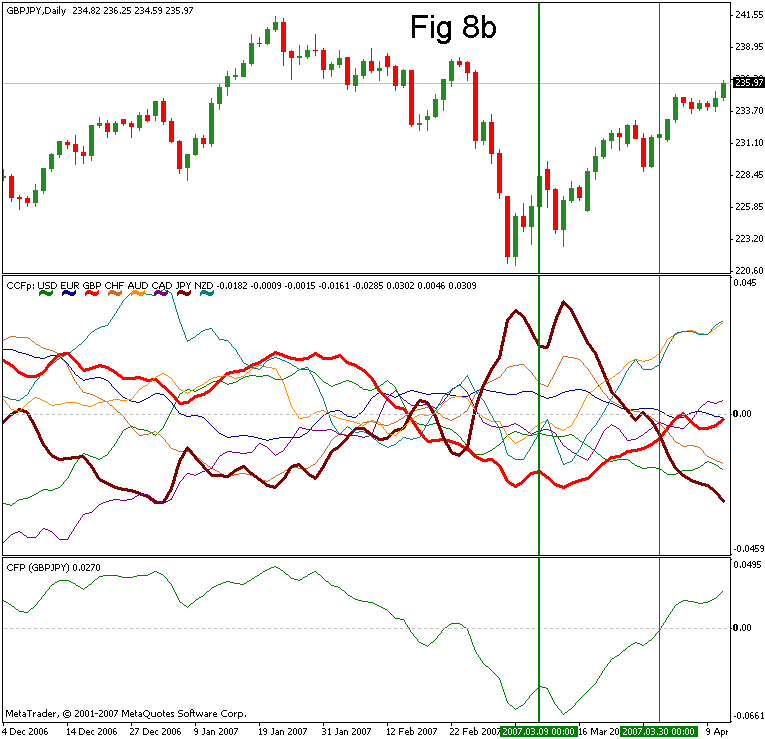
Now let us view the pair GBPJPY (Fig 8b). We have chosen this pair first because
the potential is relevant at the time of writing the article. Second, here we see
convergence on both - Pound and Yen. I.e. a signal came earlier, but the currencies
drew additional peaks against this potential, which caused formation of bull convergence
on this pair. Quite a rear case, it is convenient, because it allows to strengthen
the position, opened earlier.
Tracing Long-Term and Medium-Term Positions
When medium- and long-term positions are opened, it is necessary to take certain
steps, considered to be position tracing. Monitoring of a general direction is
controlled by trend-following indicators. A position is closed, when reverse potential
appears. Before this you do not always need to close positions fully, because very
often one currency changes its direction, while the other currency continues the
main one. In such periods currency pairs may be in flat or perform corrections.
Accumulation of a position, i.e. opening in the direction of earlier opened positions,
may be performed using signal indicators. It is convenient, because stop-signals
in this case will be much higher than in intraday trading. The same way using impulse
indicators we may fix profit, when signals opposite to the main movement come,
or open opposite positions aiming at getting backout or correction without closing
main positions.
Conclusion
In conclusion I would like to dwell on the question of indicator parameters. They were set for the cluster of eight currencies. If a smaller cluster is used, for example primary currencies are excluded, the parameters can be set more precisely. Besides, the parameters were preadjusted for timeframes higher than H4. If your trading system uses smaller timeframes, the parameters should be adjusted according to your trading system.
It should be also taken into account, that the indicators can be made more sensitive.
In this case they will produce signals earlier, though the amount of false signals
will be larger. Or on the contrary they can be made more inertial. In this case
signals will be rear and come later, but their reliability will be higher. Thus
it is recommended to change the indicator parameters not only according to your
own trading system, but also taking into account your trading mode and, if necessary,
your temperament.
Translated from Russian by MetaQuotes Ltd.
Original article: https://www.mql5.com/ru/articles/1472
 Three-Dimensional Graphs - a Professional Tool of Market Analyzing
 Break Through The Strategy Tester Limit On Testing Hedge EA
 How to Make the Detection and Recovery of Errors in an Expert Advisor Code Easier
 Trading Using Linux
- Free trading apps
- Over 8,000 signals for copying
- Economic news for exploring financial markets
You agree to website policy and terms of use
First Of All thanks for this massive job, i liked it alot,
I have a suggestion though
I noticed that i need to open all 8 Pairs charts and switch between them to get the updates, so the indicators can draw, Is there a solution for this problem for example an indicator to to this downloading thing for all 8 pairs with their time frames without bother opening these charts. ?
Hi,
It is a great work,
This is an interesting work, but when I looked at the source code I have some doubts.
I can see in the source code, that you use two moving averages with different lengths, that are computed this way for each currency pair:
double EURUSD_Fast = ma("EURUSD", Fast, MA_Method, Price, i);
double EURUSD_Slow = ma("EURUSD", Slow, MA_Method, Price, i);
The ma-method then calls the iMA method to compute the moving average:
res += iMA(sym, tf, per*k, ma_shift, Mode, Price, i);
Regarding the changes of currency strength, you iterate through the currency pairs, and compute it based on the two moving averages in this way:
arrUSD[i] += EURUSD_Slow / EURUSD_Fast - 1;
So you divide the two moving averages with different length to see if there is an uptrend or downtrend, subtract 1, and add this up.
But just take a look at this example of moving averages on Wikipedia:
http://en.wikipedia.org/wiki/File:MovingAverage.GIF
You have a green line (reflecting the Dow Jones in this case, but it can also be an exchange rate), and in the image below you have two moving averages of different lengths.
As you can see, starting from December, the green line has many ups and downs, a real zig zag of increases and decreases. However, if you look in the image below, the difference of the two moving averages is always positive. So you constantly add up currency strength, although the green line also has downtrends and not only uptrends. It´s not a matter of the length of the moving averages if it is 30 and 90 days, or 3 or 5 days, because you can also construct this for 3 to 5 days. Just replace the months on the scale with days. Therefore, I have some doubts that it works correctly this way.
Hi all
i am having problem loading CCP unot my H1 & h1 live account but they works normal on my demo. May i know why pls.
pls advise me
thk u